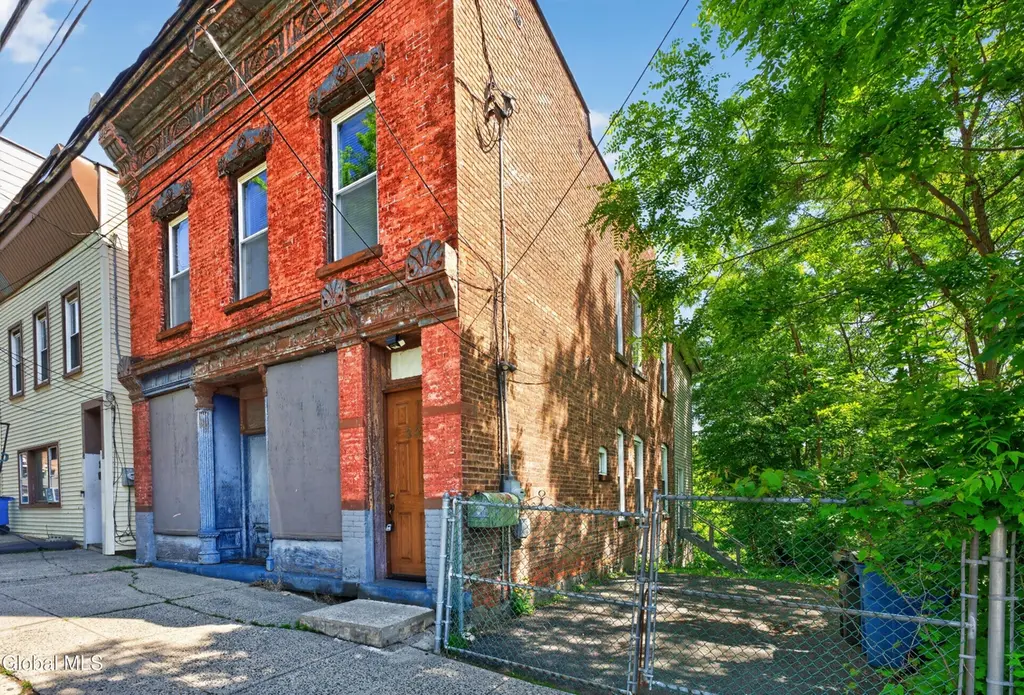
33 Egbert St · Cohoes, NY
Flood risk 1/10 · Minimal
- FEMA flood zone
- X (unshaded)
- Chance of flooding over 30 yrs
- 0.0%
- Est. flood insurance / yr
- $473 – $860
Fire risk 3/10 · Minor
- Est. fire insurance / yr
- $691 – $1,283
Heat risk 4/10 · Minor
- Hot days now (above 98°F)
- 7 days/yr
- Hot days in 30 yrs
- 17 days/yr
Wind risk 3/10 · Minor
- Chance of severe wind over 30 yrs
- 6.0%
Air-quality risk 2/10 · Minimal
- Unhealthy air days now
- 0 days/yr
- Unhealthy air days in 30 yrs
- 1 days/yr
Risk factors via First Street. Map © Google.
Why this score? — see what drove the B grade
The composite is a weighted blend of 9 inputs, each scored 0–100. Each bar is that input's sub-score; the figure is the points it added to the 100-point composite (weight × sub-score).
- Cash flow +30.0/30.0
- 1% rule +10.0/10.0
- DSCR +10.0/10.0
- ARV discount +7.5/15.0
- Rent growth +4.4/5.0
- Livability +4.2/5.0
- Schools +3.6/10.0
- Condition / age +2.5/5.0
- Appreciation +0.0/10.0
$134,900
🖨 Deal sheet (PDF) 📄 Offer letter ✓ Due diligence
Listing remarks
Affordable, Large, Brick Home in convenient Cohoes location. This almost 1800 square foot home features generous sized rooms, some hardwood floors, first floor laundry, large enclosed back porches, off street parking and much more. Great potential and opportunity!
Key facts
- 4,356 sq ft lot
- 2 parking spots
- Built 1880
Property features AI
Exterior
- Parking: 2 total parking spaces
- Utilities: Public water; Public sewer
- Home design: Single-family residence; Facing direction not specified; Entry level not specified; 1,728 living area (recorded)
- Construction: Brick construction
- Exterior features: Rear porch; Paved driveway
Interior
- Kitchen: Range; Refrigerator
- Bedrooms: One bedroom on the first floor; Three bedrooms on the second floor
- Bathrooms: 1 full bathroom located on the second floor
- Heating & cooling: Hot water heating
- Interior features: 8 total rooms; Full finished basement
- Laundry & utility: Dedicated laundry room; Washer and dryer included
Neighborhood map
What this means for you Summary
Snapshot
- This is a 6-bed/2.0-bath single-family listed at $135k.
Deal economics
- At list price, monthly cash flow is $884 ($11k/yr) — positive.
- The deal already cash-flows at list — no discount required.
- Meets the 1% rule at list price ($2k rent vs $135k).
- Recommended offer: $133k (1.5% below list) — sets the bar for market timing.
- Cap rate 14.2% vs local median 4.7% in Cohoes — top-decile yield for the area; either an underpriced asset or a hidden risk that comps aren't pricing in. Stress-test before assuming the spread holds.
Location & tenants
- Location reads 83/100 on livability (#61 in NY, #895 nationally) — a professional / high-income tenant draw. Strengths: amenities A+, commute A+, housing A+; Watch: employment C-.
- Cohoes City School District (suburban): math 38% / reading 48% proficiency, ranked #487 of 590 in NY (top 82%) — families likely to look elsewhere, expect single-tenant / working-renter base with shorter leases.
- Zoned schools: Harmony Hill School (math 37% / reading 42%, grade F, #1,444 of 2,108 statewide, top 71%, 379 students, 63% FRL); Cohoes Middle School (math 19% / reading 49%, grade F, #497 of 729 statewide, top 69%, 441 students, 68% FRL); Cohoes High School (math 72% / reading 74%, grade B+, #665 of 1,100 statewide, top 61%, 554 students, 63% FRL).
- Market conditions: Rents rising fast (+7.6%/yr); 114 active listings in the ZIP; 675 units permitted in Albany County in 2024 (451 in 5+ unit buildings).
- This rent runs 41% of the median local income ($66k/yr) — at the standard rent-burdened threshold; future hikes will face affordability resistance.
Forward outlook
- Local home prices are declining (-3.0%/yr); year-one equity from $933 of loan paydown is wiped out by about $4k of value loss. Plan a longer hold.
- Albany County population projected at +9% by 2050 — modest demand growth; plan on rents tracking national, not racing it.
- At projected returns (-3.0% appreciation + 7.6% rent growth), your $38k cash investment doubles in ~4 years — after that, you're playing with house money.
Negotiation context
- It's been on market 17 days — a 2% lower offer ($133k) is reasonable based on typical stale-listing flexibility.
Risks & watch-outs
- Watch-outs: built in 1880 — expect roof / HVAC / electrical / plumbing capex.
Questions for the listing agent
- Built in 1880 — when were the roof, HVAC, electrical panel, plumbing, and water heater last replaced?
- Is there a deadline driving the sale (1031 exchange, divorce, estate, relocation)? That informs how much negotiation room exists.
- What's the average days-on-market for RENTAL listings here right now (not sales)? A rising rental-DOM trend means longer vacancies and softer asking-rent achievability than the comps imply.
- What's the recent tenant-quality profile in this submarket — average credit score on applications, eviction rate, late-payment / NSF rate, and stable-employment percentage? A property-management company in the area should have these aggregated.
- How much new for-sale + rental construction is in the pipeline within 1–3 miles? Heavy new supply typically softens prices + rents 12–24 months out; constrained supply supports both.
Investment metrics
- 1% rule
- 1.68% ✓
- Cap rate
- 14.16%
- Cash-on-cash
- 28.10%
- DSCR
- 2.25
- GRM
- 5.0
CMA / ARV
No comps found within radius.
Projected returns pro-forma
-3.0% appreciation · 7.6% rent growth · sell at horizon
- IRR
- 27.3%
- Equity multiple
- 2.20×
- Total profit
- $45,457
- Equity at exit
- $20,114
- IRR
- 37.5%
- Equity multiple
- 5.28×
- Total profit
- $161,693
- Equity at exit
- $11,664
Cash invested: $37,772 (down + closing). Projections, not guarantees.
Landlord ↔ Tenant lean methodology
- Overall (STATE)
- 15 Strongly Tenant-Friendly
- State New York
- 15 Strongly Tenant-Friendly · D+10
- County
- — inherits STATE
- City
- — inherits STATE
ZIP-level market 12047
- Home prices YoY
- -10.7%
- Rents YoY
- 7.6%
- Active inventory
- 114
- Price-to-rent
- 5.0×
Monthly cashflow live
- Estimated rent
- $2,265 medium interval (Pro) →
- Mortgage (P&I)
- −$707
- Tax from tax record
- −$141 /mo · $1,696/yr
- Insurance
- −$56
- HOA
- −$0
- Vacancy / Maint / Mgmt
- −$476
- Net cashflow
- $884
Break-even live
Sensitivity live
| Price | -10% $961 | -5% $923 | +0% $884 | +5% $846 | +10% $808 |
|---|---|---|---|---|---|
| Rent | -10% $705 | -5% $795 | +0% $884 | +5% $974 | +10% $1,063 |
| Rate | -1.0pp $952 | -0.5pp $919 | base $884 | +0.5pp $849 | +1.0pp $814 |
UW: 25.0% down · 7.5% · 30yr · 1.5% tax · 5.0% vac · 8.0% maint · 8.0% mgmt
Financing live
Cash to close
- Down payment
- $33,725
- Closing costs
- $4,047
- Reserves months
- —
- Total cash needed
- —
Loan-product check · same deal, 3 products live
Conventional
25% down · 7.5% · 30yr
- Down + closing
- —
- Monthly P&I
- —
- Monthly cashflow
- —
- DSCR
- —
- Eligible?
- —
Personal DTI + credit; lowest rate.
DSCR
20% down · 8.5% · 30yr
- Down + closing
- —
- Monthly P&I
- —
- Monthly cashflow
- —
- DSCR
- —
- Eligible?
- —
No personal income docs; deal must DSCR.
Hard money
10% down · 12.0% · 12mo
- Down + closing
- —
- Monthly P&I
- —
- Monthly cashflow
- —
- DSCR
- —
- Eligible?
- —
Short-term bridge; refi at stabilization.
Listing history 12 events
-
2026-06-21days on market $134,900 Active 17 DOM
-
2026-06-18days on market $134,900 Active 14 DOM
-
2026-06-17days on market $134,900 Active 13 DOM
-
2026-06-16days on market $134,900 Active 12 DOM
-
2026-06-15days on market $134,900 Active 11 DOM
-
2026-06-14days on market $134,900 Active 9 DOM
-
2026-06-13days on market $134,900 Active 8 DOM
-
2026-06-10days on market $134,900 Active 6 DOM
-
2026-06-09days on market $134,900 Active 5 DOM
-
2026-06-08days on market $134,900 Active 4 DOM
-
2026-06-07remarks 264-char remark
-
2026-06-07$134,900 Active 3 DOM
ⓘ Source: listings_history table (triggers on properties + properties_extension) + one-shot
backfill from property_details.listing_events for pre-trigger history.
Tax reassessment forecast NY · Partial reset (capped growth)
- Current annual tax
- $1,696 · $141/mo
- Projected year-2 tax
- $1,988 · $166/mo
- Expected delta
- +$292/yr (+$24/mo · 17.2%)
ⓘ Screening estimate from a state-policy table — verify with the county assessor before closing.
Climate risk First Street
- Flood 1/10 Low FEMA zone X (unshaded) · 0% chance over 30 yrs
- Wildfire 3/10 Moderate
- Heat 4/10 Moderate 7 d/yr ≥98°F today · 17 d/yr by 30 yrs out
- Wind 3/10 Moderate 6% chance of damaging wind over 30 yrs
- Air quality 2/10 Low 0 unhealthy d/yr today · 1 by 30 yrs out
Nearby sold comps map
Loading sold comps map…
Walkable amenities ~0.75 mi
Loading nearby amenities…
Taxation est. · year 1
- Rental income
- $27,181
- − Mortgage interest
- −$7,556
- − Property taxes
- −$1,696
- − Insurance
- −$674
- − Repairs & maintenance
- −$2,174
- − Management
- −$2,174
- − Depreciation
- −$3,924
- Taxable income
- $8,980
- Est. tax owed @ 24.0%
- −$2,155
- After-tax cash flow
- $8,458/yr
For passive investors: Depreciation is non-cash, so a rental often shows a tax loss while cash-flowing — sheltering income. Rental losses are passive: they offset passive income freely, and up to $25,000/yr can offset ordinary (W-2) income if you actively participate and your MAGI is under $100k (phasing out to $0 by $150k); unused losses carry forward. On sale, claimed depreciation is recaptured at up to 25%, and gains may owe capital-gains tax (a 1031 exchange can defer both). Figures are a year-1 estimate at your 24.0% rate — not tax advice; consult a CPA.
Schools (NCES district)
- District
- Cohoes City School District
- NCES district ID
- 3607980
- Math proficiency
- 38% ▼ -4.00%
- Reading proficiency
- 48% ▲ 3.00%
- Median HH income
- $45,104
- Composite
- 36.48/100
- National rank
- #4655
- State rank
- #487 of 590 in NY
Livability — Cohoes
- Score
- 83/100
- State rank
- #61
- US rank
- #895
Category grades
Schools grade is shown separately in the Schools card above.
Census & demographics
- Census place
- Cohoes, NY
- County
- Albany County · 196,626 people
- City population
- 23,532
- Metro
- Albany-Schenectady-Troy, NY
- Population (ZIP)
- 23,532
- Household income
- $66,071
- Rent vs Own
- Severe rent burden
- 1395.0
Population outlook (Albany County) Hauer SSP2
- Today (2025)
- 320,794 people
- By 2030
- 327,401 · +2.1%
- By 2040
- 338,218 · +5.4%
- By 2050
- 348,467 · +8.6%
- By 2075
- 381,693 · +19.0%
- By 2100
- 393,809 · +22.8%
Race, ethnicity, and origin ACS 2023
- Neighborhood character
- Predominantly White (70%)
- Race & ethnicity
- White 70% Two or more races 11% Black 9% Hispanic / Latino 7% Asian 5%
- Hispanic origin (detail)
- Puerto Rican 3% Dominican 2%
- Common ancestry
- Lithuanian 8% Romanian 6% Iranian 2%
- Foreign-born
- 9% · Canada, China
- Languages at home
- 87% English-only · Spanish 3% Other Indo-European 3% Chinese 2%
Political lean MEDSL · Albany
- 2024 margin
- Strong D (+25.8) · D 62.9% · R 37.1%
- 2008→2024 swing
- -3.6pp toward R · 2008: 29.4pp · 2024: 25.8pp
- All cycles
- 2024: D+25.8 2020: D+31.4 2016: D+24.3 2012: D+31.0 2008: D+29.4
Not yet ingested
- Civics
- —
Market trends
- HPI YoY
- ▼ -38.15%
- Current HPI
- 317.4057
- Rent YoY
- ▲ 7.60%
- Metro
- Albany-Schenectady-Troy, NY
- State GDP YoY
- ▲ 2.60%
- F500 in state
- 92
Industry mix (Fortune 500 HQ in NY)
| Industry | F500 HQs | Revenue |
|---|---|---|
| Financial Services | 10 | $950B |
|
||
| Consumer Goods | 9 | $162B |
|
||
| Insurance | 4 | $225B |
|
||
| Telecommunications | 2 | $144B |
|
||
| Pharmaceuticals | 2 | $112B |
|
||
| Media / Entertainment | 2 | $69B |
|
||
Price history
1 event — show timeline
- 2026-06-04 Listed $134,900 Global MLS
Property tax history
+2.9%/yrLatest (2025): $1,696 · +4.7% YoY. Source: county tax records.
Cash-flow waterfall
monthlySold comps — $/sqft
last 12 mo · ≤1 miLoading sold comps…