124 Red Deer Trce #5 · Dothan, AL
Flood risk No data
- FEMA flood zone
- —
- Chance of flooding over 30 yrs
- —
- Est. flood insurance / yr
- —
Fire risk No data
- Est. fire insurance / yr
- —
Heat risk No data
- Hot days now (above threshold)
- —
- Hot days in 30 yrs
- —
Wind risk No data
- Chance of severe wind over 30 yrs
- —
Air-quality risk No data
- Unhealthy air days now
- —
- Unhealthy air days in 30 yrs
- —
Risk factors via First Street. Map © Google.
Why this score? — see what drove the D grade
The composite is a weighted blend of 9 inputs, each scored 0–100. Each bar is that input's sub-score; the figure is the points it added to the 100-point composite (weight × sub-score).
- ARV discount +12.0/15.0
- Cash flow +10.3/30.0
- Condition / age +4.0/5.0
- Livability +3.2/5.0
- 1% rule +3.0/10.0
- DSCR +2.9/10.0
- Rent growth +2.5/5.0
- Schools +2.5/10.0
- Appreciation +0.0/10.0
$199,900
🖨 Deal sheet (PDF) 📄 Offer letter ✓ Due diligence
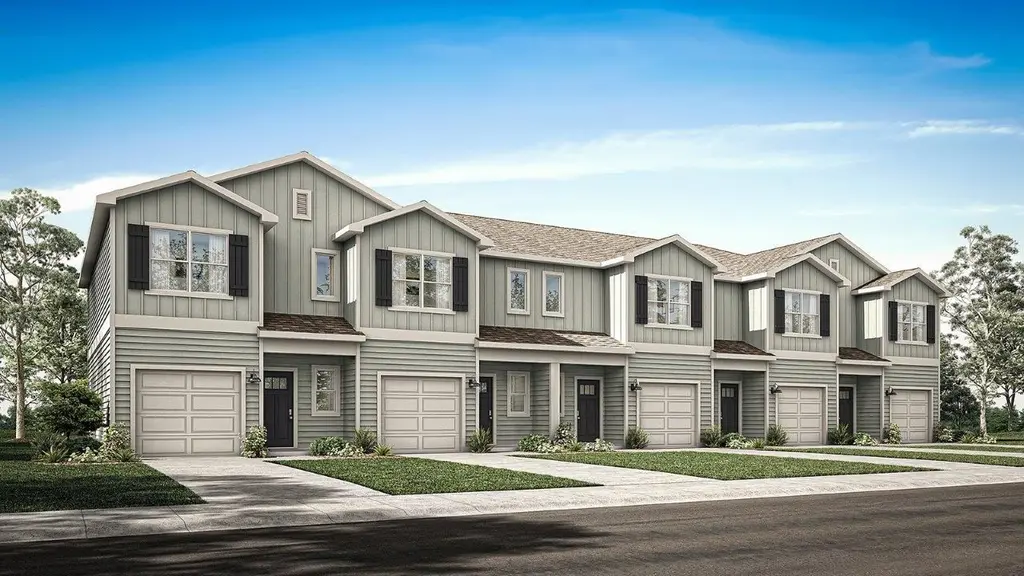
Listing remarks
Welcome to 124 Red Deer Trace Unit 5 at our Buckhead community featuring two-story Townhomes in Dothan, Alabama. These townhomes offer 3-bedrooms, 2.5-bathrooms, and 1-car garage with over 1,400 square feet of living space. When you enter the home, you'll be greeted by an open-concept first floor with a great room, dining area, and kitchen. The kitchen features quartz countertops, stainless steel appliances and a spacious walk-in pantry which are sure to make meal prep easy. The island is the perfect spot for your guests to sit and visit. Walking through the home, you can enter the 1-car garage near the kitchen. The first floor also features a powder room and outdoor patio looking out to yo
Key facts
- Quartz countertops
- Outdoor patio
- Garage
Tags
Property features AI
Finance
- Other: Virtual tour available
- Financial info: List price $199,900
Exterior
- Parking: 1 garage space (1 parking space total)
- Home design: Condo/Townhouse style unit at 124 Red Deer Trce #5, Dothan, AL 36301
- Exterior features: Living area approximately 1490
Interior
- Bedrooms: 3 bedrooms
- Bathrooms: 2 full bathrooms and 1 half bathroom (2.5 total)
- Interior features: Spec home (BUCKHEAD PALM B plan); Active listing
Neighborhood map
What this means for you Summary
Snapshot
- This is a 3-bed/2.5-bath townhouse listed at $200k. Condition is rated good.
Deal economics
- At list price, monthly cash flow is $-110 ($-1k/yr) — negative.
- To cash-flow at today's rent, offer at most $184k (8.0% below list).
- To meet the 1% rule (rent ≥ 1% of price), the offer needs to be $161k (19.5% below list).
- Recommended offer: $161k (19.5% below list) — sets the bar for 1% rule.
- Cap rate 5.6% vs local median 4.4% in Dothan — meaningfully above typical; check what's discounted (condition, days-on-market, listing class) to confirm the premium yield is real.
Location & tenants
- Location reads 64/100 on livability (#146 in AL) — a middle-class / working-renter tenant base. Strengths: cost of living A+, housing A+, health & safety A+; Watch: employment D, crime F, amenities F.
- Dothan City (urban): math 19% / reading 39% proficiency, ranked #73 of 129 in AL (top 57%) — low school quality limits family demand, transient renter base, plan for 1-2y turnover.
- Zoned schools: Selma Street Elementary School (math 13% / reading 33%, grade F, #431 of 627 statewide, top 69%, 413 students, 93% FRL); Dothan Preparatory Academy (math 12% / reading 38%, grade F, #163 of 257 statewide, top 64%, 1,133 students, 78% FRL) — zoned schools average 85% FRL vs 59% district-wide (26 pts higher); higher-poverty schools than district average — tighter screening recommended.
- Market conditions: 412 active listings in the ZIP; 4 comparable units currently listed for rent nearby; rentals lingering (median 46d on market — plan ~5-8 weeks vacancy on turnover, expect pricing pressure); 100% of comp listings sitting > 30 days — soft ceiling on asking rent; 463 units permitted in Houston County in 2024 (96 in 5+ unit buildings).
Forward outlook
- Local home prices are declining (-3.0%/yr); year-one equity from $1k of loan paydown is wiped out by about $6k of value loss. Plan a longer hold.
- Houston County population projected at +7% by 2050 — modest demand growth; plan on rents tracking national, not racing it.
Negotiation context
- It's been on market 47 days — a 3% lower offer ($194k) is reasonable based on typical stale-listing flexibility.
Questions for the listing agent
- What do current leases actually rent for vs. the listed asking? Can we see a recent rent roll and the last 12 months of T-12 income?
- It's been on market 47 days. Have you received any prior offers? Is the seller open to a 20% concession, seller financing, or rate buy-down credit?
- Is there a deadline driving the sale (1031 exchange, divorce, estate, relocation)? That informs how much negotiation room exists.
- Schools are D-rated, which usually means shorter tenancies and higher turnover. Who's the typical renter profile here, and what's been the actual vacancy rate?
- Crime grade is F in this area — have there been break-ins, vandalism, or insurance claims at this property in the last 3 years? What carrier currently insures it and at what premium?
- The area grade is low — what's the realistic commute time and amenity access for the typical tenant pool here? Any planned neighborhood developments (good or bad) we should know about?
- What's the average days-on-market for RENTAL listings here right now (not sales)? A rising rental-DOM trend means longer vacancies and softer asking-rent achievability than the comps imply.
- What's the recent tenant-quality profile in this submarket — average credit score on applications, eviction rate, late-payment / NSF rate, and stable-employment percentage? A property-management company in the area should have these aggregated.
- How much new for-sale + rental construction is in the pipeline within 1–3 miles? Heavy new supply typically softens prices + rents 12–24 months out; constrained supply supports both.
Investment metrics
- 1% rule
- 0.80% ✗
- Cap rate
- 5.63%
- Cash-on-cash
- -2.36%
- DSCR
- 0.89
- GRM
- 10.4
CMA / ARV
- ARV (median comp)
- $222,037
- List price
- $199,900
- Delta
- -9.97%
- Verdict
- FAIR
- Comps
- 20 within 1.0 mi
Show comp detail 12 sales within ~0.75 mi
| Address | Dist | Beds/Ba | Sqft | Sold | Price | $/sf | Match |
|---|---|---|---|---|---|---|---|
| 117 Fawnfield Lane Unit 4 | 0.03mi | 3/2.5 | 1,490 (0%) | 2mo | $207,650 | $139 | 97 |
| 117 Fawnfield Lane Unit 2 | 0.04mi | 3/2.5 | 1,490 (0%) | 2mo | $199,900 | $134 | 97 |
| 117 Fawnfield Lane Unit 3 | 0.03mi | 3/2.5 | 1,490 (0%) | 2mo | $199,900 | $134 | 97 |
| 267 Fawnfield Lane Unit 5 | 0.03mi | 3/2.5 | 1,490 (0%) | 5mo | $199,900 | $134 | 94 |
| 267 Fawnfield Lane Unit 7 | 0.03mi | 3/2.5 | 1,490 (0%) | 5mo | $215,000 | $144 | 94 |
| 267 Fawnfield Lane Unit 3 | 0.03mi | 3/2.5 | 1,490 (0%) | 5mo | $199,900 | $134 | 94 |
| 267 Fawnfield Lane Unit 4 | 0.03mi | 3/2.5 | 1,490 (0%) | 5mo | $199,900 | $134 | 94 |
| 267 Fawnfield Lane Unit 6 | 0.04mi | 3/2.5 | 1,490 (0%) | 5mo | $199,900 | $134 | 94 |
| 312-4 Hidden Creek Cir | 0.25mi | 2/2.0 (-1) | 1,547 (+4%) | 4mo | $245,000 | $158 | 71 |
| 302-1 Hidden Creek Cir | 0.29mi | 2/2.0 (-1) | 1,401 (-6%) | 1mo | $249,500 | $178 | 69 |
| 328 Hidden Creek Cir #3 | 0.22mi | 2/2.0 (-1) | 1,374 (-8%) | 7mo | $210,000 | $153 | 64 |
| 304 Hidden Cir #2 | 0.29mi | 2/2.0 (-1) | 1,650 (+11%) | 1mo | $263,000 | $159 | 61 |
Match score weights: distance 35% · size 25% · config 20% · recency 20%. Top-matched comps best support the ARV.
Projected returns pro-forma
-3.0% appreciation · 3.0% rent growth · sell at horizon
- IRR
- -20.2%
- Equity multiple
- 0.30×
- Total profit
- $-39,393
- Equity at exit
- $29,806
- IRR
- -13.2%
- Equity multiple
- 0.23×
- Total profit
- $-43,250
- Equity at exit
- $17,284
Cash invested: $55,972 (down + closing). Projections, not guarantees.
Landlord ↔ Tenant lean methodology
- Overall (STATE)
- 90 Strongly Landlord-Friendly
- State Alabama
- 90 Strongly Landlord-Friendly · R+15
- County
- — inherits STATE
- City
- — inherits STATE
ZIP-level market 36301
- Home prices YoY
- -24.9%
- Active inventory
- 412
- Price-to-rent
- 10.4×
Monthly cashflow live
- Estimated rent
- $1,609 medium interval (Pro) →
- Mortgage (P&I)
- −$1,048
- Tax est. 1.5%
- −$250 /mo · $2,998/yr
- Insurance
- −$83
- HOA
- −$0
- Vacancy / Maint / Mgmt
- −$338
- Net cashflow
- $-110
Break-even live
Sensitivity live
| Price | -10% $28 | -5% $-41 | +0% $-110 | +5% $-179 | +10% $-248 |
|---|---|---|---|---|---|
| Rent | -10% $-237 | -5% $-174 | +0% $-110 | +5% $-47 | +10% $17 |
| Rate | -1.0pp $-10 | -0.5pp $-59 | base $-110 | +0.5pp $-162 | +1.0pp $-215 |
UW: 25.0% down · 7.5% · 30yr · 1.5% tax · 5.0% vac · 8.0% maint · 8.0% mgmt
Financing live
Cash to close
- Down payment
- $49,975
- Closing costs
- $5,997
- Reserves months
- —
- Total cash needed
- —
Loan-product check · same deal, 3 products live
Conventional
25% down · 7.5% · 30yr
- Down + closing
- —
- Monthly P&I
- —
- Monthly cashflow
- —
- DSCR
- —
- Eligible?
- —
Personal DTI + credit; lowest rate.
DSCR
20% down · 8.5% · 30yr
- Down + closing
- —
- Monthly P&I
- —
- Monthly cashflow
- —
- DSCR
- —
- Eligible?
- —
No personal income docs; deal must DSCR.
Hard money
10% down · 12.0% · 12mo
- Down + closing
- —
- Monthly P&I
- —
- Monthly cashflow
- —
- DSCR
- —
- Eligible?
- —
Short-term bridge; refi at stabilization.
Rent comps 4 comps
| Address | Beds | Baths | Sqft | Rent | $/sqft | DOM | Units | Dist |
|---|---|---|---|---|---|---|---|---|
| 306 Hidden Creek Cir #1 Dothan, AL | 2.0 | 2.0 | 1233 | $1,450 | $1.18 | 45d | 1 | 0.31mi |
| 31 Trillium Cir Dothan, AL | 1.0–3.0 | 1.0–2.0 | 958 | $1,290 | $1.35 | 45d | 15 | 1.03mi |
| 2004 Roebuck St Dothan, AL | 3.0 | 1.5 | 1609 | $1,175 | $0.73 | 45d | 1 | 1.13mi |
| 413 Christopher Dr Miami, AL | 3.0 | 2.0 | 1482 | $2,900 | $1.96 | 45d | 1 | 1.30mi |
Listing history 20 events
-
2026-06-22days on market $199,900 Active 47 DOM
-
2026-06-21days on market $199,900 Active 46 DOM
-
2026-06-19days on market $199,900 Active 44 DOM
-
2026-06-18days on market $199,900 Active 43 DOM
-
2026-06-17days on market $199,900 Active 42 DOM
-
2026-06-16days on market $199,900 Active 41 DOM
-
2026-06-15days on market $199,900 Active 40 DOM
-
2026-06-14days on market $199,900 Active 38 DOM
-
2026-06-12days on market $199,900 Active 37 DOM
-
2026-06-09days on market $199,900 Active 34 DOM
-
2026-06-08days on market $199,900 Active 33 DOM
-
2026-06-07days on market $199,900 Active 32 DOM
-
2026-06-05days on market $199,900 Active 29 DOM
-
2026-06-03days on market $199,900 Active 28 DOM
-
2026-06-02days on market $199,900 Active 27 DOM
-
2026-06-01days on market $199,900 Active 26 DOM
-
2026-05-31days on market $199,900 Active 25 DOM
-
2026-05-30days on market $199,900 Active 24 DOM
-
2026-05-08price $199,900 1397-char remark
-
2026-05-06$214,900 Active 1397-char remark
ⓘ Source: listings_history table (triggers on properties + properties_extension) + one-shot
backfill from property_details.listing_events for pre-trigger history.
Nearby sold comps map
Loading sold comps map…
Walkable amenities ~0.75 mi
Loading nearby amenities…
Taxation est. · year 1
- Rental income
- $19,309
- − Mortgage interest
- −$11,198
- − Property taxes
- −$2,998
- − Insurance
- −$1,000
- − Repairs & maintenance
- −$1,545
- − Management
- −$1,545
- − Depreciation
- −$5,815
- Taxable loss
- −$4,791
- Est. tax savings @ 24.0%
- +$1,150
- After-tax cash flow
- $-174/yr
For passive investors: Depreciation is non-cash, so a rental often shows a tax loss while cash-flowing — sheltering income. Rental losses are passive: they offset passive income freely, and up to $25,000/yr can offset ordinary (W-2) income if you actively participate and your MAGI is under $100k (phasing out to $0 by $150k); unused losses carry forward. On sale, claimed depreciation is recaptured at up to 25%, and gains may owe capital-gains tax (a 1031 exchange can defer both). Figures are a year-1 estimate at your 24.0% rate — not tax advice; consult a CPA.
Condition & rehab AI · 1 photo
This well-maintained townhome in Dothan, Alabama, is move-in ready with good condition and potential for minor updates to enhance its resale and rental value.
Value-add opportunities
- Both Painting exterior and interior — Enhances curb appeal and interior aesthetics
- Both Landscaping improvements — Enhances curb appeal and adds value
- Both New flooring in bathrooms — Improves aesthetics and functionality
- Both New kitchen appliances — Enhances functionality and appeal
Renovation cost estimate screening
Value-add ROI direction
- Both Painting exterior and interior — Enhances curb appeal and interior aesthetics ↑
- Both Landscaping improvements — Enhances curb appeal and adds value ↑
- Both New flooring in bathrooms — Improves aesthetics and functionality ↑
- Both New kitchen appliances — Enhances functionality and appeal ↑
ⓘ Cost ranges are severity-bucket heuristics (US national rule-of-thumb). Get contractor quotes + a written scope before underwriting a rehab budget.
Schools (NCES district)
- District
- Dothan City
- NCES district ID
- 0101230
- Math proficiency
- 19% ▼ -23.00%
- Reading proficiency
- 39% ▼ -3.00%
- Median HH income
- $42,279
- Composite
- 24.56/100
- National rank
- #7640
- State rank
- #73 of 129 in AL
Livability — Dothan
- Score
- 64/100
- State rank
- #146
- US rank
- #13662
Category grades
Schools grade is shown separately in the Schools card above.
Census & demographics
- Census place
- Dothan, AL
- City population
- 47,783
- Population (ZIP)
- 38,627
Population outlook (Houston County) Hauer SSP2
- Today (2025)
- 110,280 people
- By 2030
- 112,668 · +2.2%
- By 2040
- 116,149 · +5.3%
- By 2050
- 117,805 · +6.8%
- By 2075
- 118,577 · +7.5%
- By 2100
- 110,940 · +0.6%
Race, ethnicity, and origin ACS 2023
- Neighborhood character
- Diverse neighborhood (Simpson 0.55)
- Race & ethnicity
- White 59% Black 31% Hispanic / Latino 5% Two or more races 5%
- Hispanic origin (detail)
- Mexican 3%
- Common ancestry
- Slovak 1% Italian 1% Lithuanian 1%
- Foreign-born
- 3% · Canada
- Languages at home
- 95% English-only · Spanish 4%
Political lean MEDSL · Houston
- 2024 margin
- Solid R (+47.8) · D 25.7% · R 73.5%
- 2008→2024 swing
- -7.0pp toward R · 2008: -40.8pp · 2024: -47.8pp
- All cycles
- 2024: R+47.8 2020: R+42.7 2016: R+47.6 2012: R+40.3 2008: R+40.8
Not yet ingested
- Civics
- —
Market trends
- HPI YoY
- ▼ -53.46%
- Current HPI
- 161.1212
- Rent YoY
- —
- Metro
- —
- State GDP YoY
- ▲ 2.94%
- F500 in state
- 4
Industry mix (Fortune 500 HQ in AL)
| Industry | F500 HQs | Revenue |
|---|---|---|
| Financial Services | 1 | $8B |
|
||
| Healthcare | 1 | $5B |
|
||
Cash-flow waterfall
monthlySold comps — $/sqft
last 12 mo · ≤1 miLoading sold comps…