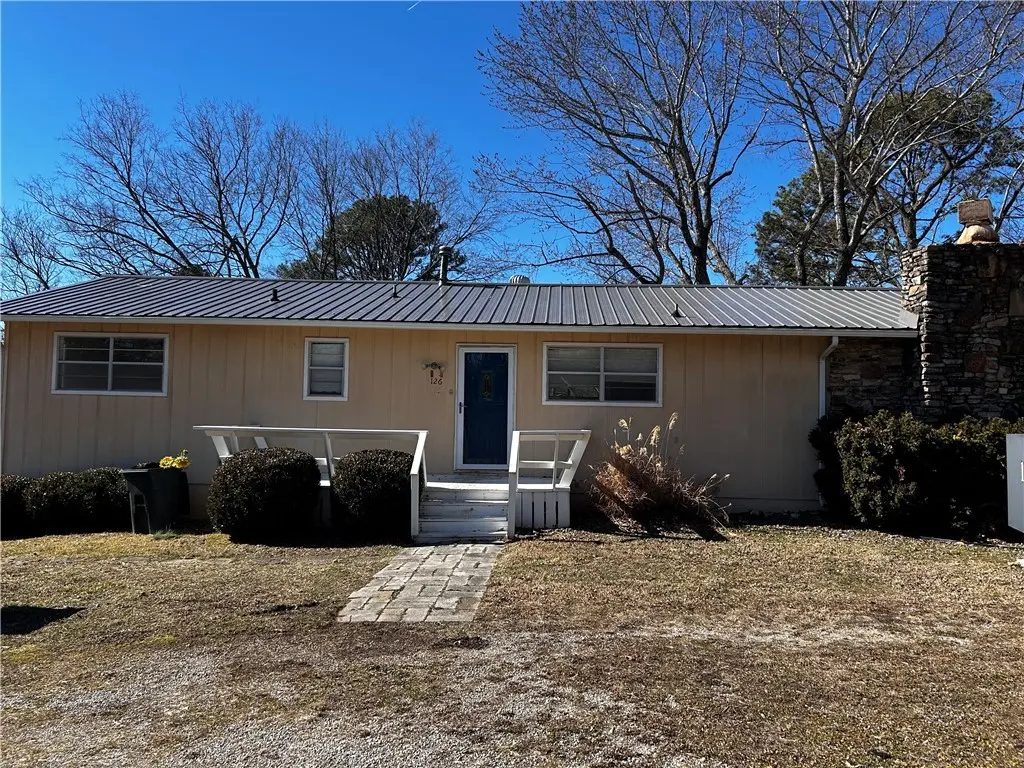
126 Shelton Dr · Eureka Springs, AR
Flood risk 1/10 · Minimal
- FEMA flood zone
- X (unshaded)
- Chance of flooding over 30 yrs
- 0.0%
- Est. flood insurance / yr
- $473 – $860
Fire risk 5/10 · Moderate
- Est. fire insurance / yr
- $1,499 – $2,785
Heat risk 4/10 · Minor
- Hot days now (above 105°F)
- 7 days/yr
- Hot days in 30 yrs
- 21 days/yr
Wind risk 2/10 · Minimal
- Chance of severe wind over 30 yrs
- 1.0%
Air-quality risk 1/10 · Minimal
- Unhealthy air days now
- 0 days/yr
- Unhealthy air days in 30 yrs
- 0 days/yr
Risk factors via First Street. Map © Google.
Why this score? — see what drove the D grade
The composite is a weighted blend of 9 inputs, each scored 0–100. Each bar is that input's sub-score; the figure is the points it added to the 100-point composite (weight × sub-score).
- ARV discount +15.0/15.0
- Cash flow +6.9/30.0
- Appreciation +4.1/10.0
- Schools +3.5/10.0
- Livability +3.4/5.0
- Rent growth +2.5/5.0
- Condition / age +2.5/5.0
- DSCR +1.2/10.0
- 1% rule +1.0/10.0
$215,000
🖨 Deal sheet 📄 Offer letter ✓ Due diligence
Listing remarks MLS
Centrally located 2 bed 2 bath home move in ready. New metal roof and separate heating systems plus a large wooden fireplace. Turn the walkout basement into another living quarters. Basement has separate HVAC. Gas range and cooktop for even cooking. Serve your meals on the back deck for lounging and listening to town. Close to amenities of town, minutes from downtown. Septic recently serviced and cleaned. Washer, dryer, and fridge convey.
Key facts
- Walkout basement
- Metal roof
- Separate hvac
Tags
Neighborhood map
What this means for you Summary
Snapshot
- This is a 2-bed/2.0-bath single-family listed at $215k.
Deal economics
- At list price, monthly cash flow is $-321 ($-4k/yr) — negative.
- To cash-flow at today's rent, offer at most $158k (26.4% below list).
- To meet the 1% rule (rent ≥ 1% of price), the offer needs to be $129k (40.2% below list).
- Recommended offer: $129k (40.2% below list) — sets the bar for 1% rule.
- Cap rate 4.5% vs local median 1.7% in Eureka Springs — top-decile yield for the area; either an underpriced asset or a hidden risk that comps aren't pricing in. Stress-test before assuming the spread holds.
Location & tenants
- Location reads 68/100 on livability (#78 in AR) — a middle-class / working-renter tenant base. Strengths: cost of living A+; Watch: crime C-, health & safety C-, amenities D.
- Eureka Springs School District (rural): math 37% / reading 46% proficiency, ranked #61 of 238 in AR (top 26%) — families likely to look elsewhere, expect single-tenant / working-renter base with shorter leases.
- Market conditions: 200 active listings in the ZIP; 30 units permitted in Carroll County in 2024 (0 in 5+ unit buildings).
Forward outlook
- Local home prices are declining (-1.8%/yr); year-one equity from $1k of loan paydown is wiped out by about $4k of value loss. Plan a longer hold.
- Carroll County population projected at +4% by 2050 — modest demand growth; plan on rents tracking national, not racing it.
Negotiation context
- It's been on market 134 days — a 12% lower offer ($189k) is reasonable based on typical stale-listing flexibility.
- 3 sale attempts since 10y ago; this cycle's ask has dropped $20k (9%) from the opening price — seller is motivated, your offer sets the floor, not the list.
- Current owner paid $160k; 34% above their basis — modest negotiation headroom, anchor on the comps not their cost.
Risks & watch-outs
- Climate carrying-cost: moderate wildfire risk — expect insurance premiums to compound above CPI over the hold.
Questions for the listing agent
- What do current leases actually rent for vs. the listed asking? Can we see a recent rent roll and the last 12 months of T-12 income?
- It's been on market 134 days. Have you received any prior offers? Is the seller open to a 40% concession, seller financing, or rate buy-down credit?
- Why hasn't it sold? Are there any deal-killer items the seller is aware of (foundation, flood, title, zoning, code violations)?
- Is there a deadline driving the sale (1031 exchange, divorce, estate, relocation)? That informs how much negotiation room exists.
- Schools are B-rated — typically a magnet for longer-tenancy family renters. What's the average tenant stay here, and is there a school-zone premium baked into asking?
- The area grade is low — what's the realistic commute time and amenity access for the typical tenant pool here? Any planned neighborhood developments (good or bad) we should know about?
- What's the average days-on-market for RENTAL listings here right now (not sales)? A rising rental-DOM trend means longer vacancies and softer asking-rent achievability than the comps imply.
- What's the recent tenant-quality profile in this submarket — average credit score on applications, eviction rate, late-payment / NSF rate, and stable-employment percentage? A property-management company in the area should have these aggregated.
- How much new for-sale + rental construction is in the pipeline within 1–3 miles? Heavy new supply typically softens prices + rents 12–24 months out; constrained supply supports both.
Investment metrics
- 1% rule
- 0.60% ✗
- Cap rate
- 4.50%
- Cash-on-cash
- -6.39%
- DSCR
- 0.72
- GRM
- 13.9
CMA / ARV
- ARV (median comp)
- $263,021
- List price
- $215,000
- Delta
- -18.26%
- Verdict
- UNDERPRICED
- Comps
- 20 within 1.0 mi
Show comp detail 1 sale within ~0.75 mi
| Address | Dist | Beds/Ba | Sqft | Sold | Price | $/sf | Match |
|---|---|---|---|---|---|---|---|
| 3 E Mountain Dr | 0.28mi | 3/1.5 (+1) | 1,215 (-3%) | 14mo | $220,000 | $181 | 63 |
Match score weights: distance 35% · size 25% · config 20% · recency 20%. Top-matched comps best support the ARV.
Projected returns pro-forma
-1.79% appreciation · 3.0% rent growth · sell at horizon
- IRR
- -18.7%
- Equity multiple
- 0.27×
- Total profit
- $-44,233
- Equity at exit
- $43,872
- IRR
- -12.0%
- Equity multiple
- 0.08×
- Total profit
- $-55,099
- Equity at exit
- $39,529
Cash invested: $60,200 (down + closing). Projections, not guarantees.
Landlord ↔ Tenant lean methodology
- Overall (STATE)
- 92 Strongly Landlord-Friendly
- State Arkansas
- 92 Strongly Landlord-Friendly · R+14
- County
- — inherits STATE
- City
- — inherits STATE
ZIP-level market 72632
- Home prices YoY
- -0.6%
- Active inventory
- 200
- Price-to-rent
- 13.9×
Monthly cashflow live
- Estimated rent
- $1,287 medium interval (Pro) →
- Mortgage (P&I)
- −$1,127
- Tax from tax record
- −$120 /mo · $1,441/yr
- Insurance
- −$90
- HOA
- −$0
- Vacancy / Maint / Mgmt
- −$270
- Net cashflow
- $-321
Break-even live
UW: 25.0% down · 7.5% · 30yr · 1.5% tax · 5.0% vac · 8.0% maint · 8.0% mgmt
Financing live
Cash to close
- Down payment
- $53,750
- Closing costs
- $6,450
- Reserves months
- —
- Total cash needed
- —
Loan-product check · same deal, 3 products live
Conventional
25% down · 7.5% · 30yr
- Down + closing
- —
- Monthly P&I
- —
- Monthly cashflow
- —
- DSCR
- —
- Eligible?
- —
Personal DTI + credit; lowest rate.
DSCR
20% down · 8.5% · 30yr
- Down + closing
- —
- Monthly P&I
- —
- Monthly cashflow
- —
- DSCR
- —
- Eligible?
- —
No personal income docs; deal must DSCR.
Hard money
10% down · 12.0% · 12mo
- Down + closing
- —
- Monthly P&I
- —
- Monthly cashflow
- —
- DSCR
- —
- Eligible?
- —
Short-term bridge; refi at stabilization.
Listing history 25 events
-
2026-06-18days on market $215,000 Active 134 DOM
-
2026-06-17days on market $215,000 Active 133 DOM
-
2026-06-16days on market $215,000 Active 132 DOM
-
2026-06-15days on market $215,000 Active 131 DOM
-
2026-06-14days on market $215,000 Active 129 DOM
-
2026-06-13days on market $215,000 Active 128 DOM
-
2026-06-10days on market $215,000 Active 126 DOM
-
2026-06-09days on market $215,000 Active 125 DOM
-
2026-06-08days on market $215,000 Active 124 DOM
-
2026-06-07days on market $215,000 Active 123 DOM
-
2026-06-05days on market $215,000 Active 120 DOM
-
2026-06-03days on market $215,000 Active 119 DOM
-
2026-06-02days on market $215,000 Active 118 DOM
-
2026-06-01days on market $215,000 Active 117 DOM
-
2026-05-31days on market $215,000 Active 116 DOM
-
2026-03-01price $215,000 442-char remark
Show marketing remark (442 chars)
Centrally located 2 bed 2 bath home move in ready. New metal roof and separate heating systems plus a large wooden fireplace. Turn the walkout basement into another living quarters. Basement has separate HVAC. Gas range and cooktop for even cooking. Serve your meals on the back deck for lounging and listening to town. Close to amenities of town, minutes from downtown. Septic recently serviced and cleaned. Washer, dryer, and fridge convey.
-
2026-02-04$235,000 Active 442-char remark
Show marketing remark (442 chars)
Centrally located 2 bed 2 bath home move in ready. New metal roof and separate heating systems plus a large wooden fireplace. Turn the walkout basement into another living quarters. Basement has separate HVAC. Gas range and cooktop for even cooking. Serve your meals on the back deck for lounging and listening to town. Close to amenities of town, minutes from downtown. Septic recently serviced and cleaned. Washer, dryer, and fridge convey.
-
2022-11-18soldstatus $160,000 Closed 329-char remark
Show marketing remark (329 chars)
Nicely maintained older home with tons of charm. Newer zoned HVAC system with extended warranty. Large deck off of the dining room. Wood burning insert in fireplace for a secondary heat source. Primary suite has en suite that has a handicap tub and shower unit. Tankless hot water heater. Large basement ready to be finished out.
-
2022-10-14status Pending 329-char remark
Show marketing remark (329 chars)
Nicely maintained older home with tons of charm. Newer zoned HVAC system with extended warranty. Large deck off of the dining room. Wood burning insert in fireplace for a secondary heat source. Primary suite has en suite that has a handicap tub and shower unit. Tankless hot water heater. Large basement ready to be finished out.
-
2022-10-13$160,000 Active 329-char remark
Show marketing remark (329 chars)
Nicely maintained older home with tons of charm. Newer zoned HVAC system with extended warranty. Large deck off of the dining room. Wood burning insert in fireplace for a secondary heat source. Primary suite has en suite that has a handicap tub and shower unit. Tankless hot water heater. Large basement ready to be finished out.
-
2016-07-01soldstatus $115,000
-
2016-01-09$119,500
-
2004-09-22soldstatus $90,000
-
1983-01-01soldstatus $45,000
-
1976-08-25soldstatus $25,000
ⓘ Source: listings_history table (triggers on properties + properties_extension) + one-shot
backfill from property_details.listing_events for pre-trigger history.
Tax reassessment forecast AR · Resets to sale price
- Current annual tax
- $1,441 · $120/mo
- Projected year-2 tax
- $1,441 · $120/mo
- Expected delta
- $0/yr ($0/mo · 0.0%)
ⓘ Screening estimate from a state-policy table — verify with the county assessor before closing.
Climate risk First Street
- Flood 1/10 Low FEMA zone X (unshaded) · 0% chance over 30 yrs
- Wildfire 5/10 Major
- Heat 4/10 Moderate 7 d/yr ≥105°F today · 21 d/yr by 30 yrs out
- Wind 2/10 Low 100% chance of damaging wind over 30 yrs
- Air quality 1/10 Low 0 unhealthy d/yr today · 0 by 30 yrs out
Nearby sold comps map
Loading sold comps map…
Walkable amenities ~0.75 mi
Loading nearby amenities…
Taxation est. · year 1
- Rental income
- $15,440
- − Mortgage interest
- −$12,043
- − Property taxes
- −$1,441
- − Insurance
- −$1,075
- − Repairs & maintenance
- −$1,235
- − Management
- −$1,235
- − Depreciation
- −$6,255
- Taxable loss
- −$7,845
- Est. tax savings @ 24.0%
- +$1,883
- After-tax cash flow
- $-1,966/yr
For passive investors: Depreciation is non-cash, so a rental often shows a tax loss while cash-flowing — sheltering income. Rental losses are passive: they offset passive income freely, and up to $25,000/yr can offset ordinary (W-2) income if you actively participate and your MAGI is under $100k (phasing out to $0 by $150k); unused losses carry forward. On sale, claimed depreciation is recaptured at up to 25%, and gains may owe capital-gains tax (a 1031 exchange can defer both). Figures are a year-1 estimate at your 24.0% rate — not tax advice; consult a CPA.
Schools (NCES district)
- District
- Eureka Springs School District
- NCES district ID
- 0505970
- Math proficiency
- 37% ▼ -23.00%
- Reading proficiency
- 46% ▼ -9.00%
- Median HH income
- $37,912
- Composite
- 34.55/100
- National rank
- #5171
- State rank
- #61 of 238 in AR
Livability — Eureka Springs
- Score
- 68/100
- State rank
- #78
- US rank
- #9085
Category grades
Schools grade is shown separately in the Schools card above.
Census & demographics
- Census place
- Eureka Springs, AR
- City population
- 4,550
- Population (ZIP)
- 4,550
Population outlook (Carroll County) Hauer SSP2
- Today (2025)
- 28,014 people
- By 2030
- 28,006 · +-0.0%
- By 2040
- 28,242 · +0.8%
- By 2050
- 29,169 · +4.1%
- By 2075
- 33,935 · +21.1%
- By 2100
- 39,497 · +41.0%
Race, ethnicity, and origin ACS 2023
- Neighborhood character
- Predominantly White (86%)
- Race & ethnicity
- White 86% Two or more races 9% Hispanic / Latino 3% Native American 2%
- Common ancestry
- Italian 3% Slovak 3% Serbian 2%
- Foreign-born
- 2% · Canada
- Languages at home
- 98% English-only · Spanish 1% German/W. Germanic 1%
Political lean MEDSL · Carroll
- 2024 margin
- Solid R (+31.7) · D 33.0% · R 64.7% · Other 2.2%
- 2008→2024 swing
- -13.6pp toward R · 2008: -18.1pp · 2024: -31.7pp
- All cycles
- 2024: R+31.7 2020: R+28.8 2016: R+32.3 2012: R+23.9 2008: R+18.1
Not yet ingested
- Civics
- —
Market trends
- HPI YoY
- ▼ -1.79%
- Current HPI
- 284.3048
- Rent YoY
- —
- Metro
- —
- State GDP YoY
- ▲ 3.80%
- F500 in state
- 10
Industry mix (Fortune 500 HQ in AR)
| Industry | F500 HQs | Revenue |
|---|---|---|
| Retail | 1 | $681B |
|
||
| Food / Agriculture | 1 | $53B |
|
||
| Retail / Energy | 1 | $22B |
|
||
| Transportation / Logistics | 1 | $12B |
|
||
| Energy | 1 | $4B |
|
||
Price history
+760.0% since first listed10 events — show timeline
- 2026-03-01 Price Changed $215,000 NWARMLS
- 2026-02-04 Listed $235,000 NWARMLS
- 2022-11-18 Sold (MLS) $160,000 NWARMLS
- 2022-10-14 Pending — NWARMLS
- 2022-10-13 Listed $160,000 NWARMLS
- 2016-07-01 Sold (MLS) $115,000 NWARMLS
- 2016-01-09 Listed $119,500 NWARMLS
- 2004-09-22 Sold (Public Records) $90,000 Public Records
- 1983-01-01 Sold (Public Records) $45,000 Public Records
- 1976-08-25 Sold (Public Records) $25,000 Public Records
Property tax history
+3.4%/yrLatest (2025): $1,441 · +9.3% YoY. Source: county tax records.
Cash-flow waterfall
monthlySold comps — $/sqft
last 12 mo · ≤1 miLoading sold comps…