2213 Pedernales Ct · Canyon Creek, TX
Flood risk 1/10 · Minimal
- FEMA flood zone
- X (unshaded)
- Chance of flooding over 30 yrs
- 0.0%
- Est. flood insurance / yr
- $507 – $1,088
Fire risk 4/10 · Minor
- Est. fire insurance / yr
- $1,222 – $2,270
Heat risk 7/10 · Major
- Hot days now (above 108°F)
- 7 days/yr
- Hot days in 30 yrs
- 24 days/yr
Wind risk 6/10 · Moderate
- Chance of severe wind over 30 yrs
- 27.0%
Air-quality risk 2/10 · Minimal
- Unhealthy air days now
- 1 days/yr
- Unhealthy air days in 30 yrs
- 2 days/yr
Risk factors via First Street. Map © Google.
Why this score? — see what drove the B- grade
The composite is a weighted blend of 9 inputs, each scored 0–100. Each bar is that input's sub-score; the figure is the points it added to the 100-point composite (weight × sub-score).
- Cash flow +30.0/30.0
- 1% rule +10.0/10.0
- DSCR +10.0/10.0
- ARV discount +7.5/15.0
- Schools +4.0/10.0
- Livability +3.0/5.0
- Rent growth +2.8/5.0
- Condition / age +2.5/5.0
- Appreciation +0.0/10.0
$69,900
🖨 Deal sheet (PDF) 📄 Offer letter ✓ Due diligence
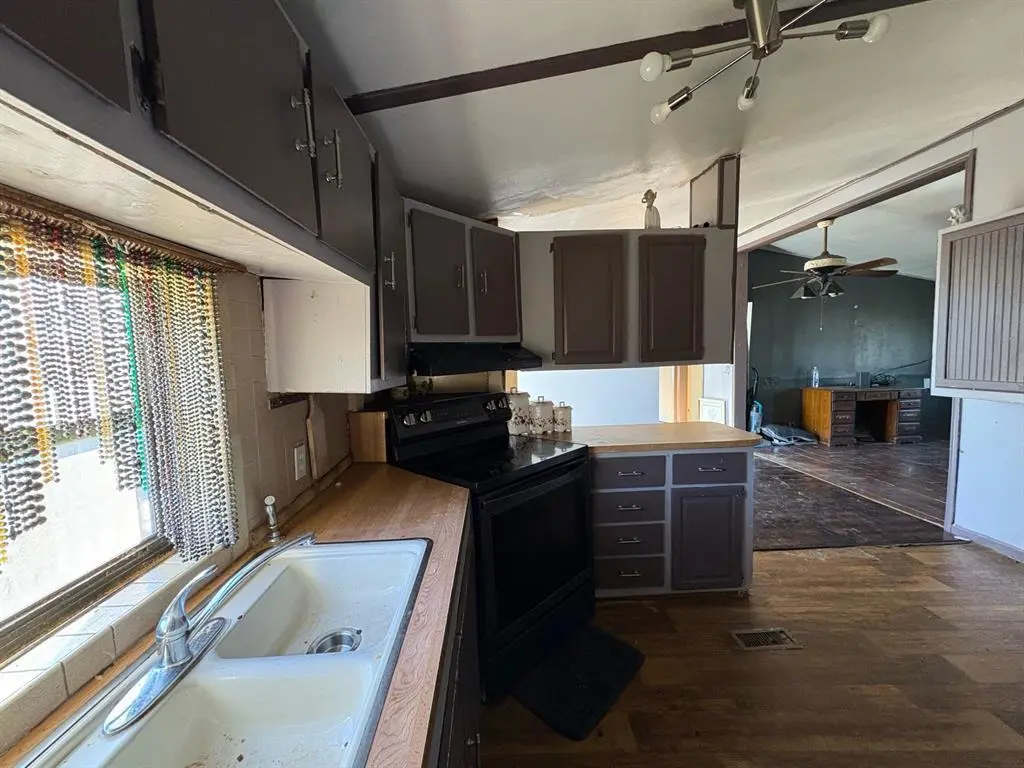
Listing remarks
This manufactured home with land offers a great opportunity for investors or buyers ready to add their personal touch! Featuring 3 bedrooms and 1 bathroom, this property is full of potential and possibilities. Situated on its own lot in an established area, it’s an excellent chance to renovate, update, or create your vision. Being sold AS-IS, this property is ideal for those looking for value and opportunity.
Key facts
- 7,187 sq ft lot
- Parking
- Built 1984
Property features AI
Finance
- Financial info: Listing terms include Cash and Owner-carry second
- HOA & community: Mandatory association (Canyon Creek POA); Semi-annual HOA fee of 150; Association fee includes management fees; HOA management phone: 817-573-3371
Exterior
- Parking: Carport (covered) with 1 covered space and 1 carport space
- Utilities: City water; City sewer; Not in a municipal utility district
- Home design: Single-family residence; Residential property; Built in 1984; Single-story
- Construction: Year built: 1984
- Exterior features: Lot less than 0.5 acre (approximately 0.165 acres); Subdivision: Canyon Creek
Interior
- Kitchen: Electric range; Built-in cabinets; Water line to refrigerator; Pantry
- Bedrooms: 3 bedrooms (all on the main level); Primary bedroom on main level with ensuite bath
- Bathrooms: 2 full bathrooms
- Interior features: Pantry; One living area; One dining area; Total room count of 8; One level (single-story)
- Laundry & utility: Laundry room on main level
Neighborhood map
What this means for you Summary
Snapshot
- This is a 3-bed/2.0-bath manufactured listed at $70k.
Deal economics
- At list price, monthly cash flow is $1k ($13k/yr) — positive.
- The deal already cash-flows at list — no discount required.
- Meets the 1% rule at list price ($2k rent vs $70k).
- Recommended offer: $68k (3.0% below list) — sets the bar for market timing.
- Cap rate 25.6% vs local median 4.7% in Canyon Creek — top-decile yield for the area; either an underpriced asset or a hidden risk that comps aren't pricing in. Stress-test before assuming the spread holds.
Location & tenants
- Location reads 60/100 on livability (#1,102 in TX) — a middle-class / working-renter tenant base. Strengths: cost of living A+, housing A+; Watch: health & safety D+, crime F, amenities F.
- Granbury ISD (town): math 46% / reading 46% proficiency, ranked #237 of 826 in TX (top 29%) — families likely to look elsewhere, expect single-tenant / working-renter base with shorter leases.
- Zoned schools: Mambrino School (math 53% / reading 48%, grade D+, #833 of 4,322 statewide, top 20%, 886 students, 53% FRL).
- Market conditions: Rents rising (+1.1%/yr); 929 active listings in the ZIP; 6 comparable units currently listed for rent nearby; rentals leasing fast (median 9d on market — plan ~1-2 weeks tenant-placement turnaround); 125 units permitted in Hood County in 2024 (0 in 5+ unit buildings).
- This rent runs 35% of the median local income ($70k/yr) — at the standard rent-burdened threshold; future hikes will face affordability resistance.
Forward outlook
- Local home prices are declining (-3.0%/yr); year-one equity from $483 of loan paydown is wiped out by about $2k of value loss. Plan a longer hold.
- Hood County population projected at +29% by 2050 — long-run rental-demand tailwind backs the buy-and-hold thesis.
- At projected returns (-3.0% appreciation + 1.1% rent growth), your $20k cash investment doubles in ~2 years — after that, you're playing with house money.
Negotiation context
- It's been on market 38 days — a 3% lower offer ($68k) is reasonable based on typical stale-listing flexibility.
- 4 sale attempts with the ask held roughly flat each time — persistent listings suggest the price (not the market) is what's stuck; bring a comps-based counter.
Risks & watch-outs
- Climate carrying-cost: major wind risk, 27% chance of damaging wind over 30y; extreme-heat days projected 7→24/yr by 2055 (HVAC capex compounding) — expect insurance premiums to compound above CPI over the hold.
Questions for the listing agent
- It's been on market 38 days. Have you received any prior offers? Is the seller open to a 3% concession, seller financing, or rate buy-down credit?
- What does the HOA fee cover, when was the last increase, and are there any pending special assessments or reserve-fund shortfalls?
- Is there a deadline driving the sale (1031 exchange, divorce, estate, relocation)? That informs how much negotiation room exists.
- Schools are F-rated, which usually means shorter tenancies and higher turnover. Who's the typical renter profile here, and what's been the actual vacancy rate?
- Crime grade is F in this area — have there been break-ins, vandalism, or insurance claims at this property in the last 3 years? What carrier currently insures it and at what premium?
- What's the average days-on-market for RENTAL listings here right now (not sales)? A rising rental-DOM trend means longer vacancies and softer asking-rent achievability than the comps imply.
- What's the recent tenant-quality profile in this submarket — average credit score on applications, eviction rate, late-payment / NSF rate, and stable-employment percentage? A property-management company in the area should have these aggregated.
- How much new for-sale + rental construction is in the pipeline within 1–3 miles? Heavy new supply typically softens prices + rents 12–24 months out; constrained supply supports both.
Investment metrics
- 1% rule
- 2.91% ✓
- Cap rate
- 25.56%
- Cash-on-cash
- 68.81%
- DSCR
- 4.06
- GRM
- 2.9
CMA / ARV
- ARV (median comp)
- $254,764
- List price
- $69,900
- Delta
- -72.56%
- Verdict
- UNDERPRICED
- Comps
- 20 within 1.0 mi
Show comp detail 1 sale within ~0.75 mi
| Address | Dist | Beds/Ba | Sqft | Sold | Price | $/sf | Match |
|---|---|---|---|---|---|---|---|
| 2400 Creek Dr | 0.53mi | 2/1.0 (-1) | 1,249 (+12%) | 7mo | $65,000 | $52 | 41 |
Match score weights: distance 35% · size 25% · config 20% · recency 20%. Top-matched comps best support the ARV.
Projected returns pro-forma
-3.0% appreciation · 1.1% rent growth · sell at horizon
- IRR
- 66.1%
- Equity multiple
- 3.88×
- Total profit
- $56,369
- Equity at exit
- $10,422
- IRR
- 69.8%
- Equity multiple
- 7.45×
- Total profit
- $126,177
- Equity at exit
- $6,044
Cash invested: $19,572 (down + closing). Projections, not guarantees.
Landlord ↔ Tenant lean methodology
- Overall (STATE)
- 87 Strongly Landlord-Friendly
- State Texas
- 87 Strongly Landlord-Friendly · R+5
- County
- — inherits STATE
- City
- — inherits STATE
ZIP-level market 76048
- Home prices YoY
- -23.4%
- Rents YoY
- 1.1%
- Active inventory
- 929
- Price-to-rent
- 2.9×
Monthly cashflow live
- Estimated rent
- $2,035 high interval (Pro) →
- Mortgage (P&I)
- −$367
- Tax from tax record
- −$65 /mo · $779/yr
- Insurance
- −$29
- HOA
- −$25
- Vacancy / Maint / Mgmt
- −$427
- Net cashflow
- $1,122
Break-even live
Sensitivity live
| Price | -10% $1,162 | -5% $1,142 | +0% $1,122 | +5% $1,103 | +10% $1,083 |
|---|---|---|---|---|---|
| Rent | -10% $962 | -5% $1,042 | +0% $1,122 | +5% $1,203 | +10% $1,283 |
| Rate | -1.0pp $1,158 | -0.5pp $1,140 | base $1,122 | +0.5pp $1,104 | +1.0pp $1,086 |
UW: 25.0% down · 7.5% · 30yr · 1.5% tax · 5.0% vac · 8.0% maint · 8.0% mgmt
Financing live
Cash to close
- Down payment
- $17,475
- Closing costs
- $2,097
- Reserves months
- —
- Total cash needed
- —
Loan-product check · same deal, 3 products live
Conventional
25% down · 7.5% · 30yr
- Down + closing
- —
- Monthly P&I
- —
- Monthly cashflow
- —
- DSCR
- —
- Eligible?
- —
Personal DTI + credit; lowest rate.
DSCR
20% down · 8.5% · 30yr
- Down + closing
- —
- Monthly P&I
- —
- Monthly cashflow
- —
- DSCR
- —
- Eligible?
- —
No personal income docs; deal must DSCR.
Hard money
10% down · 12.0% · 12mo
- Down + closing
- —
- Monthly P&I
- —
- Monthly cashflow
- —
- DSCR
- —
- Eligible?
- —
Short-term bridge; refi at stabilization.
Rent comps 6 comps
| Address | Beds | Baths | Sqft | Rent | $/sqft | DOM | Units | Dist |
|---|---|---|---|---|---|---|---|---|
| 4710 Llano St Granbury, TX | 3.0 | 2.0 | 1456 | $1,775 | $1.22 | 44d | 1 | 0.37mi |
| 2414 Forest Hill Ln Granbury, TX | 3.0 | 2.0 | 1493 | $2,150 | $1.44 | 5d | 1 | 0.39mi |
| 2700 Steepleridge Cir Granbury, TX | 3.0 | 2.0 | 1438 | $1,895 | $1.32 | 8d | 1 | 0.45mi |
| 5522 Firewood Trl Granbury, TX | 3.0 | 2.0 | 1437 | $2,400 | $1.67 | 44d | 1 | 0.58mi |
| 5621 San Jacinto Dr Granbury, TX | 3.0 | 2.0 | 1477 | $2,100 | $1.42 | 8d | 1 | 1.15mi |
| 5718 Barkridge Dr Granbury, TX | 3.0 | 2.0 | 1445 | $2,070 | $1.43 | 0d | 1 | 1.17mi |
HOA detail
- Monthly dues
- $25 · $300/yr
Listing history 26 events
-
2026-06-21days on market $69,900 Active 38 DOM
-
2026-06-18days on market $69,900 Active 35 DOM
-
2026-06-17days on market $69,900 Active 34 DOM
-
2026-06-16days on market $69,900 Active 33 DOM
-
2026-06-15days on market $69,900 Active 32 DOM
-
2026-06-13days on market $69,900 Active 30 DOM
-
2026-06-09days on market $69,900 Active 26 DOM
-
2026-06-08days on market $69,900 Active 25 DOM
-
2026-06-07days on market $69,900 Active 24 DOM
-
2026-06-04days on market $69,900 Active 21 DOM
-
2026-06-03days on market $69,900 Active 20 DOM
-
2026-06-02days on market $69,900 Active 19 DOM
-
2026-06-02days on market $69,900 Active 18 DOM
-
2026-05-31days on market $69,900 Active 17 DOM
-
2026-05-18historical Active Option Contract 418-char remark
-
2026-05-14$69,900 Active 418-char remark
-
2025-12-16historical
-
2025-11-06$99,000 Active
-
2025-10-15historical
-
2025-09-24price $129,000
-
2025-09-17price $139,000
-
2025-09-10$148,900 Active
-
2025-01-30soldstatus
-
2024-12-19soldstatus
-
2024-12-19soldstatus
-
2010-02-03soldstatus
ⓘ Source: listings_history table (triggers on properties + properties_extension) + one-shot
backfill from property_details.listing_events for pre-trigger history.
Tax reassessment forecast TX · Resets to sale price
- Current annual tax
- $779 · $65/mo
- Projected year-2 tax
- $1,279 · $107/mo
- Expected delta
- +$501/yr (+$42/mo · 64.3%)
ⓘ Screening estimate from a state-policy table — verify with the county assessor before closing.
Climate risk First Street
- Flood 1/10 Low FEMA zone X (unshaded) · 0% chance over 30 yrs
- Wildfire 4/10 Moderate
- Heat 7/10 Severe 7 d/yr ≥108°F today · 24 d/yr by 30 yrs out
- Wind 6/10 Major 27% chance of damaging wind over 30 yrs
- Air quality 2/10 Low 1 unhealthy d/yr today · 2 by 30 yrs out
Nearby sold comps map
Loading sold comps map…
Walkable amenities ~0.75 mi
Loading nearby amenities…
Taxation est. · year 1
- Rental income
- $24,424
- − Mortgage interest
- −$3,915
- − Property taxes
- −$779
- − Insurance
- −$350
- − Repairs & maintenance
- −$1,954
- − Management
- −$1,954
- − HOA
- −$300
- − Depreciation
- −$2,033
- Taxable income
- $13,139
- Est. tax owed @ 24.0%
- −$3,153
- After-tax cash flow
- $10,315/yr
For passive investors: Depreciation is non-cash, so a rental often shows a tax loss while cash-flowing — sheltering income. Rental losses are passive: they offset passive income freely, and up to $25,000/yr can offset ordinary (W-2) income if you actively participate and your MAGI is under $100k (phasing out to $0 by $150k); unused losses carry forward. On sale, claimed depreciation is recaptured at up to 25%, and gains may owe capital-gains tax (a 1031 exchange can defer both). Figures are a year-1 estimate at your 24.0% rate — not tax advice; consult a CPA.
Schools (NCES district)
- District
- Granbury ISD
- NCES district ID
- 4821390
- Math proficiency
- 46% ▬ 0.00%
- Reading proficiency
- 46% ▲ 4.00%
- Median HH income
- $55,856
- Composite
- 40.04/100
- National rank
- #3820
- State rank
- #237 of 826 in TX
Livability — Canyon Creek
- Score
- 60/100
- State rank
- #1102
- US rank
- #19485
Category grades
Schools grade is shown separately in the Schools card above.
Census & demographics
- Census place
- Canyon Creek, TX
- County
- Hood County · 58,506 people
- Metro
- Granbury, TX
- Population (ZIP)
- 27,000
- Household income
- $70,346
- Rent vs Own
- Severe rent burden
- 612.0
Population outlook (Hood County) Hauer SSP2
- Today (2025)
- 63,502 people
- By 2030
- 67,459 · +6.2%
- By 2040
- 74,958 · +18.0%
- By 2050
- 81,922 · +29.0%
- By 2075
- 98,872 · +55.7%
- By 2100
- 107,796 · +69.8%
Race, ethnicity, and origin ACS 2023
- Neighborhood character
- Predominantly White (80%)
- Race & ethnicity
- White 80% Hispanic / Latino 14% Two or more races 11% Black 1%
- Hispanic origin (detail)
- Mexican 13%
- Common ancestry
- Italian 2% Slovak 2% Portuguese 1%
- Foreign-born
- 4% · Canada
- Languages at home
- 89% English-only · Spanish 10%
Political lean MEDSL · Hood
- 2024 margin
- Solid R (+66.0) · D 16.6% · R 82.6%
- 2008→2024 swing
- -11.9pp toward R · 2008: -54.0pp · 2024: -66.0pp
- All cycles
- 2024: R+66.0 2020: R+64.1 2016: R+66.5 2012: R+64.7 2008: R+54.0
Not yet ingested
- Civics
- —
Market trends
- HPI YoY
- ▼ -83.25%
- Current HPI
- 272.2126
- Rent YoY
- ▲ 1.10%
- Metro
- Granbury, TX
- State GDP YoY
- ▲ 3.95%
- F500 in state
- 110
Industry mix (Fortune 500 HQ in TX)
| Industry | F500 HQs | Revenue |
|---|---|---|
| Energy | 16 | $1,198B |
|
||
| Technology | 5 | $198B |
|
||
| Engineering / Construction | 4 | $72B |
|
||
| Energy Services | 3 | $60B |
|
||
| Utilities | 3 | $41B |
|
||
| Healthcare | 2 | $330B |
|
||
Price history
-53.1% since first listed13 events — show timeline
- 2026-05-21 Relisted — NTREIS
- 2026-05-18 Contingent — NTREIS
- 2026-05-14 Listed $69,900 NTREIS
- 2025-12-16 Listing Removed — NTREIS
- 2025-11-06 Listed $99,000 NTREIS
- 2025-10-15 Listing Removed — NTREIS
- 2025-09-24 Price Changed $129,000 NTREIS
- 2025-09-17 Price Changed $139,000 NTREIS
- 2025-09-10 Listed $148,900 NTREIS
- 2025-01-30 Sold (Public Records) — Public Records
- 2024-12-19 Sold (Public Records) — Public Records
- 2024-12-19 Sold (Public Records) — Public Records
- 2010-02-03 Sold (Public Records) — Public Records
Property tax history
+6.1%/yrLatest (2025): $779 · -2.1% YoY. Source: county tax records.
Cash-flow waterfall
monthlySold comps — $/sqft
last 12 mo · ≤1 miLoading sold comps…