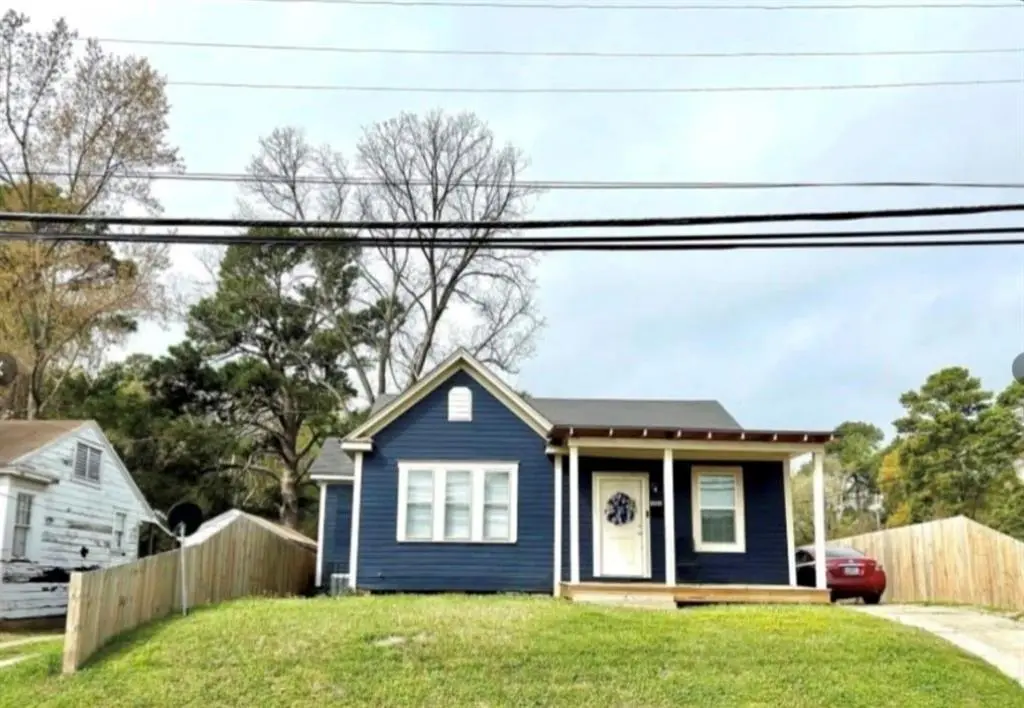
2812 Elm St · Shreveport, LA
Flood risk 1/10 · Minimal
- FEMA flood zone
- X (unshaded)
- Chance of flooding over 30 yrs
- 0.0%
- Est. flood insurance / yr
- $507 – $1,088
Fire risk 1/10 · Minimal
- Est. fire insurance / yr
- $1,269 – $2,357
Heat risk 7/10 · Major
- Hot days now (above 110°F)
- 7 days/yr
- Hot days in 30 yrs
- 22 days/yr
Wind risk 6/10 · Moderate
- Chance of severe wind over 30 yrs
- 66.0%
Air-quality risk 2/10 · Minimal
- Unhealthy air days now
- 1 days/yr
- Unhealthy air days in 30 yrs
- 2 days/yr
Risk factors via First Street. Map © Google.
Why this score? — see what drove the B- grade
The composite is a weighted blend of 9 inputs, each scored 0–100. Each bar is that input's sub-score; the figure is the points it added to the 100-point composite (weight × sub-score).
- Cash flow +26.7/30.0
- ARV discount +15.0/15.0
- DSCR +9.2/10.0
- 1% rule +6.6/10.0
- Rent growth +3.4/5.0
- Livability +3.0/5.0
- Condition / age +2.5/5.0
- Schools +2.2/10.0
- Appreciation +0.0/10.0
$100,000
🖨 Deal sheet (PDF) 📄 Offer letter ✓ Due diligence
Listing remarks MLS
IDEAL HOME FOR INVESTORS THAT YOU CAN ADD TO YOUR PORTFOLIO***ALSO THIS HOUSE QUALIFIES FOR FIRST TIME HOMEBUYER ASSISTANCE***POSSIBLE SHORT SALE OPPORTUNITY***NEWLY REMODELED 1957, 2 BEDROOMS AND 1 BATH WITH 1,296 SQ. FT. THIS HOME IS LOCATED IN THE EAST GLADSTONE SUBDIVISION***OPEN SPACIOUS LIVING ROOM AND MASTER BEDROOM WITH A VANITY AREA***IN THE ENTRY THERE IS AN ENCLOSED SITTING AREA***DINING ROOM FEATURES BUILTIN CHINA HUTCH***IN THE BACKYARD THERE IS A LARGE DECK ATTACHED TO THE BACK OF THE HOUSE AND A PRIVATE WOOD FENCE SURROUNDS THE PERIMETER OF THE PROPERTY***NO FLOOD ZONE***
Key facts
- Built 1957
- Listed 91 days
Neighborhood map
What this means for you Summary
Snapshot
- This is a 3-bed/1.0-bath single-family listed at $100k.
Deal economics
- At list price, monthly cash flow is $271 ($3k/yr) — positive.
- The deal already cash-flows at list — no discount required.
- Meets the 1% rule at list price ($1k rent vs $100k).
- Recommended offer: $91k (9.0% below list) — sets the bar for market timing.
- Cap rate 9.5% vs local median 5.7% in Shreveport — top-decile yield for the area; either an underpriced asset or a hidden risk that comps aren't pricing in. Stress-test before assuming the spread holds.
Location & tenants
- Location reads 59/100 on livability (#270 in LA) — a working-class tenant base; expect higher turnover. Strengths: cost of living A+, housing A; Watch: crime F, amenities F, commute F.
- Caddo Parish (urban): math 21% / reading 32% proficiency, ranked #53 of 98 in LA (top 54%) — low school quality limits family demand, transient renter base, plan for 1-2y turnover; 64% free/reduced lunch — lower-income household profile, screen leases tightly.
- Zoned schools: Creswell Elementary School (math 17% / reading 12%, grade F, #516 of 646 statewide, top 82%, 250 students, 81% FRL); Caddo Parish Middle Magnet School (math 79% / reading 93%, grade A+, #1 of 218 statewide, top 0%, 1,003 students, 23% FRL); C.E. Byrd High School (math 44% / reading 55%, grade D, #37 of 265 statewide, top 14%, 1,526 students, 43% FRL).
- Zoned-school proficiency averages 50% at this address vs 26% district-wide (+24 pts) — the actual schools serving this property are materially stronger than the Caddo Parish average implies; a family-tenant draw the district grade alone would hide.
- Market conditions: Rents rising (+3.6%/yr); 147 active listings in the ZIP; 40 comparable units currently listed for rent nearby; rentals at typical pace (median 23d on market — plan ~3-4 weeks tenant-placement turnaround); 221 units permitted in Caddo Parish in 2024 (0 in 5+ unit buildings).
Forward outlook
- Local home prices are declining (-3.0%/yr); year-one equity from $691 of loan paydown is wiped out by about $3k of value loss. Plan a longer hold.
- Caddo County population projected at -15% by 2050 — secular population decline; favor cash flow + early exit over multi-decade hold.
- At projected returns (-3.0% appreciation + 3.6% rent growth), your $28k cash investment doubles in ~10 years — after that, you're playing with house money.
Negotiation context
- It's been on market 91 days — a 9% lower offer ($91k) is reasonable based on typical stale-listing flexibility.
- 5 sale attempts since 2y ago with the ask held roughly flat each time — persistent listings suggest the price (not the market) is what's stuck; bring a comps-based counter.
Risks & watch-outs
- Watch-outs: built in 1957 — expect roof / HVAC / electrical / plumbing capex.
- Climate carrying-cost: major wind risk, 66% chance of damaging wind over 30y; extreme-heat days projected 7→22/yr by 2055 (HVAC capex compounding) — expect insurance premiums to compound above CPI over the hold.
Questions for the listing agent
- It's been on market 91 days. Have you received any prior offers? Is the seller open to a 9% concession, seller financing, or rate buy-down credit?
- Built in 1957 — when were the roof, HVAC, electrical panel, plumbing, and water heater last replaced?
- Why hasn't it sold? Are there any deal-killer items the seller is aware of (foundation, flood, title, zoning, code violations)?
- Is there a deadline driving the sale (1031 exchange, divorce, estate, relocation)? That informs how much negotiation room exists.
- Schools are D-rated, which usually means shorter tenancies and higher turnover. Who's the typical renter profile here, and what's been the actual vacancy rate?
- Crime grade is F in this area — have there been break-ins, vandalism, or insurance claims at this property in the last 3 years? What carrier currently insures it and at what premium?
- What's the average days-on-market for RENTAL listings here right now (not sales)? A rising rental-DOM trend means longer vacancies and softer asking-rent achievability than the comps imply.
- What's the recent tenant-quality profile in this submarket — average credit score on applications, eviction rate, late-payment / NSF rate, and stable-employment percentage? A property-management company in the area should have these aggregated.
- How much new for-sale + rental construction is in the pipeline within 1–3 miles? Heavy new supply typically softens prices + rents 12–24 months out; constrained supply supports both.
Investment metrics
- 1% rule
- 1.16% ✓
- Cap rate
- 9.54%
- Cash-on-cash
- 11.60%
- DSCR
- 1.52
- GRM
- 7.2
CMA / ARV
- ARV (median comp)
- $130,186
- List price
- $100,000
- Delta
- -23.19%
- Verdict
- UNDERPRICED
- Comps
- 20 within 1.0 mi
Show comp detail 12 sales within ~0.75 mi
| Address | Dist | Beds/Ba | Sqft | Sold | Price | $/sf | Match |
|---|---|---|---|---|---|---|---|
| 110 E Prospect St | 0.35mi | 3/1.0 | 1,211 (-7%) | 7mo | $87,000 | $72 | 67 |
| 728 Kimbrough St | 0.53mi | 3/1.0 | 1,239 (-4%) | 2mo | $136,800 | $110 | 67 |
| 738 Acklen St | 0.50mi | 2/1.0 (-1) | 1,293 (-0%) | 8mo | $115,000 | $89 | 65 |
| 123 Dalzell St | 0.43mi | 3/1.0 | 1,377 (+6%) | 7mo | $80,000 | $58 | 64 |
| 3035 Dallas St | 0.38mi | 3/1.0 | 1,111 (-14%) | 2mo | $100,000 | $90 | 57 |
| 129 E Wichita St | 0.71mi | 2/1.0 (-1) | 1,342 (+4%) | 3mo | $125,000 | $93 | 54 |
| 2801 E Cavett Dr | 0.69mi | 3/1.5 | 1,224 (-6%) | 5mo | $174,500 | $143 | 52 |
| 2608 E Cavett Dr | 0.59mi | 3/1.0 | 1,169 (-10%) | 5mo | $76,900 | $66 | 52 |
| 404 Washington St | 0.68mi | 3/2.0 | 1,367 (+6%) | 5mo | $130,000 | $95 | 51 |
| 2612 W Cavett Dr | 0.54mi | 3/1.0 | 1,121 (-14%) | 4mo | $130,000 | $116 | 49 |
| 131 Merrick St | 0.59mi | 2/1.0 (-1) | 1,433 (+11%) | 2mo | $40,000 | $28 | 48 |
| 225 E Elmwood St | 0.68mi | 3/1.5 | 1,117 (-14%) | 2mo | $89,500 | $80 | 42 |
Match score weights: distance 35% · size 25% · config 20% · recency 20%. Top-matched comps best support the ARV.
Projected returns pro-forma
-3.0% appreciation · 3.56% rent growth · sell at horizon
- IRR
- 1.6%
- Equity multiple
- 1.06×
- Total profit
- $1,678
- Equity at exit
- $14,910
- IRR
- 11.7%
- Equity multiple
- 1.94×
- Total profit
- $26,347
- Equity at exit
- $8,646
Cash invested: $28,000 (down + closing). Projections, not guarantees.
Landlord ↔ Tenant lean methodology
- Overall (STATE)
- 90 Strongly Landlord-Friendly
- State Louisiana
- 90 Strongly Landlord-Friendly · R+12
- County
- — inherits STATE
- City
- — inherits STATE
ZIP-level market 71104
- Home prices YoY
- -32.2%
- Rents YoY
- 3.6%
- Active inventory
- 147
- Price-to-rent
- 7.2×
Monthly cashflow live
- Estimated rent
- $1,162 high interval (Pro) →
- Mortgage (P&I)
- −$524
- Tax from tax record
- −$81 /mo · $974/yr
- Insurance
- −$42
- HOA
- −$0
- Vacancy / Maint / Mgmt
- −$244
- Net cashflow
- $271
Break-even live
Sensitivity live
| Price | -10% $327 | -5% $299 | +0% $271 | +5% $242 | +10% $214 |
|---|---|---|---|---|---|
| Rent | -10% $179 | -5% $225 | +0% $271 | +5% $316 | +10% $362 |
| Rate | -1.0pp $321 | -0.5pp $296 | base $271 | +0.5pp $245 | +1.0pp $218 |
UW: 25.0% down · 7.5% · 30yr · 1.5% tax · 5.0% vac · 8.0% maint · 8.0% mgmt
Financing live
Cash to close
- Down payment
- $25,000
- Closing costs
- $3,000
- Reserves months
- —
- Total cash needed
- —
Loan-product check · same deal, 3 products live
Conventional
25% down · 7.5% · 30yr
- Down + closing
- —
- Monthly P&I
- —
- Monthly cashflow
- —
- DSCR
- —
- Eligible?
- —
Personal DTI + credit; lowest rate.
DSCR
20% down · 8.5% · 30yr
- Down + closing
- —
- Monthly P&I
- —
- Monthly cashflow
- —
- DSCR
- —
- Eligible?
- —
No personal income docs; deal must DSCR.
Hard money
10% down · 12.0% · 12mo
- Down + closing
- —
- Monthly P&I
- —
- Monthly cashflow
- —
- DSCR
- —
- Eligible?
- —
Short-term bridge; refi at stabilization.
Rent comps 40 comps
| Address | Beds | Baths | Sqft | Rent | $/sqft | DOM | Units | Dist |
|---|---|---|---|---|---|---|---|---|
| 140 E Wilkinson St Shreveport, LA | 3.0 | 3.0 | 1174 | $1,300 | $1.11 | 23d | 1 | 0.25mi |
| 140 Wilkinson St Unit 142 Shreveport, LA | 3.0 | 3.0 | 1174 | $1,300 | $1.11 | 23d | 1 | 0.40mi |
| 140 Wilkinson St Unit 140 Shreveport, LA | 2.0 | 1.0 | 1000 | $1,200 | $1.20 | 23d | 1 | 0.40mi |
| 2515 Centenary Blvd Shreveport, LA | 2.0 | 1.0 | 1200 | $2,500 | $2.08 | 15d | 1 | 0.46mi |
| 715 Camilla Dr Shreveport, LA | 3.0 | 1.0 | 1654 | $1,350 | $0.82 | 46d | 1 | 0.57mi |
| 818 E Washington St Shreveport, LA | 3.0 | 1.0 | 1100 | $1,300 | $1.18 | 23d | 1 | 0.57mi |
| 2615 Judith Pl Shreveport, LA | 3.0 | 2.0 | 1450 | $1,600 | $1.10 | 15d | 1 | 0.58mi |
| 103 E Merrick St Shreveport, LA | 2.0 | 1.0 | 1200 | $900 | $0.75 | 46d | 1 | 0.58mi |
| 204 Boulevard St Shreveport, LA | 2.0 | 1.0 | 1028 | $1,195 | $1.16 | 46d | 1 | 0.60mi |
| 3516 Alexander Ave Shreveport, LA | 2.0 | 1.0 | 1355 | $1,250 | $0.92 | 15d | 1 | 0.60mi |
| 315 Robinson Pl Shreveport, LA | 2.0 | 1.0 | 1161 | $800 | $0.69 | 15d | 1 | 0.64mi |
| 126 E Olive St Shreveport, LA | 2.0 | 1.0 | 1200 | $1,500 | $1.25 | 15d | 1 | 0.66mi |
| 144 Merrick St Shreveport, LA | 2.0 | 1.0 | 1532 | $800 | $0.52 | 46d | 1 | 0.66mi |
| 315 Dalzell St Shreveport, LA | 2.0 | 2.5 | 1372 | $1,100 | $0.80 | 46d | 1 | 0.68mi |
| 336 Atkins Ave Shreveport, LA | 2.0 | 1.0 | 912 | $900 | $0.99 | 46d | 1 | 0.68mi |
| 2506 Mecom Dr Shreveport, LA | 3.0 | 1.5 | 1433 | $1,350 | $0.94 | 15d | 1 | 0.69mi |
| 328 Prospect St Shreveport, LA | 2.0 | 1.0 | 1641 | $1,000 | $0.61 | 46d | 1 | 0.69mi |
| 229 Stephenson St Shreveport, LA | 2.0 | 2.5 | 1500 | $1,300 | $0.87 | 15d | 1 | 0.72mi |
| 320 Stephenson St Shreveport, LA | 3.0 | 2.0 | 1845 | $1,675 | $0.91 | 15d | 1 | 0.76mi |
| 320 Stephenson St Shreveport, LA | 3.0 | 2.0 | 1845 | $1,675 | $0.91 | 23d | 1 | 0.76mi |
| 419 Boulevard St Shreveport, LA | 3.0 | 2.0 | 1852 | $1,100 | $0.59 | 46d | 1 | 0.80mi |
| 406 College St Shreveport, LA | 2.0 | 1.0 | 1215 | $900 | $0.74 | 46d | 1 | 0.83mi |
| 219 E Slattery Blvd Shreveport, LA | 2.0 | 1.0 | 1047 | $1,000 | $0.96 | 46d | 1 | 0.84mi |
| 431 College St Shreveport, LA | 2.0 | 2.0 | 1100 | $850 | $0.77 | 15d | 1 | 0.86mi |
| 143 E Herndon St Unit 143 Shreveport, LA | 2.0 | 1.0 | 1200 | $830 | $0.69 | 23d | 1 | 0.86mi |
| 127 Herndon St Shreveport, LA | 2.0 | 1.0 | 1325 | $800 | $0.60 | 15d | 1 | 0.91mi |
| 2109 Highland Ave Shreveport, LA | 3.0 | 1.0 | 1739 | $1,050 | $0.60 | 46d | 1 | 0.93mi |
| 442 Merrick St Shreveport, LA | 3.0 | 1.5 | 1595 | $1,000 | $0.63 | 46d | 1 | 0.93mi |
| 546 Dalzell St Shreveport, LA | 2.0 | 1.0 | 1000 | $875 | $0.88 | 23d | 1 | 0.95mi |
| 3305 Creswell Ave Shreveport, LA | 2.0 | 1.0 | 1307 | $1,350 | $1.03 | 23d | 1 | 0.95mi |
| 561 Forest Ave Shreveport, LA | 2.0 | 1.0 | 1358 | $1,350 | $0.99 | 23d | 1 | 0.95mi |
| 1301 Coates Bluff Dr Shreveport, LA | 1.0–2.0 | 1.0–2.0 | 1004 | $2,300 | $2.29 | 15d | 11 | 0.97mi |
| 642 Robinson Pl Shreveport, LA | 3.0 | 1.0 | 1500 | $1,275 | $0.85 | 23d | 1 | 1.02mi |
| 2903 Weyman St Shreveport, LA | 1.0–2.0 | 1.0 | 800 | $950 | $1.19 | 15d | 6 | 1.08mi |
| 1535 River Parkway Blvd Shreveport, LA | 1.0–3.0 | 1.0–2.0 | 928 | $2,042 | $2.20 | 15d | 10 | 1.09mi |
| 708 College St Shreveport, LA | 2.0 | 1.0 | 1156 | $925 | $0.80 | 15d | 1 | 1.16mi |
| 1225 Pecan St Unit B Shreveport, LA | 3.0 | 2.0 | 1070 | $900 | $0.84 | 23d | 1 | 1.19mi |
| 409 Egan St Shreveport, LA | 2.0 | 1.0 | 1000 | $725 | $0.72 | 46d | 1 | 1.24mi |
| 1147 Cornwell Ave Unit 1 Shreveport, LA | 3.0 | 2.0 | 1200 | $895 | $0.75 | 15d | 1 | 1.26mi |
| 819 Boulevard St Shreveport, LA | 2.0 | 1.0 | 900 | $800 | $0.89 | 23d | 1 | 1.28mi |
Listing history 34 events
-
2026-06-21days on market $100,000 Active 91 DOM
-
2026-06-18days on market $100,000 Active 88 DOM
-
2026-06-17days on market $100,000 Active 87 DOM
-
2026-06-16days on market $100,000 Active 86 DOM
-
2026-06-15days on market $100,000 Active 85 DOM
-
2026-06-14days on market $100,000 Active 83 DOM
-
2026-06-13days on market $100,000 Active 82 DOM
-
2026-06-10days on market $100,000 Active 80 DOM
-
2026-06-09days on market $100,000 Active 79 DOM
-
2026-06-08days on market $100,000 Active 78 DOM
-
2026-06-07days on market $100,000 Active 77 DOM
-
2026-06-05days on market $100,000 Active 74 DOM
-
2026-06-03days on market $100,000 Active 73 DOM
-
2026-06-02days on market $100,000 Active 72 DOM
-
2026-06-01days on market $100,000 Active 71 DOM
-
2026-05-31days on market $100,000 Active 70 DOM
-
2026-05-30days on market $100,000 Active 69 DOM
-
2026-04-18status Active 593-char remark
Show marketing remark (593 chars)
IDEAL HOME FOR INVESTORS THAT YOU CAN ADD TO YOUR PORTFOLIO***ALSO THIS HOUSE QUALIFIES FOR FIRST TIME HOMEBUYER ASSISTANCE***POSSIBLE SHORT SALE OPPORTUNITY***NEWLY REMODELED 1957, 2 BEDROOMS AND 1 BATH WITH 1,296 SQ. FT. THIS HOME IS LOCATED IN THE EAST GLADSTONE SUBDIVISION***OPEN SPACIOUS LIVING ROOM AND MASTER BEDROOM WITH A VANITY AREA***IN THE ENTRY THERE IS AN ENCLOSED SITTING AREA***DINING ROOM FEATURES BUILTIN CHINA HUTCH***IN THE BACKYARD THERE IS A LARGE DECK ATTACHED TO THE BACK OF THE HOUSE AND A PRIVATE WOOD FENCE SURROUNDS THE PERIMETER OF THE PROPERTY***NO FLOOD ZONE***
-
2026-04-14historical Active Contingent 593-char remark
Show marketing remark (593 chars)
IDEAL HOME FOR INVESTORS THAT YOU CAN ADD TO YOUR PORTFOLIO***ALSO THIS HOUSE QUALIFIES FOR FIRST TIME HOMEBUYER ASSISTANCE***POSSIBLE SHORT SALE OPPORTUNITY***NEWLY REMODELED 1957, 2 BEDROOMS AND 1 BATH WITH 1,296 SQ. FT. THIS HOME IS LOCATED IN THE EAST GLADSTONE SUBDIVISION***OPEN SPACIOUS LIVING ROOM AND MASTER BEDROOM WITH A VANITY AREA***IN THE ENTRY THERE IS AN ENCLOSED SITTING AREA***DINING ROOM FEATURES BUILTIN CHINA HUTCH***IN THE BACKYARD THERE IS A LARGE DECK ATTACHED TO THE BACK OF THE HOUSE AND A PRIVATE WOOD FENCE SURROUNDS THE PERIMETER OF THE PROPERTY***NO FLOOD ZONE***
-
2026-03-25status Pending 593-char remark
Show marketing remark (593 chars)
IDEAL HOME FOR INVESTORS THAT YOU CAN ADD TO YOUR PORTFOLIO***ALSO THIS HOUSE QUALIFIES FOR FIRST TIME HOMEBUYER ASSISTANCE***POSSIBLE SHORT SALE OPPORTUNITY***NEWLY REMODELED 1957, 2 BEDROOMS AND 1 BATH WITH 1,296 SQ. FT. THIS HOME IS LOCATED IN THE EAST GLADSTONE SUBDIVISION***OPEN SPACIOUS LIVING ROOM AND MASTER BEDROOM WITH A VANITY AREA***IN THE ENTRY THERE IS AN ENCLOSED SITTING AREA***DINING ROOM FEATURES BUILTIN CHINA HUTCH***IN THE BACKYARD THERE IS A LARGE DECK ATTACHED TO THE BACK OF THE HOUSE AND A PRIVATE WOOD FENCE SURROUNDS THE PERIMETER OF THE PROPERTY***NO FLOOD ZONE***
-
2026-03-02$100,000 Active 593-char remark
Show marketing remark (593 chars)
IDEAL HOME FOR INVESTORS THAT YOU CAN ADD TO YOUR PORTFOLIO***ALSO THIS HOUSE QUALIFIES FOR FIRST TIME HOMEBUYER ASSISTANCE***POSSIBLE SHORT SALE OPPORTUNITY***NEWLY REMODELED 1957, 2 BEDROOMS AND 1 BATH WITH 1,296 SQ. FT. THIS HOME IS LOCATED IN THE EAST GLADSTONE SUBDIVISION***OPEN SPACIOUS LIVING ROOM AND MASTER BEDROOM WITH A VANITY AREA***IN THE ENTRY THERE IS AN ENCLOSED SITTING AREA***DINING ROOM FEATURES BUILTIN CHINA HUTCH***IN THE BACKYARD THERE IS A LARGE DECK ATTACHED TO THE BACK OF THE HOUSE AND A PRIVATE WOOD FENCE SURROUNDS THE PERIMETER OF THE PROPERTY***NO FLOOD ZONE***
-
2026-02-26historical
-
2026-01-15$100,000 Active
-
2025-12-18historical
-
2025-09-23price $100,000
-
2025-08-22price $118,900
-
2025-08-04price $123,000
-
2025-07-07price $131,000
-
2025-06-18$138,000 Active
-
2024-06-21soldstatus Closed
-
2024-06-17status Pending
-
2024-05-17historical Active Contingent
-
2024-03-28$127,000 Active
-
1999-09-27soldstatus
ⓘ Source: listings_history table (triggers on properties + properties_extension) + one-shot
backfill from property_details.listing_events for pre-trigger history.
Tax reassessment forecast LA · Resets to sale price
- Current annual tax
- $974 · $81/mo
- Projected year-2 tax
- $974 · $81/mo
- Expected delta
- $0/yr ($0/mo · 0.0%)
ⓘ Screening estimate from a state-policy table — verify with the county assessor before closing.
Climate risk First Street
- Flood 1/10 Low FEMA zone X (unshaded) · 0% chance over 30 yrs
- Wildfire 1/10 Low
- Heat 7/10 Severe 7 d/yr ≥110°F today · 22 d/yr by 30 yrs out
- Wind 6/10 Major 66% chance of damaging wind over 30 yrs
- Air quality 2/10 Low 1 unhealthy d/yr today · 2 by 30 yrs out
Nearby sold comps map
Loading sold comps map…
Walkable amenities ~0.75 mi
Loading nearby amenities…
Taxation est. · year 1
- Rental income
- $13,941
- − Mortgage interest
- −$5,602
- − Property taxes
- −$974
- − Insurance
- −$500
- − Repairs & maintenance
- −$1,115
- − Management
- −$1,115
- − Depreciation
- −$2,909
- Taxable income
- $1,726
- Est. tax owed @ 24.0%
- −$414
- After-tax cash flow
- $2,833/yr
For passive investors: Depreciation is non-cash, so a rental often shows a tax loss while cash-flowing — sheltering income. Rental losses are passive: they offset passive income freely, and up to $25,000/yr can offset ordinary (W-2) income if you actively participate and your MAGI is under $100k (phasing out to $0 by $150k); unused losses carry forward. On sale, claimed depreciation is recaptured at up to 25%, and gains may owe capital-gains tax (a 1031 exchange can defer both). Figures are a year-1 estimate at your 24.0% rate — not tax advice; consult a CPA.
Schools (NCES district)
- District
- Caddo Parish
- NCES district ID
- 2200300
- Math proficiency
- 21% ▼ -33.00%
- Reading proficiency
- 32% ▼ -30.00%
- Median HH income
- $39,227
- Composite
- 22.23/100
- National rank
- #8148
- State rank
- #53 of 98 in LA
Livability — Shreveport
- Score
- 59/100
- State rank
- #270
- US rank
- #19730
Category grades
Schools grade is shown separately in the Schools card above.
Census & demographics
- Census place
- Shreveport, LA
- County
- Caddo Parish · 178,536 people
- City population
- 164,123
- Metro
- Shreveport-Bossier City, LA
- Population (ZIP)
- 12,975
- Household income
- $56,833
- Rent vs Own
- Severe rent burden
- 759.0
Population outlook (Caddo County) Hauer SSP2
- Today (2025)
- 243,190 people
- By 2030
- 237,231 · -2.5%
- By 2040
- 222,502 · -8.5%
- By 2050
- 206,516 · -15.1%
- By 2075
- 165,706 · -31.9%
- By 2100
- 122,262 · -49.7%
Race, ethnicity, and origin ACS 2023
- Neighborhood character
- Diverse neighborhood (Simpson 0.63)
- Race & ethnicity
- White 53% Black 28% Two or more races 10% Hispanic / Latino 10% Asian 3%
- Hispanic origin (detail)
- Mexican 7%
- Common ancestry
- Slovak 6% Lithuanian 4% Scottish 2%
- Foreign-born
- 5% · Canada, Vietnam
- Languages at home
- 90% English-only · Spanish 5% French/Haitian/Cajun 1% Tagalog/Filipino 1%
Political lean MEDSL · Caddo
- 2024 margin
- Toss-up / Even · D 51.6% · R 47.0% · Other 1.4%
- 2008→2024 swing
- +1.6pp toward D · 2008: 3.0pp · 2024: 4.6pp
- All cycles
- 2024: D+4.6 2020: D+6.8 2016: D+4.2 2012: D+4.9 2008: D+3.0
Not yet ingested
- Civics
- —
Market trends
- HPI YoY
- ▼ -49.61%
- Current HPI
- 104.3781
- Rent YoY
- ▲ 3.56%
- Metro
- Shreveport-Bossier City, LA
- State GDP YoY
- ▲ 3.29%
- F500 in state
- 10
Industry mix (Fortune 500 HQ in LA)
| Industry | F500 HQs | Revenue |
|---|---|---|
| Telecommunications | 2 | $23B |
|
||
| Utilities | 1 | $12B |
|
||
| Wholesale / Distribution | 1 | $5B |
|
||
| Advertising | 1 | $2B |
|
||
Price history
-21.3% since first listed17 events — show timeline
- 2026-04-18 Relisted — NTREIS
- 2026-04-14 Contingent — NTREIS
- 2026-03-25 Pending — NTREIS
- 2026-03-02 Listed $100,000 NTREIS
- 2026-02-26 Listing Removed — NTREIS
- 2026-01-15 Listed $100,000 NTREIS
- 2025-12-18 Listing Removed — NTREIS
- 2025-09-23 Price Changed $100,000 NTREIS
- 2025-08-22 Price Changed $118,900 NTREIS
- 2025-08-04 Price Changed $123,000 NTREIS
- 2025-07-07 Price Changed $131,000 NTREIS
- 2025-06-18 Listed $138,000 NTREIS
- 2024-06-21 Sold (MLS) — NTREIS
- 2024-06-17 Pending — NTREIS
- 2024-05-17 Contingent — NTREIS
- 2024-03-28 Listed $127,000 NTREIS
- 1999-09-27 Sold (Public Records) — Public Records
Property tax history
+14.8%/yrLatest (2025): $974 · +0.4% YoY. Source: county tax records.
Cash-flow waterfall
monthlySold comps — $/sqft
last 12 mo · ≤1 miLoading sold comps…