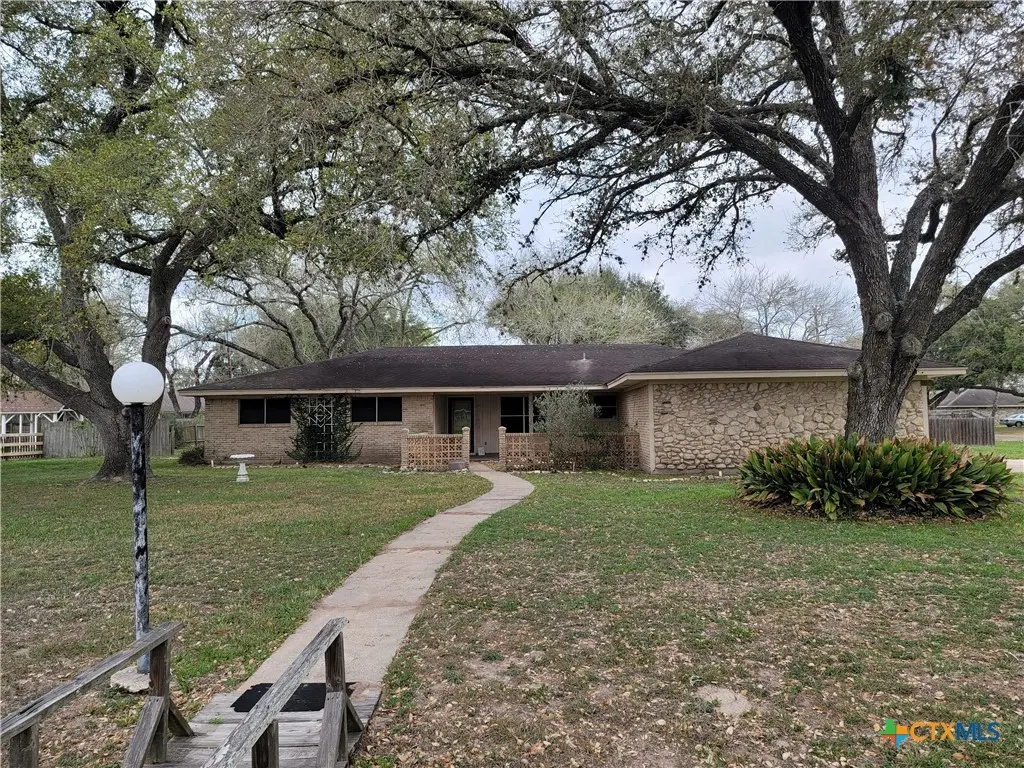
1006 Blyth Rd · Victoria, TX
Flood risk 1/10 · Minimal
- FEMA flood zone
- X
- Chance of flooding over 30 yrs
- 0.0%
- Est. flood insurance / yr
- $507 – $1,088
Fire risk 6/10 · Moderate
- Est. fire insurance / yr
- $1,222 – $2,270
Heat risk 9/10 · Severe
- Hot days now (above 110°F)
- 7 days/yr
- Hot days in 30 yrs
- 21 days/yr
Wind risk 9/10 · Severe
- Chance of severe wind over 30 yrs
- 99.0%
Air-quality risk 1/10 · Minimal
- Unhealthy air days now
- 0 days/yr
- Unhealthy air days in 30 yrs
- 0 days/yr
Risk factors via First Street. Map © Google.
Why this score? — see what drove the D grade
The composite is a weighted blend of 9 inputs, each scored 0–100. Each bar is that input's sub-score; the figure is the points it added to the 100-point composite (weight × sub-score).
- ARV discount +15.0/15.0
- Cash flow +10.2/30.0
- 1% rule +4.0/10.0
- Livability +3.6/5.0
- DSCR +2.9/10.0
- Rent growth +2.5/5.0
- Schools +2.5/10.0
- Condition / age +2.5/5.0
- Appreciation +0.0/10.0
$185,000
🖨 Deal sheet (PDF) 📄 Offer letter ✓ Due diligence
Listing remarks MLS
Great opportunity to renovate a house and turn it into your dream home. Located on a big corner lot, this 3+2 is filled with potential. The family room Is open to the kitchen and features a lovely wood burning fireplace. The living & dining rooms are partially separated but could be completely opened to create a large, open living space. Two car attached garage. Take a look today! Seller may consider owner financing.
Key facts
- Big corner lot
- Open living space
- 0.56 acre lot
Tags
Neighborhood map
What this means for you Summary
Snapshot
- This is a 3-bed/2.0-bath single-family listed at $185k.
Deal economics
- At list price, monthly cash flow is $-106 ($-1k/yr) — negative.
- To cash-flow at today's rent, offer at most $166k (10.1% below list).
- To meet the 1% rule (rent ≥ 1% of price), the offer needs to be $166k (10.4% below list).
- Recommended offer: $166k (10.4% below list) — sets the bar for 1% rule.
- Cap rate 5.6% vs local median 3.7% in Victoria — top-decile yield for the area; either an underpriced asset or a hidden risk that comps aren't pricing in. Stress-test before assuming the spread holds.
Location & tenants
- Location reads 71/100 on livability (#309 in TX) — a middle-class / working-renter tenant base. Strengths: cost of living A+, housing A+, health & safety A+; Watch: crime D+, amenities F, commute F.
- Victoria ISD (urban): math 24% / reading 33% proficiency, ranked #645 of 826 in TX (top 78%) — low school quality limits family demand, transient renter base, plan for 1-2y turnover.
- Zoned schools: Vickers El (math 54% / reading 58%, grade C+, #574 of 4,322 statewide, top 14%, 505 students, 50% FRL); Harold Cade Middle (math 39% / reading 45%, grade D-, #572 of 1,662 statewide, top 36%, 740 students, 47% FRL); Victoria West H S (math 18% / reading 39%, grade F, #1,157 of 1,632 statewide, top 72%, 1,766 students, 59% FRL).
- Zoned-school proficiency averages 42% at this address vs 28% district-wide (+14 pts) — the actual schools serving this property are materially stronger than the Victoria ISD average implies; a family-tenant draw the district grade alone would hide.
- Market conditions: 227 active listings in the ZIP; solid renter incomes; 43 units permitted in Victoria County in 2024 (0 in 5+ unit buildings).
Forward outlook
- Local home prices are declining (-3.0%/yr); year-one equity from $1k of loan paydown is wiped out by about $6k of value loss. Plan a longer hold.
- Victoria County population projected at +34% by 2050 — long-run rental-demand tailwind backs the buy-and-hold thesis.
Negotiation context
- It's been on market 104 days — a 9% lower offer ($168k) is reasonable based on typical stale-listing flexibility.
- 4 sale attempts since 8y ago with the ask held roughly flat each time — persistent listings suggest the price (not the market) is what's stuck; bring a comps-based counter.
Risks & watch-outs
- Climate carrying-cost: severe wind risk, 99% chance of damaging wind over 30y; major wildfire risk; extreme-heat days projected 7→21/yr by 2055 (HVAC capex compounding) — expect insurance premiums to compound above CPI over the hold.
Questions for the listing agent
- What do current leases actually rent for vs. the listed asking? Can we see a recent rent roll and the last 12 months of T-12 income?
- It's been on market 104 days. Have you received any prior offers? Is the seller open to a 10% concession, seller financing, or rate buy-down credit?
- Built in 1967 — when were the roof, HVAC, electrical panel, plumbing, and water heater last replaced?
- Why hasn't it sold? Are there any deal-killer items the seller is aware of (foundation, flood, title, zoning, code violations)?
- Is there a deadline driving the sale (1031 exchange, divorce, estate, relocation)? That informs how much negotiation room exists.
- Schools are D-rated, which usually means shorter tenancies and higher turnover. Who's the typical renter profile here, and what's been the actual vacancy rate?
- Crime grade is D in this area — have there been break-ins, vandalism, or insurance claims at this property in the last 3 years? What carrier currently insures it and at what premium?
- The area grade is low — what's the realistic commute time and amenity access for the typical tenant pool here? Any planned neighborhood developments (good or bad) we should know about?
- What's the average days-on-market for RENTAL listings here right now (not sales)? A rising rental-DOM trend means longer vacancies and softer asking-rent achievability than the comps imply.
- What's the recent tenant-quality profile in this submarket — average credit score on applications, eviction rate, late-payment / NSF rate, and stable-employment percentage? A property-management company in the area should have these aggregated.
- How much new for-sale + rental construction is in the pipeline within 1–3 miles? Heavy new supply typically softens prices + rents 12–24 months out; constrained supply supports both.
Investment metrics
- 1% rule
- 0.90% ✗
- Cap rate
- 5.61%
- Cash-on-cash
- -2.45%
- DSCR
- 0.89
- GRM
- 9.3
CMA / ARV
- ARV (median comp)
- $289,776
- List price
- $185,000
- Delta
- -36.16%
- Verdict
- UNDERPRICED
- Comps
- 20 within 1.0 mi
Show comp detail 12 sales within ~0.75 mi
| Address | Dist | Beds/Ba | Sqft | Sold | Price | $/sf | Match |
|---|---|---|---|---|---|---|---|
| 102 Luke Ct | 0.16mi | 3/2.5 | 2,008 (+2%) | 1mo | $353,000 | $176 | 86 |
| 609 Mason Cir | 0.29mi | 3/2.0 | 1,766 (-10%) | 1mo | $317,900 | $180 | 69 |
| 111 Belmoor Ln | 0.48mi | 3/2.5 | 1,893 (-4%) | 3mo | $347,500 | $184 | 67 |
| 109 Raindance Ct | 0.64mi | 4/2.0 (+1) | 1,982 (+1%) | 1mo | $394,900 | $199 | 63 |
| 608 Berwick St | 0.53mi | 3/2.0 | 2,112 (+7%) | 2mo | $268,900 | $127 | 61 |
| 204 Windwood Ln | 0.34mi | 3/2.0 | 1,701 (-14%) | 2mo | $289,900 | $170 | 60 |
| 301 Cobblestone Ct | 0.53mi | 4/2.0 (+1) | 1,879 (-4%) | 3mo | $377,900 | $201 | 60 |
| 604 Mason Cir | 0.32mi | 3/2.0 | 1,684 (-14%) | 1mo | $314,900 | $187 | 60 |
| 102 Persimmon Ct | 0.59mi | 4/2.0 (+1) | 2,025 (+3%) | 3mo | $399,900 | $197 | 60 |
| 502 Berwick St | 0.75mi | 3/2.0 | 2,013 (+2%) | 2mo | $319,885 | $159 | 60 |
| 306 Tuscany Dr | 0.67mi | 4/2.0 (+1) | 1,871 (-5%) | 1mo | $333,000 | $178 | 55 |
| 114 Raindance Ct | 0.68mi | 4/2.0 (+1) | 2,138 (+9%) | 2mo | $444,900 | $208 | 47 |
Match score weights: distance 35% · size 25% · config 20% · recency 20%. Top-matched comps best support the ARV.
Projected returns pro-forma
-3.0% appreciation · 3.0% rent growth · sell at horizon
- IRR
- -20.3%
- Equity multiple
- 0.29×
- Total profit
- $-36,601
- Equity at exit
- $27,584
- IRR
- -13.2%
- Equity multiple
- 0.23×
- Total profit
- $-40,099
- Equity at exit
- $15,995
Cash invested: $51,800 (down + closing). Projections, not guarantees.
Landlord ↔ Tenant lean methodology
- Overall (STATE)
- 87 Strongly Landlord-Friendly
- State Texas
- 87 Strongly Landlord-Friendly · R+5
- County
- — inherits STATE
- City
- — inherits STATE
ZIP-level market 77904
- Home prices YoY
- -34.7%
- Active inventory
- 227
- Price-to-rent
- 9.3×
Monthly cashflow live
- Estimated rent
- $1,657 medium interval (Pro) →
- Mortgage (P&I)
- −$970
- Tax from tax record
- −$368 /mo · $4,411/yr
- Insurance
- −$77
- HOA
- −$0
- Vacancy / Maint / Mgmt
- −$348
- Net cashflow
- $-106
Break-even live
Sensitivity live
| Price | -10% $-1 | -5% $-53 | +0% $-106 | +5% $-158 | +10% $-210 |
|---|---|---|---|---|---|
| Rent | -10% $-237 | -5% $-171 | +0% $-106 | +5% $-40 | +10% $25 |
| Rate | -1.0pp $-13 | -0.5pp $-59 | base $-106 | +0.5pp $-154 | +1.0pp $-202 |
UW: 25.0% down · 7.5% · 30yr · 1.5% tax · 5.0% vac · 8.0% maint · 8.0% mgmt
Financing live
Cash to close
- Down payment
- $46,250
- Closing costs
- $5,550
- Reserves months
- —
- Total cash needed
- —
Loan-product check · same deal, 3 products live
Conventional
25% down · 7.5% · 30yr
- Down + closing
- —
- Monthly P&I
- —
- Monthly cashflow
- —
- DSCR
- —
- Eligible?
- —
Personal DTI + credit; lowest rate.
DSCR
20% down · 8.5% · 30yr
- Down + closing
- —
- Monthly P&I
- —
- Monthly cashflow
- —
- DSCR
- —
- Eligible?
- —
No personal income docs; deal must DSCR.
Hard money
10% down · 12.0% · 12mo
- Down + closing
- —
- Monthly P&I
- —
- Monthly cashflow
- —
- DSCR
- —
- Eligible?
- —
Short-term bridge; refi at stabilization.
Listing history 22 events
-
2026-06-10days on market $185,000 Active 104 DOM
-
2026-06-09days on market $185,000 Active 103 DOM
-
2026-06-08days on market $185,000 Active 102 DOM
-
2026-06-07days on market $185,000 Active 101 DOM
-
2026-06-03days on market $185,000 Active 97 DOM
-
2026-06-02days on market $185,000 Active 96 DOM
-
2026-06-01days on market $185,000 Active 95 DOM
-
2026-05-31days on market $185,000 Active 94 DOM
-
2026-05-30days on market $185,000 Active 93 DOM
-
2026-04-09status Active 426-char remark
Show marketing remark (426 chars)
Great opportunity to renovate a house and turn it into your dream home. Located on a big corner lot, this 3+2 is filled with potential. The family room Is open to the kitchen and features a lovely wood burning fireplace. The living & dining rooms are partially separated but could be completely opened to create a large, open living space. Two car attached garage. Take a look today! Seller may consider owner financing.
-
2026-04-06historical Active Under Contract 426-char remark
Show marketing remark (426 chars)
Great opportunity to renovate a house and turn it into your dream home. Located on a big corner lot, this 3+2 is filled with potential. The family room Is open to the kitchen and features a lovely wood burning fireplace. The living & dining rooms are partially separated but could be completely opened to create a large, open living space. Two car attached garage. Take a look today! Seller may consider owner financing.
-
2026-02-26$185,000 Active 426-char remark
Show marketing remark (426 chars)
Great opportunity to renovate a house and turn it into your dream home. Located on a big corner lot, this 3+2 is filled with potential. The family room Is open to the kitchen and features a lovely wood burning fireplace. The living & dining rooms are partially separated but could be completely opened to create a large, open living space. Two car attached garage. Take a look today! Seller may consider owner financing.
-
2021-06-04soldstatus
-
2018-09-06historical
-
2018-09-03price $199,000
-
2018-08-17price $207,900
-
2018-08-17status Active
-
2018-08-04historical
-
2018-07-24price $211,900
-
2018-07-09price $215,900
-
2018-06-22$219,900 Active
-
2017-11-06soldstatus
ⓘ Source: listings_history table (triggers on properties + properties_extension) + one-shot
backfill from property_details.listing_events for pre-trigger history.
Tax reassessment forecast TX · Resets to sale price
- Current annual tax
- $4,411 · $368/mo
- Projected year-2 tax
- $4,411 · $368/mo
- Expected delta
- $0/yr ($0/mo · 0.0%)
ⓘ Screening estimate from a state-policy table — verify with the county assessor before closing.
Climate risk First Street
- Flood 1/10 Low FEMA zone X · 0% chance over 30 yrs
- Wildfire 6/10 Major
- Heat 9/10 Extreme 7 d/yr ≥110°F today · 21 d/yr by 30 yrs out
- Wind 9/10 Extreme 99% chance of damaging wind over 30 yrs
- Air quality 1/10 Low 0 unhealthy d/yr today · 0 by 30 yrs out
Nearby sold comps map
Loading sold comps map…
Walkable amenities ~0.75 mi
Loading nearby amenities…
Taxation est. · year 1
- Rental income
- $19,885
- − Mortgage interest
- −$10,363
- − Property taxes
- −$4,411
- − Insurance
- −$925
- − Repairs & maintenance
- −$1,591
- − Management
- −$1,591
- − Depreciation
- −$5,382
- Taxable loss
- −$4,377
- Est. tax savings @ 24.0%
- +$1,050
- After-tax cash flow
- $-218/yr
For passive investors: Depreciation is non-cash, so a rental often shows a tax loss while cash-flowing — sheltering income. Rental losses are passive: they offset passive income freely, and up to $25,000/yr can offset ordinary (W-2) income if you actively participate and your MAGI is under $100k (phasing out to $0 by $150k); unused losses carry forward. On sale, claimed depreciation is recaptured at up to 25%, and gains may owe capital-gains tax (a 1031 exchange can defer both). Figures are a year-1 estimate at your 24.0% rate — not tax advice; consult a CPA.
Schools (NCES district)
- District
- Victoria ISD
- NCES district ID
- 4844150
- Math proficiency
- 24% ▼ -12.00%
- Reading proficiency
- 33% ▼ -2.00%
- Median HH income
- $50,534
- Composite
- 24.98/100
- National rank
- #7562
- State rank
- #645 of 826 in TX
Livability — Victoria
- Score
- 71/100
- State rank
- #309
- US rank
- #6960
Category grades
Schools grade is shown separately in the Schools card above.
Census & demographics
- Census place
- Victoria, TX
- County
- Victoria County · 69,915 people
- City population
- 69,915
- Metro
- Victoria, TX
- Population (ZIP)
- 30,061
- Household income
- $83,130
- Rent vs Own
- Severe rent burden
- 1133.0
Population outlook (Victoria County) Hauer SSP2
- Today (2025)
- 106,119 people
- By 2030
- 113,161 · +6.6%
- By 2040
- 127,402 · +20.1%
- By 2050
- 141,953 · +33.8%
- By 2075
- 179,410 · +69.1%
- By 2100
- 200,127 · +88.6%
Race, ethnicity, and origin ACS 2023
- Neighborhood character
- Diverse neighborhood (Simpson 0.56)
- Race & ethnicity
- White 56% Hispanic / Latino 35% Two or more races 20% Black 4% Asian 2%
- Hispanic origin (detail)
- Mexican 29%
- Common ancestry
- Lithuanian 2% Romanian 2% Serbian 1%
- Foreign-born
- 5% · Canada, Vietnam
- Languages at home
- 86% English-only · Spanish 12% Other Indo-European 1%
Political lean MEDSL · Victoria
- 2024 margin
- Solid R (+42.6) · D 28.4% · R 71.0%
- 2008→2024 swing
- -9.0pp toward R · 2008: -33.6pp · 2024: -42.6pp
- All cycles
- 2024: R+42.6 2020: R+38.0 2016: R+40.0 2012: R+37.8 2008: R+33.6
Not yet ingested
- Civics
- —
Market trends
- HPI YoY
- ▼ -75.51%
- Current HPI
- 142.2501
- Rent YoY
- —
- Metro
- Victoria, TX
- State GDP YoY
- ▲ 3.95%
- F500 in state
- 110
Industry mix (Fortune 500 HQ in TX)
| Industry | F500 HQs | Revenue |
|---|---|---|
| Energy | 16 | $1,198B |
|
||
| Technology | 5 | $198B |
|
||
| Engineering / Construction | 4 | $72B |
|
||
| Energy Services | 3 | $60B |
|
||
| Utilities | 3 | $41B |
|
||
| Healthcare | 2 | $330B |
|
||
Price history
-15.9% since first listed13 events — show timeline
- 2026-04-09 Relisted — CTXMLS
- 2026-04-06 Contingent — CTXMLS
- 2026-02-26 Listed $185,000 CTXMLS
- 2021-06-04 Sold (Public Records) — Public Records
- 2018-09-06 Listing Removed — CTXMLS
- 2018-09-03 Price Changed $199,000 CTXMLS
- 2018-08-17 Price Changed $207,900 CTXMLS
- 2018-08-17 Relisted — CTXMLS
- 2018-08-04 Listing Removed — CTXMLS
- 2018-07-24 Price Changed $211,900 CTXMLS
- 2018-07-09 Price Changed $215,900 CTXMLS
- 2018-06-22 Listed $219,900 CTXMLS
- 2017-11-06 Sold (Public Records) — Public Records
Property tax history
-0.1%/yrLatest (2025): $4,411 · +1.6% YoY. Source: county tax records.
Cash-flow waterfall
monthlySold comps — $/sqft
last 12 mo · ≤1 miLoading sold comps…