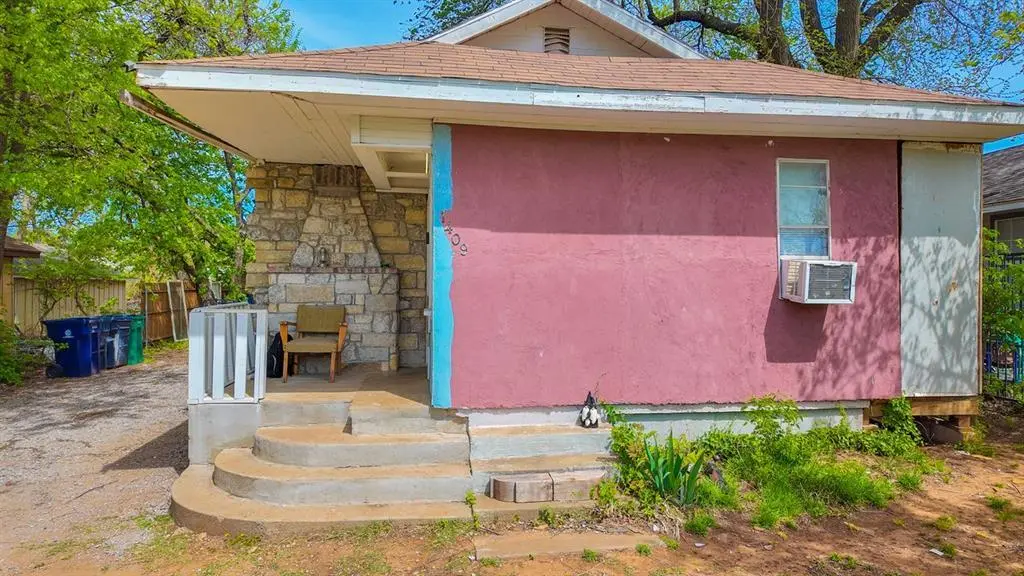
1409 SW 32nd St · Oklahoma City, OK
Flood risk 1/10 · Minimal
- FEMA flood zone
- X (unshaded)
- Chance of flooding over 30 yrs
- 0.0%
- Est. flood insurance / yr
- $507 – $1,088
Fire risk 1/10 · Minimal
- Est. fire insurance / yr
- $2,463 – $4,575
Heat risk 6/10 · Moderate
- Hot days now (above 107°F)
- 7 days/yr
- Hot days in 30 yrs
- 18 days/yr
Wind risk 2/10 · Minimal
- Chance of severe wind over 30 yrs
- 4.0%
Air-quality risk 1/10 · Minimal
- Unhealthy air days now
- 0 days/yr
- Unhealthy air days in 30 yrs
- 0 days/yr
Risk factors via First Street. Map © Google.
Why this score? — see what drove the D+ grade
The composite is a weighted blend of 9 inputs, each scored 0–100. Each bar is that input's sub-score; the figure is the points it added to the 100-point composite (weight × sub-score).
- Cash flow +16.1/30.0
- ARV discount +15.0/15.0
- DSCR +5.0/10.0
- Livability +4.0/5.0
- 1% rule +3.5/10.0
- Rent growth +2.8/5.0
- Condition / age +2.5/5.0
- Schools +0.7/10.0
- Appreciation +0.0/10.0
$119,000
🖨 Deal sheet 📄 Offer letter ✓ Due diligence
Listing remarks MLS
Located at 1409 SW 32nd St in Oklahoma City, this inviting home blends classic character with practical living. Offering 4bedrooms and 2 bathroom within approximately 960 square feet, the property features a functional layout that maximizes space and comfort. Originally built in 1928, the home retains its timeless appeal while presenting an excellent opportunity for updates or customization. Situated on a generous lot, the expansive yard provides plenty of room for outdoor enjoyment, gardening, or future improvements. Nestled in an established neighborhood with convenient access to schools, shopping, and major thoroughfares, this property is ideal for first-time buyers.
Key facts
- Expansive yard
- Convenient access
- Functional layout
Tags
Neighborhood map
What this means for you Summary
Snapshot
- This is a 2-bed/1.0-bath single-family listed at $119k.
Deal economics
- At list price, monthly cash flow is $61 ($732/yr) — positive.
- The deal already cash-flows at list — no discount required.
- To meet the 1% rule (rent ≥ 1% of price), the offer needs to be $101k (15.5% below list).
- Recommended offer: $101k (15.5% below list) — sets the bar for 1% rule.
- Cap rate 6.9% vs local median 3.7% in Oklahoma City — top-decile yield for the area; either an underpriced asset or a hidden risk that comps aren't pricing in. Stress-test before assuming the spread holds.
Location & tenants
- Location reads 80/100 on livability (#3 in OK, #1,635 nationally) — a professional / high-income tenant draw. Strengths: amenities A+, commute A+, cost of living A+; Watch: schools F, crime F.
- Oklahoma City (urban): math 7% / reading 10% proficiency, ranked #254 of 270 in OK (top 94%) — low school quality limits family demand, transient renter base, plan for 1-2y turnover; 82% free/reduced lunch — lower-income household profile, screen leases tightly.
- Market conditions: Rents rising (+1.1%/yr); 93 active listings in the ZIP; 35 comparable units currently listed for rent nearby; rentals lingering (median 44d on market — plan ~5-8 weeks vacancy on turnover, expect pricing pressure); 54% of comp listings sitting > 30 days — soft ceiling on asking rent; 5,365 units permitted in Oklahoma County in 2024 (569 in 5+ unit buildings).
Forward outlook
- Local home prices are declining (-3.0%/yr); year-one equity from $823 of loan paydown is wiped out by about $4k of value loss. Plan a longer hold.
- Oklahoma County population projected at +41% by 2050 — long-run rental-demand tailwind backs the buy-and-hold thesis.
Negotiation context
- It's been on market 59 days — a 3% lower offer ($115k) is reasonable based on typical stale-listing flexibility.
Risks & watch-outs
- Watch-outs: built in 1928 — expect roof / HVAC / electrical / plumbing capex.
- Climate carrying-cost: extreme-heat days projected 7→18/yr by 2055 (HVAC capex compounding) — expect insurance premiums to compound above CPI over the hold.
Questions for the listing agent
- It's been on market 59 days. Have you received any prior offers? Is the seller open to a 15% concession, seller financing, or rate buy-down credit?
- Built in 1928 — when were the roof, HVAC, electrical panel, plumbing, and water heater last replaced?
- Is there a deadline driving the sale (1031 exchange, divorce, estate, relocation)? That informs how much negotiation room exists.
- Schools are F-rated, which usually means shorter tenancies and higher turnover. Who's the typical renter profile here, and what's been the actual vacancy rate?
- Crime grade is F in this area — have there been break-ins, vandalism, or insurance claims at this property in the last 3 years? What carrier currently insures it and at what premium?
- The area grade is low — what's the realistic commute time and amenity access for the typical tenant pool here? Any planned neighborhood developments (good or bad) we should know about?
- What's the average days-on-market for RENTAL listings here right now (not sales)? A rising rental-DOM trend means longer vacancies and softer asking-rent achievability than the comps imply.
- What's the recent tenant-quality profile in this submarket — average credit score on applications, eviction rate, late-payment / NSF rate, and stable-employment percentage? A property-management company in the area should have these aggregated.
- How much new for-sale + rental construction is in the pipeline within 1–3 miles? Heavy new supply typically softens prices + rents 12–24 months out; constrained supply supports both.
Investment metrics
- 1% rule
- 0.85% ✗
- Cap rate
- 6.91%
- Cash-on-cash
- 2.20%
- DSCR
- 1.10
- GRM
- 9.9
CMA / ARV
- ARV (median comp)
- $147,292
- List price
- $119,000
- Delta
- -19.21%
- Verdict
- UNDERPRICED
- Comps
- 20 within 1.0 mi
Show comp detail 12 sales within ~0.75 mi
| Address | Dist | Beds/Ba | Sqft | Sold | Price | $/sf | Match |
|---|---|---|---|---|---|---|---|
| 1333 SW 32nd St | 0.07mi | 2/1.0 | 888 (-8%) | 2mo | $80,000 | $90 | 83 |
| 1233 SW 34th St | 0.23mi | 2/1.0 | 918 (-4%) | 9mo | $120,000 | $131 | 74 |
| 1428 Reding Dr | 0.48mi | 3/1.0 (+1) | 973 (+1%) | 4mo | $68,000 | $70 | 67 |
| 1648 SW 40th St | 0.59mi | 3/1.0 (+1) | 939 (-2%) | 4mo | $125,000 | $133 | 61 |
| 1521 SW 25th St | 0.56mi | 3/2.0 (+1) | 916 (-5%) | 1mo | $162,000 | $177 | 56 |
| 1440 SW 25th St | 0.51mi | 2/1.0 | 1,064 (+11%) | 9mo | $52,500 | $49 | 51 |
| 1116 SW 41st St | 0.71mi | 2/1.0 | 875 (-9%) | 2mo | $125,500 | $143 | 50 |
| 2325 SW Binkley St | 0.67mi | 3/1.0 (+1) | 1,000 (+4%) | 10mo | $156,000 | $156 | 49 |
| 1128 SW 38th St | 0.53mi | 3/2.0 (+1) | 1,076 (+12%) | 0mo | $138,000 | $128 | 46 |
| 1216 SW 39th St | 0.55mi | 3/2.0 (+1) | 1,064 (+11%) | 2mo | $87,550 | $82 | 46 |
| 3901 S Youngs Blvd | 0.70mi | 3/1.0 (+1) | 1,025 (+7%) | 6mo | $110,000 | $107 | 46 |
| 920 SW 26th St | 0.74mi | 2/1.0 | 824 (-14%) | 9mo | $85,000 | $103 | 34 |
Match score weights: distance 35% · size 25% · config 20% · recency 20%. Top-matched comps best support the ARV.
Projected returns pro-forma
-3.0% appreciation · 1.13% rent growth · sell at horizon
- IRR
- -14.8%
- Equity multiple
- 0.48×
- Total profit
- $-17,296
- Equity at exit
- $17,743
- IRR
- -9.2%
- Equity multiple
- 0.47×
- Total profit
- $-17,561
- Equity at exit
- $10,289
Cash invested: $33,320 (down + closing). Projections, not guarantees.
Landlord ↔ Tenant lean methodology
- Overall (STATE)
- 83 Strongly Landlord-Friendly
- State Oklahoma
- 83 Strongly Landlord-Friendly · R+20
- County
- — inherits STATE
- City
- — inherits STATE
ZIP-level market 73119
- Home prices YoY
- -14.4%
- Rents YoY
- 1.1%
- Active inventory
- 93
- Price-to-rent
- 9.9×
Monthly cashflow live
- Estimated rent
- $1,006 high interval (Pro) →
- Mortgage (P&I)
- −$624
- Tax from tax record
- −$60 /mo · $718/yr
- Insurance
- −$50
- HOA
- −$0
- Vacancy / Maint / Mgmt
- −$211
- Net cashflow
- $61
Break-even live
UW: 25.0% down · 7.5% · 30yr · 1.5% tax · 5.0% vac · 8.0% maint · 8.0% mgmt
Financing live
Cash to close
- Down payment
- $29,750
- Closing costs
- $3,570
- Reserves months
- —
- Total cash needed
- —
Loan-product check · same deal, 3 products live
Conventional
25% down · 7.5% · 30yr
- Down + closing
- —
- Monthly P&I
- —
- Monthly cashflow
- —
- DSCR
- —
- Eligible?
- —
Personal DTI + credit; lowest rate.
DSCR
20% down · 8.5% · 30yr
- Down + closing
- —
- Monthly P&I
- —
- Monthly cashflow
- —
- DSCR
- —
- Eligible?
- —
No personal income docs; deal must DSCR.
Hard money
10% down · 12.0% · 12mo
- Down + closing
- —
- Monthly P&I
- —
- Monthly cashflow
- —
- DSCR
- —
- Eligible?
- —
Short-term bridge; refi at stabilization.
Rent comps 35 comps
| Address | Beds | Baths | Sqft | Rent | $/sqft | DOM | Units | Dist |
|---|---|---|---|---|---|---|---|---|
| 1329 SW Grand Blvd Oklahoma City, OK | 2.0 | 1.0 | 858 | $1,050 | $1.22 | 43d | 1 | 0.27mi |
| 2140 SW 35th St Oklahoma City, OK | 3.0 | 2.0 | 976 | $1,300 | $1.33 | 43d | 1 | 0.49mi |
| 2119 SW 39th St Oklahoma City, OK | 1.0–2.0 | 1.0 | 675 | $909 | $1.35 | 43d | 1 | 0.58mi |
| 2125 SW 26th St Unit B Oklahoma City, OK | 1.0 | 1.0 | 800 | $700 | $0.88 | 23d | 1 | 0.61mi |
| 2128 SW 41st St Oklahoma City, OK | 2.0 | 1.0 | 860 | $820 | $0.95 | 2d | 1 | 0.72mi |
| 2336 SW Grand Blvd Oklahoma City, OK | 2.0 | 1.0 | 770 | $995 | $1.29 | 43d | 1 | 0.75mi |
| 4330 S Barnes Ave Oklahoma City, OK | 1.0–3.0 | 1.0–2.0 | 860 | $937 | $1.09 | 3d | 9 | 0.80mi |
| 1004 SW 45th St Oklahoma City, OK | 2.0 | 1.0 | 756 | $950 | $1.26 | 23d | 1 | 1.00mi |
| 1056 Hangar Dr Oklahoma City, OK | 2.0 | 1.5 | 844 | $2,400 | $2.84 | 43d | 1 | 1.00mi |
| 3407 S Lee Ave Oklahoma City, OK | 2.0 | 1.0 | 900 | $980 | $1.09 | 43d | 1 | 1.03mi |
| 3616 S Lee Ave Oklahoma City, OK | 1.0 | 1.0 | 760 | $775 | $1.02 | 43d | 1 | 1.07mi |
| 3618 S Lee Ave Oklahoma City, OK | 1.0 | 1.0 | 760 | $850 | $1.12 | 43d | 1 | 1.07mi |
| 934 Hangar Dr Unit 7 Oklahoma City, OK | 1.0 | 1.0 | 635 | $1,500 | $2.36 | 44d | 1 | 1.08mi |
| 934 Hangar Dr Unit 3 Oklahoma City, OK | 2.0 | 2.0 | 864 | $1,550 | $1.79 | 43d | 1 | 1.08mi |
| 934 Hangar Dr Unit 1 Oklahoma City, OK | 1.0 | 1.0 | 591 | $1,300 | $2.20 | 17d | 1 | 1.08mi |
| 2640 SW 38th St Oklahoma City, OK | 3.0 | 2.0 | 944 | $1,050 | $1.11 | 2d | 1 | 1.10mi |
| 900 Hangar Dr Oklahoma City, OK | 2.0 | 1.0–2.0 | 743 | $2,075 | $2.79 | 1d | 37 | 1.12mi |
| 1338 South Dr Oklahoma City, OK | 2.0 | 1.0 | 720 | $1,150 | $1.60 | 15d | 1 | 1.19mi |
| 540 SW 24th St #3 Oklahoma City, OK | 1.0 | 1.0 | 726 | $625 | $0.86 | 43d | 1 | 1.20mi |
| 632 SW 44th St Oklahoma City, OK | 2.0 | 1.0 | 958 | $1,000 | $1.04 | 3d | 1 | 1.24mi |
| 2412 SW 47th St Oklahoma City, OK | 3.0 | 1.0 | 638 | $1,150 | $1.80 | 23d | 1 | 1.25mi |
| 2813 SW 33rd St Oklahoma City, OK | 1.0 | 1.0 | 600 | $725 | $1.21 | 43d | 1 | 1.25mi |
| 404 SW 26th St Unit 6 Oklahoma City, OK | 1.0 | 1.0 | 600 | $645 | $1.07 | 11d | 1 | 1.30mi |
| 3906 S Hudson Ave Oklahoma City, OK | 1.0 | 1.0 | 700 | $750 | $1.07 | 23d | 1 | 1.31mi |
| 2116 SW 51st St Oklahoma City, OK | 1.0 | 1.0 | 558 | $675 | $1.21 | 43d | 1 | 1.32mi |
| 316 SW 27th St Unit 4 Oklahoma City, OK | 1.0 | 1.0 | 615 | $679 | $1.10 | 11d | 1 | 1.33mi |
| 316 SW 27th St Unit 8 Oklahoma City, OK | 1.0 | 1.0 | 615 | $679 | $1.10 | 43d | 1 | 1.33mi |
| 2500 SW 48th St Oklahoma City, OK | 2.0 | 1.0 | 1096 | $1,050 | $0.96 | 43d | 1 | 1.36mi |
| 3312 S Harvey Ave Oklahoma City, OK | 2.0 | 1.0 | 840 | $1,100 | $1.31 | 20d | 1 | 1.36mi |
| 1323 S Blackwelder Ave Oklahoma City, OK | 2.0 | 1.0 | 651 | $1,095 | $1.68 | 43d | 1 | 1.37mi |
| 3913 S Harvey Ave Unit 2 Oklahoma City, OK | 1.0 | 1.0 | 568 | $900 | $1.58 | 43d | 1 | 1.39mi |
| 220 SW 34th St Oklahoma City, OK | 1.0 | 1.0 | 625 | $725 | $1.16 | 43d | 1 | 1.41mi |
| 2921 SW 28th St Oklahoma City, OK | 3.0 | 1.0 | 1125 | $1,490 | $1.32 | 43d | 1 | 1.42mi |
| 1632 Birch St Oklahoma City, OK | 2.0 | 1.0 | 935 | $775 | $0.83 | 2d | 1 | 1.44mi |
| 1800 Exchange Ave Unit 1/2 Oklahoma City, OK | 1.0 | 2.0 | 550 | $725 | $1.32 | 23d | 1 | 1.48mi |
Listing history 15 events
-
2026-06-18days on market $119,000 Active 59 DOM
-
2026-06-17days on market $119,000 Active 58 DOM
-
2026-06-16days on market $119,000 Active 57 DOM
-
2026-06-15days on market $119,000 Active 56 DOM
-
2026-06-13days on market $119,000 Active 54 DOM
-
2026-06-09days on market $119,000 Active 50 DOM
-
2026-06-08days on market $119,000 Active 49 DOM
-
2026-06-07days on market $119,000 Active 48 DOM
-
2026-06-05days on market $119,000 Active 45 DOM
-
2026-06-03days on market $119,000 Active 44 DOM
-
2026-06-02days on market $119,000 Active 43 DOM
-
2026-06-01days on market $119,000 Active 42 DOM
-
2026-05-31days on market $119,000 Active 41 DOM
-
2026-05-08price $119,000 678-char remark
Show marketing remark (678 chars)
Located at 1409 SW 32nd St in Oklahoma City, this inviting home blends classic character with practical living. Offering 4bedrooms and 2 bathroom within approximately 960 square feet, the property features a functional layout that maximizes space and comfort. Originally built in 1928, the home retains its timeless appeal while presenting an excellent opportunity for updates or customization. Situated on a generous lot, the expansive yard provides plenty of room for outdoor enjoyment, gardening, or future improvements. Nestled in an established neighborhood with convenient access to schools, shopping, and major thoroughfares, this property is ideal for first-time buyers.
-
2026-04-06$120,000 Active 678-char remark
Show marketing remark (678 chars)
Located at 1409 SW 32nd St in Oklahoma City, this inviting home blends classic character with practical living. Offering 4bedrooms and 2 bathroom within approximately 960 square feet, the property features a functional layout that maximizes space and comfort. Originally built in 1928, the home retains its timeless appeal while presenting an excellent opportunity for updates or customization. Situated on a generous lot, the expansive yard provides plenty of room for outdoor enjoyment, gardening, or future improvements. Nestled in an established neighborhood with convenient access to schools, shopping, and major thoroughfares, this property is ideal for first-time buyers.
ⓘ Source: listings_history table (triggers on properties + properties_extension) + one-shot
backfill from property_details.listing_events for pre-trigger history.
Tax reassessment forecast OK · Resets to sale price
- Current annual tax
- $718 · $60/mo
- Projected year-2 tax
- $1,071 · $89/mo
- Expected delta
- +$353/yr (+$29/mo · 49.1%)
ⓘ Screening estimate from a state-policy table — verify with the county assessor before closing.
Climate risk First Street
- Flood 1/10 Low FEMA zone X (unshaded) · 0% chance over 30 yrs
- Wildfire 1/10 Low
- Heat 6/10 Major 7 d/yr ≥107°F today · 18 d/yr by 30 yrs out
- Wind 2/10 Low 4% chance of damaging wind over 30 yrs
- Air quality 1/10 Low 0 unhealthy d/yr today · 0 by 30 yrs out
Nearby sold comps map
Loading sold comps map…
Walkable amenities ~0.75 mi
Loading nearby amenities…
Taxation est. · year 1
- Rental income
- $12,068
- − Mortgage interest
- −$6,666
- − Property taxes
- −$718
- − Insurance
- −$595
- − Repairs & maintenance
- −$965
- − Management
- −$965
- − Depreciation
- −$3,462
- Taxable loss
- −$1,304
- Est. tax savings @ 24.0%
- +$313
- After-tax cash flow
- $1,045/yr
For passive investors: Depreciation is non-cash, so a rental often shows a tax loss while cash-flowing — sheltering income. Rental losses are passive: they offset passive income freely, and up to $25,000/yr can offset ordinary (W-2) income if you actively participate and your MAGI is under $100k (phasing out to $0 by $150k); unused losses carry forward. On sale, claimed depreciation is recaptured at up to 25%, and gains may owe capital-gains tax (a 1031 exchange can defer both). Figures are a year-1 estimate at your 24.0% rate — not tax advice; consult a CPA.
Schools (NCES district)
- District
- Oklahoma City
- NCES district ID
- 4022770
- Math proficiency
- 7% ▼ -5.00%
- Reading proficiency
- 10% ▼ -6.00%
- Median HH income
- $35,606
- Composite
- 7.0/100
- National rank
- #9970
- State rank
- #254 of 270 in OK
Livability — Oklahoma City
- Score
- 80/100
- State rank
- #3
- US rank
- #1635
Category grades
Schools grade is shown separately in the Schools card above.
Census & demographics
- Census place
- Oklahoma City, OK
- County
- Oklahoma County · 771,644 people
- City population
- 498,656
- Metro
- Oklahoma City, OK
- Population (ZIP)
- 30,398
- Household income
- $45,421
- Rent vs Own
- Severe rent burden
- 1221.0
Population outlook (Oklahoma County) Hauer SSP2
- Today (2025)
- 911,875 people
- By 2030
- 982,413 · +7.7%
- By 2040
- 1,130,468 · +24.0%
- By 2050
- 1,288,422 · +41.3%
- By 2075
- 1,711,482 · +87.7%
- By 2100
- 2,088,448 · +129.0%
Race, ethnicity, and origin ACS 2023
- Neighborhood character
- Majority Hispanic (63%)
- Race & ethnicity
- Hispanic / Latino 63% Two or more races 24% White 24% Native American 7% Black 6%
- Hispanic origin (detail)
- Mexican 58%
- Common ancestry
- Slovak 1% Lithuanian 1%
- Foreign-born
- 28% · Canada
- Languages at home
- 45% English-only · Spanish 54%
Political lean MEDSL · Oklahoma
- 2024 margin
- Toss-up / Even · D 48.0% · R 49.7% · Other 2.3%
- 2008→2024 swing
- +15.1pp toward D · 2008: -16.8pp · 2024: -1.7pp
- All cycles
- 2024: R+1.7 2020: R+1.1 2016: R+10.5 2012: R+16.7 2008: R+16.8
Not yet ingested
- Civics
- —
Market trends
- HPI YoY
- ▼ -50.15%
- Current HPI
- 297.1117
- Rent YoY
- ▲ 1.13%
- Metro
- Oklahoma City, OK
- State GDP YoY
- ▲ 1.55%
- F500 in state
- 6
Industry mix (Fortune 500 HQ in OK)
| Industry | F500 HQs | Revenue |
|---|---|---|
| Energy | 3 | $48B |
|
||
Price history
-0.8% since first listed2 events — show timeline
- 2026-05-08 Price Changed $119,000 MLSOK
- 2026-04-06 Listed $120,000 MLSOK
Property tax history
+3.5%/yrLatest (2025): $718 · +4.4% YoY. Source: county tax records.
Cash-flow waterfall
monthlySold comps — $/sqft
last 12 mo · ≤1 miLoading sold comps…