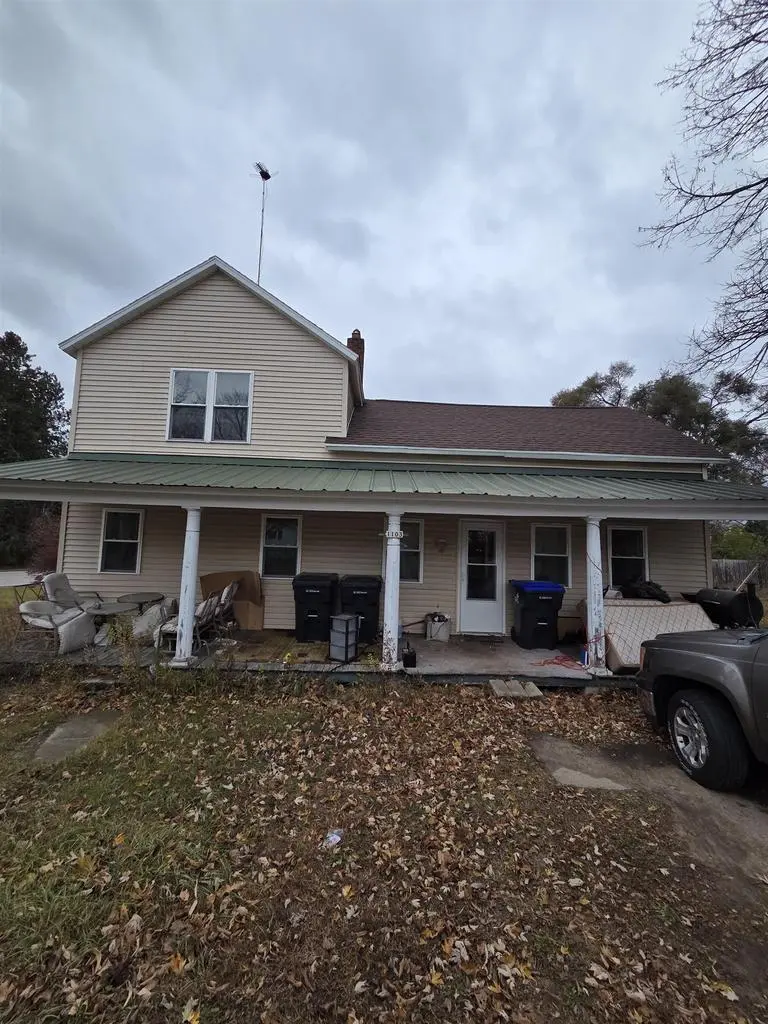
1103 Division St · Wausaukee, WI
Flood risk 1/10 · Minimal
- FEMA flood zone
- X
- Chance of flooding over 30 yrs
- 0.0%
- Est. flood insurance / yr
- $473 – $860
Fire risk 4/10 · Minor
- Est. fire insurance / yr
- $636 – $1,182
Heat risk 1/10 · Minimal
- Hot days now (above 94°F)
- 7 days/yr
- Hot days in 30 yrs
- 13 days/yr
Wind risk 1/10 · Minimal
- Chance of severe wind over 30 yrs
- —
Air-quality risk 1/10 · Minimal
- Unhealthy air days now
- 0 days/yr
- Unhealthy air days in 30 yrs
- 0 days/yr
Risk factors via First Street. Map © Google.
Why this score? — see what drove the A- grade
The composite is a weighted blend of 9 inputs, each scored 0–100. Each bar is that input's sub-score; the figure is the points it added to the 100-point composite (weight × sub-score).
- Cash flow +30.0/30.0
- ARV discount +15.0/15.0
- DSCR +10.0/10.0
- Appreciation +10.0/10.0
- 1% rule +8.4/10.0
- Livability +3.2/5.0
- Rent growth +2.5/5.0
- Condition / age +2.5/5.0
- Schools +2.4/10.0
$96,000
🖨 Deal sheet 📄 Offer letter ✓ Due diligence
Listing remarks MLS
Great corner lot wiith huge potential and a lot of space. In the Village of Wausaukee this diamond in the rough has 4 bedrooms, 1 bath, a formal dining room, den/office, and an extra bonus unfinished area in the attic. Unknown what year the home was built. The ceiling tiles in one of the upstairs bedrooms has been replaced with plywood.
Key facts
- Formal dining room
- Unfinished area
- Corner lot
Tags
Neighborhood map
What this means for you Summary
Snapshot
- This is a 4-bed/1.0-bath single-family listed at $96k.
Deal economics
- At list price, monthly cash flow is $358 ($4k/yr) — positive.
- The deal already cash-flows at list — no discount required.
- Meets the 1% rule at list price ($1k rent vs $96k).
- Recommended offer: $84k (12.0% below list) — sets the bar for market timing.
Location & tenants
- Location reads 64/100 on livability (#530 in WI) — a middle-class / working-renter tenant base. Strengths: cost of living A+, health & safety A+, housing B; Watch: crime D+, schools F, amenities F.
- Wausaukee School District (rural): math 30% / reading 20% proficiency, ranked #402 of 426 in WI (top 94%) — low school quality limits family demand, transient renter base, plan for 1-2y turnover.
- Market conditions: 49 active listings in the ZIP; 145 units permitted in Marinette County in 2024 (0 in 5+ unit buildings).
Forward outlook
- In year one you build about $10k of equity ($664 loan paydown + $10k appreciation (10.0% local appreciation)).
- Marinette County population projected at -26% by 2050 — secular population decline; favor cash flow + early exit over multi-decade hold.
- At projected returns (10.0% appreciation + 3.0% rent growth), your $27k cash investment doubles in ~2 years — after that, you're playing with house money.
- By year 4, paydown + projected appreciation supports a ~$36k cash-out refi (75% LTV) — recoverable capital for the next deal without selling this one.
Negotiation context
- It's been on market 220 days — a 12% lower offer ($84k) is reasonable based on typical stale-listing flexibility.
- 2 sale attempts since 14y ago with the ask held roughly flat each time — persistent listings suggest the price (not the market) is what's stuck; bring a comps-based counter.
- Current owner paid $63k; list at $96k implies a 52% gain — meaningful room to come down on a strong offer.
Risks & watch-outs
- Watch-outs: built in 1950 — expect roof / HVAC / electrical / plumbing capex.
Questions for the listing agent
- It's been on market 220 days. Have you received any prior offers? Is the seller open to a 12% concession, seller financing, or rate buy-down credit?
- Built in 1950 — when were the roof, HVAC, electrical panel, plumbing, and water heater last replaced?
- Why hasn't it sold? Are there any deal-killer items the seller is aware of (foundation, flood, title, zoning, code violations)?
- Is there a deadline driving the sale (1031 exchange, divorce, estate, relocation)? That informs how much negotiation room exists.
- Schools are F-rated, which usually means shorter tenancies and higher turnover. Who's the typical renter profile here, and what's been the actual vacancy rate?
- Crime grade is D in this area — have there been break-ins, vandalism, or insurance claims at this property in the last 3 years? What carrier currently insures it and at what premium?
- What's the average days-on-market for RENTAL listings here right now (not sales)? A rising rental-DOM trend means longer vacancies and softer asking-rent achievability than the comps imply.
- What's the recent tenant-quality profile in this submarket — average credit score on applications, eviction rate, late-payment / NSF rate, and stable-employment percentage? A property-management company in the area should have these aggregated.
- How much new for-sale + rental construction is in the pipeline within 1–3 miles? Heavy new supply typically softens prices + rents 12–24 months out; constrained supply supports both.
Investment metrics
- 1% rule
- 1.34% ✓
- Cap rate
- 10.77%
- Cash-on-cash
- 15.98%
- DSCR
- 1.71
- GRM
- 6.2
CMA / ARV
- ARV (median comp)
- $170,670
- List price
- $96,000
- Delta
- -43.75%
- Verdict
- UNDERPRICED
- Comps
- 15 within 1.0 mi
Show comp detail 2 sales within ~0.75 mi
| Address | Dist | Beds/Ba | Sqft | Sold | Price | $/sf | Match |
|---|---|---|---|---|---|---|---|
| 429 Elizabeth St | 0.65mi | 3/1.5 (-1) | 1,474 (-8%) | 5mo | $195,000 | $132 | 45 |
| N11906 Us Hwy 141 | 0.63mi | 3/2.0 (-1) | 1,782 (+11%) | 2mo | $199,900 | $112 | 42 |
Match score weights: distance 35% · size 25% · config 20% · recency 20%. Top-matched comps best support the ARV.
Projected returns pro-forma
10.0% appreciation · 3.0% rent growth · sell at horizon
- IRR
- 36.1%
- Equity multiple
- 3.79×
- Total profit
- $75,095
- Equity at exit
- $86,484
- IRR
- 31.1%
- Equity multiple
- 8.56×
- Total profit
- $203,244
- Equity at exit
- $186,507
Cash invested: $26,880 (down + closing). Projections, not guarantees.
Landlord ↔ Tenant lean methodology
- Overall (STATE)
- 73 Landlord-Friendly
- State Wisconsin
- 73 Landlord-Friendly · R+2
- County
- — inherits STATE
- City
- — inherits STATE
ZIP-level market 54177
- Home prices YoY
- 9.4%
- Active inventory
- 49
- Price-to-rent
- 6.2×
Monthly cashflow live
- Estimated rent
- $1,283 medium interval (Pro) →
- Mortgage (P&I)
- −$503
- Tax from tax record
- −$112 /mo · $1,348/yr
- Insurance
- −$40
- HOA
- −$0
- Vacancy / Maint / Mgmt
- −$269
- Net cashflow
- $358
Break-even live
UW: 25.0% down · 7.5% · 30yr · 1.5% tax · 5.0% vac · 8.0% maint · 8.0% mgmt
Financing live
Cash to close
- Down payment
- $24,000
- Closing costs
- $2,880
- Reserves months
- —
- Total cash needed
- —
Loan-product check · same deal, 3 products live
Conventional
25% down · 7.5% · 30yr
- Down + closing
- —
- Monthly P&I
- —
- Monthly cashflow
- —
- DSCR
- —
- Eligible?
- —
Personal DTI + credit; lowest rate.
DSCR
20% down · 8.5% · 30yr
- Down + closing
- —
- Monthly P&I
- —
- Monthly cashflow
- —
- DSCR
- —
- Eligible?
- —
No personal income docs; deal must DSCR.
Hard money
10% down · 12.0% · 12mo
- Down + closing
- —
- Monthly P&I
- —
- Monthly cashflow
- —
- DSCR
- —
- Eligible?
- —
Short-term bridge; refi at stabilization.
Listing history 20 events
-
2026-06-18days on market $96,000 Active 220 DOM
-
2026-06-17days on market $96,000 Active 219 DOM
-
2026-06-16days on market $96,000 Active 218 DOM
-
2026-06-15days on market $96,000 Active 217 DOM
-
2026-06-15days on market $96,000 Active 216 DOM
-
2026-06-13days on market $96,000 Active 215 DOM
-
2026-06-12days on market $96,000 Active 214 DOM
-
2026-06-09days on market $96,000 Active 211 DOM
-
2026-06-08days on market $96,000 Active 210 DOM
-
2026-06-08days on market $96,000 Active 209 DOM
-
2026-06-05days on market $96,000 Active 207 DOM
-
2026-06-04days on market $96,000 Active 206 DOM
-
2026-06-03days on market $96,000 Active 205 DOM
-
2026-06-02days on market $96,000 Active 204 DOM
-
2026-06-01days on market $96,000 Active 203 DOM
-
2026-05-31days on market $96,000 Active 202 DOM
-
2025-11-07$96,000 Active 338-char remark
Show marketing remark (338 chars)
Great corner lot wiith huge potential and a lot of space. In the Village of Wausaukee this diamond in the rough has 4 bedrooms, 1 bath, a formal dining room, den/office, and an extra bonus unfinished area in the attic. Unknown what year the home was built. The ceiling tiles in one of the upstairs bedrooms has been replaced with plywood.
-
2012-09-06historical
-
2012-07-27$12,000
-
2006-05-08soldstatus $63,000
ⓘ Source: listings_history table (triggers on properties + properties_extension) + one-shot
backfill from property_details.listing_events for pre-trigger history.
Tax reassessment forecast WI · Partial reset (capped growth)
- Current annual tax
- $1,348 · $112/mo
- Projected year-2 tax
- $1,562 · $130/mo
- Expected delta
- +$214/yr (+$18/mo · 15.9%)
ⓘ Screening estimate from a state-policy table — verify with the county assessor before closing.
Climate risk First Street
- Flood 1/10 Low FEMA zone X · 0% chance over 30 yrs
- Wildfire 4/10 Moderate
- Heat 1/10 Low 7 d/yr ≥94°F today · 13 d/yr by 30 yrs out
- Wind 1/10 Low
- Air quality 1/10 Low 0 unhealthy d/yr today · 0 by 30 yrs out
Nearby sold comps map
Loading sold comps map…
Walkable amenities ~0.75 mi
Loading nearby amenities…
Taxation est. · year 1
- Rental income
- $15,397
- − Mortgage interest
- −$5,377
- − Property taxes
- −$1,348
- − Insurance
- −$480
- − Repairs & maintenance
- −$1,232
- − Management
- −$1,232
- − Depreciation
- −$2,793
- Taxable income
- $2,936
- Est. tax owed @ 24.0%
- −$705
- After-tax cash flow
- $3,590/yr
For passive investors: Depreciation is non-cash, so a rental often shows a tax loss while cash-flowing — sheltering income. Rental losses are passive: they offset passive income freely, and up to $25,000/yr can offset ordinary (W-2) income if you actively participate and your MAGI is under $100k (phasing out to $0 by $150k); unused losses carry forward. On sale, claimed depreciation is recaptured at up to 25%, and gains may owe capital-gains tax (a 1031 exchange can defer both). Figures are a year-1 estimate at your 24.0% rate — not tax advice; consult a CPA.
Schools (NCES district)
- District
- Wausaukee School District
- NCES district ID
- 5515930
- Math proficiency
- 30% ▼ -1.00%
- Reading proficiency
- 20% ▼ -10.00%
- Median HH income
- $37,392
- Composite
- 23.91/100
- National rank
- #13203
- State rank
- #402 of 426 in WI
Livability — Wausaukee
- Score
- 64/100
- State rank
- #530
- US rank
- #13647
Category grades
Schools grade is shown separately in the Schools card above.
Census & demographics
- Census place
- Wausaukee, WI
- Population (ZIP)
- 2,788
Population outlook (Marinette County) Hauer SSP2
- Today (2025)
- 38,716 people
- By 2030
- 37,015 · -4.4%
- By 2040
- 32,824 · -15.2%
- By 2050
- 28,502 · -26.4%
- By 2075
- 20,562 · -46.9%
- By 2100
- 15,072 · -61.1%
Race, ethnicity, and origin ACS 2023
- Neighborhood character
- Predominantly White (96%)
- Race & ethnicity
- White 96% Two or more races 2% Asian 1%
- Common ancestry
- Romanian 10% Lithuanian 6% Italian 4%
- Foreign-born
- 2%
- Languages at home
- 97% English-only · Tagalog/Filipino 1% Russian/Polish/Slavic 1%
Political lean MEDSL · Marinette
- 2024 margin
- Solid R (+38.0) · D 30.4% · R 68.4% · Other 1.1%
- 2008→2024 swing
- -44.9pp toward R · 2008: 6.9pp · 2024: -38.0pp
- All cycles
- 2024: R+38.0 2020: R+34.5 2016: R+33.8 2012: R+3.6 2008: D+6.9
Not yet ingested
- Civics
- —
Market trends
- HPI YoY
- ▲ 25.36%
- Current HPI
- 296.0179
- Rent YoY
- —
- Metro
- —
- State GDP YoY
- ▲ 2.10%
- F500 in state
- 20
Industry mix (Fortune 500 HQ in WI)
| Industry | F500 HQs | Revenue |
|---|---|---|
| Industrial Machinery | 4 | $23B |
|
||
| Industrial Technology | 2 | $36B |
|
||
| Insurance | 1 | $36B |
|
||
| Professional Services | 1 | $19B |
|
||
| Utilities | 1 | $9B |
|
||
| Consumer Goods | 1 | $3B |
|
||
Price history
+52.4% since first listed4 events — show timeline
- 2025-11-07 Listed $96,000 RANW
- 2012-09-06 Listing Removed — MiRealSource-MiMLS
- 2012-07-27 Listed $12,000 MiRealSource-MiMLS
- 2006-05-08 Sold (Public Records) $63,000 Public Records
Property tax history
+1.3%/yrLatest (2025): $1,348 · +13.8% YoY. Source: county tax records.
Cash-flow waterfall
monthlySold comps — $/sqft
last 12 mo · ≤1 miLoading sold comps…