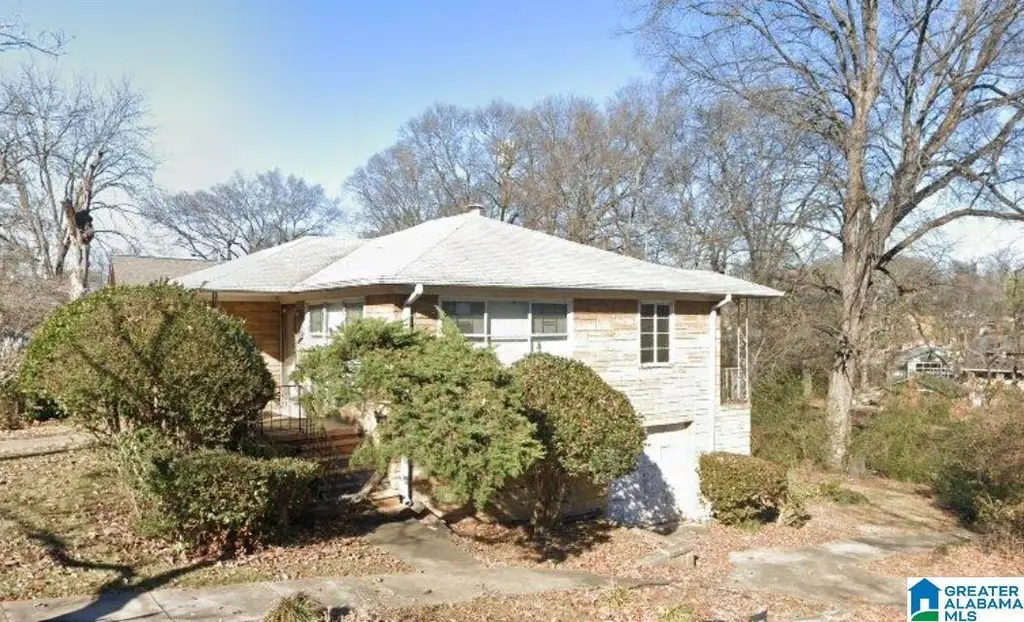
1701 28th St N · Birmingham, AL
Flood risk 1/10 · Minimal
- FEMA flood zone
- X (unshaded)
- Chance of flooding over 30 yrs
- 0.0%
- Est. flood insurance / yr
- $473 – $860
Fire risk 1/10 · Minimal
- Est. fire insurance / yr
- $916 – $1,700
Heat risk 6/10 · Moderate
- Hot days now (above 106°F)
- 7 days/yr
- Hot days in 30 yrs
- 19 days/yr
Wind risk 6/10 · Moderate
- Chance of severe wind over 30 yrs
- 27.0%
Air-quality risk 4/10 · Minor
- Unhealthy air days now
- 6 days/yr
- Unhealthy air days in 30 yrs
- 8 days/yr
Risk factors via First Street. Map © Google.
Why this score? — see what drove the B- grade
The composite is a weighted blend of 9 inputs, each scored 0–100. Each bar is that input's sub-score; the figure is the points it added to the 100-point composite (weight × sub-score).
- Cash flow +30.0/30.0
- DSCR +10.0/10.0
- 1% rule +8.2/10.0
- ARV discount +7.5/15.0
- Livability +3.4/5.0
- Rent growth +2.5/5.0
- Condition / age +2.5/5.0
- Schools +0.9/10.0
- Appreciation +0.1/10.0
$105,000
🖨 Deal sheet 📄 Offer letter ✓ Due diligence
Listing remarks MLS
Investor Special in the Heart of Norwood – Steps from the New Coca-Cola Amphitheater! Opportunity knocks in the sought-after Norwood community! This spacious 4-bedroom home is brimming with potential and perfectly positioned just steps away from the highly anticipated Coca-Cola Amphitheater—making it a prime investment in one of Birmingham’s fastest-growing neighborhoods. Whether you're looking to renovate and flip, build your rental portfolio, or create a stunning short-term rental, this property offers the location and space to make it happen. Surrounded by revitalization projects and historic charm, Norwood is quickly becoming a hub for culture, entertainment, and real estate growth. Don't miss your chance to invest in a neighborhood on the rise! Features: Ideal for large families or shared living Generous lot with room for expansion Minutes from Uptown, Topgolf, Protective Stadium, and downtown Birmingham Walkable location with high visibility and future resale. Sold As-Is.
Key facts
- Generous lot
- Room for expansion
- Spacious home
Tags
Neighborhood map
What this means for you Summary
Snapshot
- This is a 4-bed/1.5-bath single-family listed at $105k.
Deal economics
- At list price, monthly cash flow is $439 ($5k/yr) — positive.
- The deal already cash-flows at list — no discount required.
- Meets the 1% rule at list price ($1k rent vs $105k).
- Recommended offer: $92k (12.0% below list) — sets the bar for market timing.
- Cap rate 11.3% vs local median 6.2% in Birmingham — top-decile yield for the area; either an underpriced asset or a hidden risk that comps aren't pricing in. Stress-test before assuming the spread holds.
Location & tenants
- Location reads 67/100 on livability (#78 in AL) — a middle-class / working-renter tenant base. Strengths: commute A+, cost of living A+, housing A+; Watch: amenities C-, schools F, crime F.
- Birmingham City (urban): math 4% / reading 20% proficiency, ranked #116 of 129 in AL (top 90%) — low school quality limits family demand, transient renter base, plan for 1-2y turnover; 82% free/reduced lunch — lower-income household profile, screen leases tightly.
- Market conditions: 54 active listings in the ZIP; 15 comparable units currently listed for rent nearby; rentals at typical pace (median 22d on market — plan ~3-4 weeks tenant-placement turnaround); 47% of comp listings sitting > 30 days — soft ceiling on asking rent; 2,114 units permitted in Jefferson County in 2024 (556 in 5+ unit buildings).
Forward outlook
- Local home prices are declining (-3.0%/yr); year-one equity from $726 of loan paydown is wiped out by about $3k of value loss. Plan a longer hold.
- Jefferson County population projected to shrink 4% by 2050 — rents likely to lag national; underwrite the cash flow, not the appreciation.
- At projected returns (-3.0% appreciation + 3.0% rent growth), your $29k cash investment doubles in ~7 years — after that, you're playing with house money.
Negotiation context
- It's been on market 343 days — a 12% lower offer ($92k) is reasonable based on typical stale-listing flexibility.
Risks & watch-outs
- Watch-outs: built in 1955 — expect roof / HVAC / electrical / plumbing capex.
- Climate carrying-cost: major wind risk, 27% chance of damaging wind over 30y; extreme-heat days projected 7→19/yr by 2055 (HVAC capex compounding) — expect insurance premiums to compound above CPI over the hold.
Questions for the listing agent
- It's been on market 343 days. Have you received any prior offers? Is the seller open to a 12% concession, seller financing, or rate buy-down credit?
- Built in 1955 — when were the roof, HVAC, electrical panel, plumbing, and water heater last replaced?
- Why hasn't it sold? Are there any deal-killer items the seller is aware of (foundation, flood, title, zoning, code violations)?
- Is there a deadline driving the sale (1031 exchange, divorce, estate, relocation)? That informs how much negotiation room exists.
- Schools are F-rated, which usually means shorter tenancies and higher turnover. Who's the typical renter profile here, and what's been the actual vacancy rate?
- Crime grade is F in this area — have there been break-ins, vandalism, or insurance claims at this property in the last 3 years? What carrier currently insures it and at what premium?
- What's the average days-on-market for RENTAL listings here right now (not sales)? A rising rental-DOM trend means longer vacancies and softer asking-rent achievability than the comps imply.
- What's the recent tenant-quality profile in this submarket — average credit score on applications, eviction rate, late-payment / NSF rate, and stable-employment percentage? A property-management company in the area should have these aggregated.
- How much new for-sale + rental construction is in the pipeline within 1–3 miles? Heavy new supply typically softens prices + rents 12–24 months out; constrained supply supports both.
Investment metrics
- 1% rule
- 1.32% ✓
- Cap rate
- 11.30%
- Cash-on-cash
- 17.90%
- DSCR
- 1.80
- GRM
- 6.3
CMA / ARV
- ARV (median comp)
- $232,717
- List price
- $105,000
- Delta
- -54.88%
- Verdict
- UNDERPRICED
- Comps
- 20 within 1.0 mi
Show comp detail 12 sales within ~0.75 mi
| Address | Dist | Beds/Ba | Sqft | Sold | Price | $/sf | Match |
|---|---|---|---|---|---|---|---|
| 1431 28th St N | 0.25mi | 4/2.0 | 1,746 (-5%) | 6mo | $209,900 | $120 | 73 |
| 1601 31st St N | 0.27mi | 4/2.0 | 1,776 (-3%) | 12mo | $95,000 | $53 | 70 |
| 1617 27th St N | 0.15mi | 3/3.0 (-1) | 1,750 (-4%) | 9mo | $245,000 | $140 | 68 |
| 1615 31st St N | 0.24mi | 3/2.0 (-1) | 1,800 (-2%) | 17mo | $240,000 | $133 | 65 |
| 1606 27th St N | 0.19mi | 4/2.0 | 1,583 (-14%) | 4mo | $115,000 | $73 | 63 |
| 2718 20th Ave N | 0.22mi | 3/2.0 (-1) | 1,632 (-11%) | 5mo | $64,000 | $39 | 60 |
| 1617 20th St N | 0.59mi | 4/2.0 | 1,774 (-3%) | 12mo | $135,000 | $76 | 55 |
| 2928 Norwood Blvd | 0.16mi | 3/1.0 (-1) | 1,624 (-11%) | 15mo | $132,000 | $81 | 54 |
| 3100 Norwood Blvd | 0.28mi | 4/2.0 | 1,598 (-13%) | 12mo | $155,000 | $97 | 54 |
| 1555 Druid Hill Dr | 0.65mi | 3/2.0 (-1) | 1,935 (+6%) | 14mo | $90,000 | $47 | 41 |
| 1932 Portage Ave | 0.69mi | 4/1.0 | 1,996 (+9%) | 16mo | $82,823 | $41 | 38 |
| 2204 14th Ave N | 0.65mi | 3/1.0 (-1) | 1,571 (-14%) | 8mo | $164,681 | $105 | 32 |
Match score weights: distance 35% · size 25% · config 20% · recency 20%. Top-matched comps best support the ARV.
Projected returns pro-forma
-3.0% appreciation · 3.0% rent growth · sell at horizon
- IRR
- 9.4%
- Equity multiple
- 1.37×
- Total profit
- $10,896
- Equity at exit
- $15,656
- IRR
- 18.6%
- Equity multiple
- 2.54×
- Total profit
- $45,373
- Equity at exit
- $9,078
Cash invested: $29,400 (down + closing). Projections, not guarantees.
Landlord ↔ Tenant lean methodology
- Overall (STATE)
- 90 Strongly Landlord-Friendly
- State Alabama
- 90 Strongly Landlord-Friendly · R+15
- County
- — inherits STATE
- City
- — inherits STATE
ZIP-level market 35234
- Home prices YoY
- -3.8%
- Active inventory
- 54
- Price-to-rent
- 6.3×
Monthly cashflow live
- Estimated rent
- $1,390 high interval (Pro) →
- Mortgage (P&I)
- −$551
- Tax from tax record
- −$65 /mo · $779/yr
- Insurance
- −$44
- HOA
- −$0
- Vacancy / Maint / Mgmt
- −$292
- Net cashflow
- $439
Break-even live
UW: 25.0% down · 7.5% · 30yr · 1.5% tax · 5.0% vac · 8.0% maint · 8.0% mgmt
Financing live
Cash to close
- Down payment
- $26,250
- Closing costs
- $3,150
- Reserves months
- —
- Total cash needed
- —
Loan-product check · same deal, 3 products live
Conventional
25% down · 7.5% · 30yr
- Down + closing
- —
- Monthly P&I
- —
- Monthly cashflow
- —
- DSCR
- —
- Eligible?
- —
Personal DTI + credit; lowest rate.
DSCR
20% down · 8.5% · 30yr
- Down + closing
- —
- Monthly P&I
- —
- Monthly cashflow
- —
- DSCR
- —
- Eligible?
- —
No personal income docs; deal must DSCR.
Hard money
10% down · 12.0% · 12mo
- Down + closing
- —
- Monthly P&I
- —
- Monthly cashflow
- —
- DSCR
- —
- Eligible?
- —
Short-term bridge; refi at stabilization.
Rent comps 15 comps
| Address | Beds | Baths | Sqft | Rent | $/sqft | DOM | Units | Dist |
|---|---|---|---|---|---|---|---|---|
| 2223 28th St N Birmingham, AL | 4.0 | 2.0 | 1836 | $1,300 | $0.71 | 43d | 1 | 0.37mi |
| 2108 25th St N Birmingham, AL | 4.0 | 2.0 | 1446 | $1,300 | $0.90 | 43d | 1 | 0.39mi |
| 1319 31st St N Birmingham, AL | 3.0 | 2.0 | 2074 | $1,345 | $0.65 | 21d | 1 | 0.46mi |
| 1720 34th Pl N Birmingham, AL | 3.0 | 3.0 | 1861 | $2,200 | $1.18 | 1d | 1 | 0.68mi |
| 1900 15th Ct N Birmingham, AL | 4.0 | 2.0 | 1748 | $1,425 | $0.82 | 43d | 1 | 0.80mi |
| 3601 Norwood Blvd Birmingham, AL | 3.0 | 2.0 | 1558 | $1,323 | $0.85 | 3d | 1 | 0.84mi |
| 1430 19th St N Birmingham, AL | 5.0 | 2.0 | 1976 | $1,300 | $0.66 | 43d | 1 | 0.86mi |
| 1608 18th Pl N Birmingham, AL | 3.0 | 2.0 | 1243 | $950 | $0.76 | 43d | 1 | 0.89mi |
| 2807 34th St N Birmingham, AL | 4.0 | 2.0 | 1556 | $1,100 | $0.71 | 43d | 1 | 1.02mi |
| 1742 17th St N Unit 2 Birmingham, AL | 3.0 | 2.0 | 1300 | $1,500 | $1.15 | 16d | 1 | 1.04mi |
| 600 24th St N Birmingham, AL | 1.0–3.0 | 1.0–2.0 | 1098 | $1,499 | $1.36 | 1d | 13 | 1.20mi |
| 1317 11th St N Birmingham, AL | 3.0 | 1.0 | 1340 | $1,200 | $0.90 | 43d | 1 | 1.36mi |
| 600 19th St N Birmingham, AL | 1.0–3.0 | 1.0–3.0 | 1398 | $4,560 | $3.26 | 19d | 83 | 1.42mi |
| 600 19th St N Birmingham, AL | 1.0–3.0 | 1.0–2.0 | 1120 | $3,550 | $3.17 | 16d | 30 | 1.42mi |
| 600 19th St N Apt 202 Birmingham, AL | 3.0 | 2.0 | 1248 | $3,050 | $2.44 | 11d | 1 | 1.43mi |
Listing history 15 events
-
2026-06-18days on market $105,000 Active 343 DOM
-
2026-06-17days on market $105,000 Active 342 DOM
-
2026-06-16days on market $105,000 Active 341 DOM
-
2026-06-15days on market $105,000 Active 340 DOM
-
2026-06-13days on market $105,000 Active 338 DOM
-
2026-06-10days on market $105,000 Active 335 DOM
-
2026-06-09days on market $105,000 Active 334 DOM
-
2026-06-08days on market $105,000 Active 333 DOM
-
2026-06-07days on market $105,000 Active 332 DOM
-
2026-06-03days on market $105,000 Active 328 DOM
-
2026-06-02days on market $105,000 Active 327 DOM
-
2026-06-01days on market $105,000 Active 326 DOM
-
2026-05-31days on market $105,000 Active 325 DOM
-
2025-08-14price $105,000 1010-char remark
Show marketing remark (1010 chars)
Investor Special in the Heart of Norwood – Steps from the New Coca-Cola Amphitheater! Opportunity knocks in the sought-after Norwood community! This spacious 4-bedroom home is brimming with potential and perfectly positioned just steps away from the highly anticipated Coca-Cola Amphitheater—making it a prime investment in one of Birmingham’s fastest-growing neighborhoods. Whether you're looking to renovate and flip, build your rental portfolio, or create a stunning short-term rental, this property offers the location and space to make it happen. Surrounded by revitalization projects and historic charm, Norwood is quickly becoming a hub for culture, entertainment, and real estate growth. Don't miss your chance to invest in a neighborhood on the rise! Features: Ideal for large families or shared living Generous lot with room for expansion Minutes from Uptown, Topgolf, Protective Stadium, and downtown Birmingham Walkable location with high visibility and future resale. Sold As-Is.
-
2025-07-08$140,000 Active 1010-char remark
Show marketing remark (1010 chars)
Investor Special in the Heart of Norwood – Steps from the New Coca-Cola Amphitheater! Opportunity knocks in the sought-after Norwood community! This spacious 4-bedroom home is brimming with potential and perfectly positioned just steps away from the highly anticipated Coca-Cola Amphitheater—making it a prime investment in one of Birmingham’s fastest-growing neighborhoods. Whether you're looking to renovate and flip, build your rental portfolio, or create a stunning short-term rental, this property offers the location and space to make it happen. Surrounded by revitalization projects and historic charm, Norwood is quickly becoming a hub for culture, entertainment, and real estate growth. Don't miss your chance to invest in a neighborhood on the rise! Features: Ideal for large families or shared living Generous lot with room for expansion Minutes from Uptown, Topgolf, Protective Stadium, and downtown Birmingham Walkable location with high visibility and future resale. Sold As-Is.
ⓘ Source: listings_history table (triggers on properties + properties_extension) + one-shot
backfill from property_details.listing_events for pre-trigger history.
Tax reassessment forecast AL · Resets to sale price
- Current annual tax
- $779 · $65/mo
- Projected year-2 tax
- $779 · $65/mo
- Expected delta
- $0/yr ($0/mo · 0.0%)
ⓘ Screening estimate from a state-policy table — verify with the county assessor before closing.
Climate risk First Street
- Flood 1/10 Low FEMA zone X (unshaded) · 0% chance over 30 yrs
- Wildfire 1/10 Low
- Heat 6/10 Major 7 d/yr ≥106°F today · 19 d/yr by 30 yrs out
- Wind 6/10 Major 27% chance of damaging wind over 30 yrs
- Air quality 4/10 Moderate 6 unhealthy d/yr today · 8 by 30 yrs out
Nearby sold comps map
Loading sold comps map…
Walkable amenities ~0.75 mi
Loading nearby amenities…
Taxation est. · year 1
- Rental income
- $16,677
- − Mortgage interest
- −$5,882
- − Property taxes
- −$779
- − Insurance
- −$525
- − Repairs & maintenance
- −$1,334
- − Management
- −$1,334
- − Depreciation
- −$3,055
- Taxable income
- $3,768
- Est. tax owed @ 24.0%
- −$904
- After-tax cash flow
- $4,358/yr
For passive investors: Depreciation is non-cash, so a rental often shows a tax loss while cash-flowing — sheltering income. Rental losses are passive: they offset passive income freely, and up to $25,000/yr can offset ordinary (W-2) income if you actively participate and your MAGI is under $100k (phasing out to $0 by $150k); unused losses carry forward. On sale, claimed depreciation is recaptured at up to 25%, and gains may owe capital-gains tax (a 1031 exchange can defer both). Figures are a year-1 estimate at your 24.0% rate — not tax advice; consult a CPA.
Schools (NCES district)
- District
- Birmingham City
- NCES district ID
- 0100390
- Math proficiency
- 4% ▼ -17.00%
- Reading proficiency
- 20% ▼ -4.00%
- Median HH income
- $31,988
- Composite
- 9.49/100
- National rank
- #9850
- State rank
- #116 of 129 in AL
Livability — Birmingham
- Score
- 67/100
- State rank
- #78
- US rank
- #10412
Category grades
Schools grade is shown separately in the Schools card above.
Census & demographics
- Census place
- Birmingham, AL
- City population
- 210,422
- Population (ZIP)
- 3,828
Population outlook (Jefferson County) Hauer SSP2
- Today (2025)
- 669,185 people
- By 2030
- 669,694 · +0.1%
- By 2040
- 661,388 · -1.2%
- By 2050
- 643,086 · -3.9%
- By 2075
- 577,267 · -13.7%
- By 2100
- 474,758 · -29.1%
Race, ethnicity, and origin ACS 2023
- Neighborhood character
- Predominantly Black (80%)
- Race & ethnicity
- Black 80% White 15% Hispanic / Latino 3% Two or more races 1%
- Common ancestry
- Slovak 1% Romanian 1%
- Foreign-born
- 1% · Canada
- Languages at home
- 97% English-only · Spanish 3%
Political lean MEDSL · Jefferson
- 2024 margin
- D (+10.4) · D 54.6% · R 44.2% · Other 1.2%
- 2008→2024 swing
- +5.4pp toward D · 2008: 5.1pp · 2024: 10.4pp
- All cycles
- 2024: D+10.4 2020: D+13.2 2016: D+7.2 2012: D+6.0 2008: D+5.1
Not yet ingested
- Civics
- —
Market trends
- HPI YoY
- ▼ -9.89%
- Current HPI
- 250.4724
- Rent YoY
- —
- Metro
- —
- State GDP YoY
- ▲ 2.94%
- F500 in state
- 4
Industry mix (Fortune 500 HQ in AL)
| Industry | F500 HQs | Revenue |
|---|---|---|
| Financial Services | 1 | $8B |
|
||
| Healthcare | 1 | $5B |
|
||
Price history
-25.0% since first listed2 events — show timeline
- 2025-08-14 Price Changed $105,000 Greater Alabama MLS
- 2025-07-08 Listed $140,000 Greater Alabama MLS
Property tax history
+7.2%/yrLatest (2025): $779 · +0.0% YoY. Source: county tax records.
Cash-flow waterfall
monthlySold comps — $/sqft
last 12 mo · ≤1 miLoading sold comps…