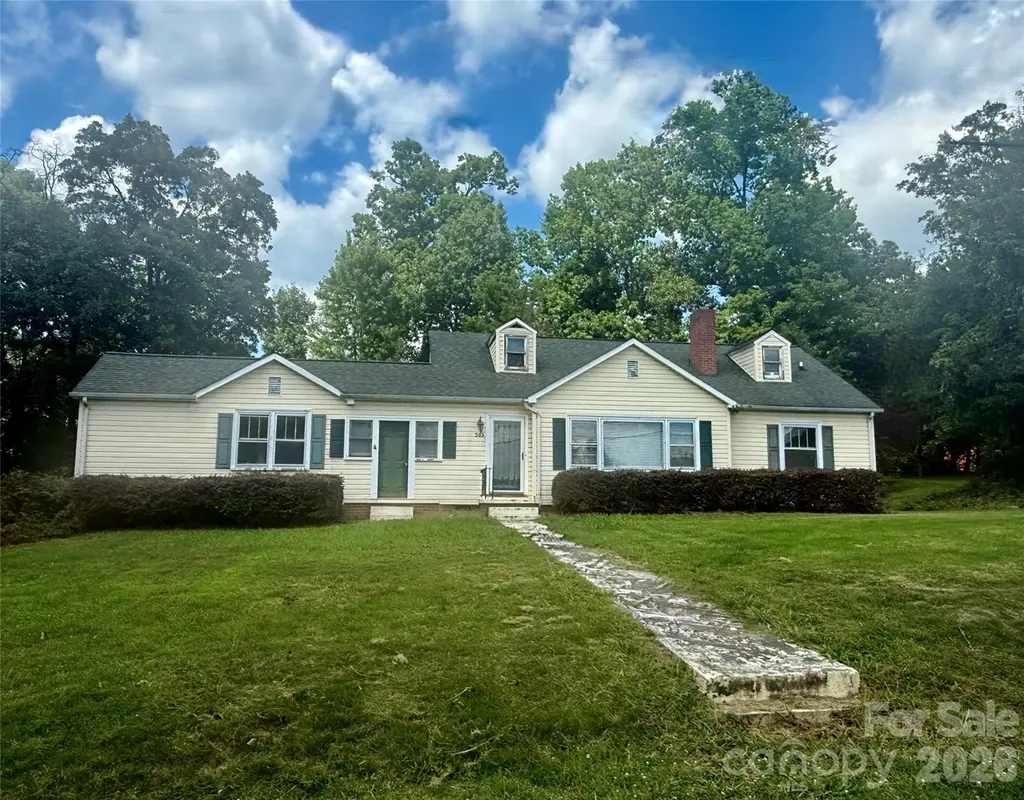
303 Cavin Ave · Mount Holly, NC
Flood risk 1/10 · Minimal
- FEMA flood zone
- X (unshaded)
- Chance of flooding over 30 yrs
- 0.0%
- Est. flood insurance / yr
- $507 – $1,088
Fire risk 1/10 · Minimal
- Est. fire insurance / yr
- $906 – $1,684
Heat risk 6/10 · Moderate
- Hot days now (above 105°F)
- 7 days/yr
- Hot days in 30 yrs
- 17 days/yr
Wind risk 5/10 · Moderate
- Chance of severe wind over 30 yrs
- 23.0%
Air-quality risk 3/10 · Minor
- Unhealthy air days now
- 3 days/yr
- Unhealthy air days in 30 yrs
- 4 days/yr
Risk factors via First Street. Map © Google.
Why this score? — see what drove the F grade
The composite is a weighted blend of 9 inputs, each scored 0–100. Each bar is that input's sub-score; the figure is the points it added to the 100-point composite (weight × sub-score).
- ARV discount +11.7/15.0
- Cash flow +6.8/30.0
- Schools +3.6/10.0
- Livability +3.4/5.0
- Rent growth +3.0/5.0
- Condition / age +2.5/5.0
- 1% rule +1.1/10.0
- DSCR +1.0/10.0
- Appreciation +0.0/10.0
$299,000
🖨 Deal sheet (PDF) 📄 Offer letter ✓ Due diligence
Listing remarks
Fixer Upper! Have you dreamed of the opportunity to channel your inner Chip and Joanna Gaines? Well, here is your chance! This house has sat elegantly on this beautiful, mature lot for many years and needs new life breathed into it! Priced with the repairs in mind. Sold as is. So much opportunity with this large, corner lot home. Make your dream of home ownership come true today and put all of YOUR special touches into this house. You can make it the home you’ve always imagined. The character is already peeking through…if you are a visionary and have home repair skills, this is the deal you’ve been looking for. Please let me know if you have any questions.
Key facts
- 0.73 acre lot
- 2 garage spots
- Built 1949
Property features AI
Finance
- HOA & community: No HOA
Exterior
- Parking: Attached 2-car garage; Driveway with room for 4+ cars; Additional parking spaces (4 open spaces)
- Utilities: City water; Public sewer
- Home design: Single-family residential home; Site-built construction; One and one-half story
- Construction: Vinyl exterior; Crawl space foundation
- Exterior features: Corner lot; Concrete and paved roads; Publicly maintained road
Interior
- Kitchen: No appliances listed
- Bedrooms: 4 bedrooms total (3 on the main level, 1 on the upper level)
- Bathrooms: 2 full bathrooms (1 on the main level, 1 on the upper level)
- Heating & cooling: Natural gas heating; Central air conditioning
- Interior features: 7 total rooms; Living room fireplace
- Laundry & utility: Laundry located in a common area on the main level
Neighborhood map
What this means for you Summary
Snapshot
- This is a 3-bed/1.0-bath single-family listed at $299k.
Deal economics
- At list price, monthly cash flow is $-468 ($-6k/yr) — negative.
- To cash-flow at today's rent, offer at most $216k (27.7% below list).
- To meet the 1% rule (rent ≥ 1% of price), the offer needs to be $182k (39.0% below list).
- Recommended offer: $182k (39.0% below list) — sets the bar for 1% rule.
Location & tenants
- Location reads 67/100 on livability (#214 in NC) — a middle-class / working-renter tenant base. Strengths: cost of living A+, housing A+, crime A-; Watch: employment D+, health & safety D+, amenities F.
- Gaston County Schools (suburban): math 44% / reading 42% proficiency, ranked #93 of 178 in NC (top 52%) — families likely to look elsewhere, expect single-tenant / working-renter base with shorter leases.
- Zoned schools: Pinewood Elementary (math 52% / reading 50%, grade C-, #397 of 1,410 statewide, top 28%, 485 students, 56% FRL); Mount Holly Middle (math 45% / reading 46%, grade D+, #154 of 475 statewide, top 33%, 557 students, 62% FRL); Stuart W Cramer High (math 77% / reading 53%, grade B, #161 of 535 statewide, top 30%, 964 students, 45% FRL) — zoned schools average 54% FRL vs 37% district-wide (18 pts higher); higher-poverty schools than district average — tighter screening recommended.
- Market conditions: Rents rising (+2.1%/yr); 135 active listings in the ZIP; 12 comparable units currently listed for rent nearby; rentals leasing fast (median 13d on market — plan ~1-2 weeks tenant-placement turnaround); solid renter incomes; 2,069 units permitted in Gaston County in 2024 (142 in 5+ unit buildings).
Forward outlook
- Local home prices are declining (-3.0%/yr); year-one equity from $2k of loan paydown is wiped out by about $9k of value loss. Plan a longer hold.
- Gaston County population projected at +12% by 2050 — modest demand growth; plan on rents tracking national, not racing it.
Negotiation context
- Only 9 days on market — expect competitive offers; lowballing is unlikely to land.
- Current owner paid $44k; list at $299k implies a 587% gain — meaningful room to come down on a strong offer.
Risks & watch-outs
- Watch-outs: built in 1949 — expect roof / HVAC / electrical / plumbing capex.
- Climate carrying-cost: moderate wind risk, 23% chance of damaging wind over 30y; extreme-heat days projected 7→17/yr by 2055 (HVAC capex compounding) — expect insurance premiums to compound above CPI over the hold.
Questions for the listing agent
- What do current leases actually rent for vs. the listed asking? Can we see a recent rent roll and the last 12 months of T-12 income?
- Built in 1949 — when were the roof, HVAC, electrical panel, plumbing, and water heater last replaced?
- Is there a deadline driving the sale (1031 exchange, divorce, estate, relocation)? That informs how much negotiation room exists.
- Schools are D-rated, which usually means shorter tenancies and higher turnover. Who's the typical renter profile here, and what's been the actual vacancy rate?
- The area grade is low — what's the realistic commute time and amenity access for the typical tenant pool here? Any planned neighborhood developments (good or bad) we should know about?
- What's the average days-on-market for RENTAL listings here right now (not sales)? A rising rental-DOM trend means longer vacancies and softer asking-rent achievability than the comps imply.
- What's the recent tenant-quality profile in this submarket — average credit score on applications, eviction rate, late-payment / NSF rate, and stable-employment percentage? A property-management company in the area should have these aggregated.
- How much new for-sale + rental construction is in the pipeline within 1–3 miles? Heavy new supply typically softens prices + rents 12–24 months out; constrained supply supports both.
Investment metrics
- 1% rule
- 0.61% ✗
- Cap rate
- 4.41%
- Cash-on-cash
- -6.71%
- DSCR
- 0.70
- GRM
- 13.7
CMA / ARV
- ARV (on-the-fly)
- $329,640
- Comps found
- 12
Show comp detail 12 sales within ~0.75 mi
| Address | Dist | Beds/Ba | Sqft | Sold | Price | $/sf | Match |
|---|---|---|---|---|---|---|---|
| 113 S Mulberry Ct | 0.18mi | 3/2.0 | 1,294 (-3%) | 5mo | $345,000 | $267 | 78 |
| 105 S Tanninger Rd | 0.17mi | 3/2.5 | 1,452 (+8%) | 5mo | $368,200 | $254 | 68 |
| 504 N Hawthorne St | 0.22mi | 3/2.0 | 1,202 (-10%) | 4mo | $317,500 | $264 | 65 |
| 132 Sella Ridge Dr | 0.34mi | 3/2.0 | 1,218 (-9%) | 2mo | $315,000 | $259 | 64 |
| 781 Woodlawn Ave | 0.63mi | 3/2.0 | 1,334 (-0%) | 3mo | $340,000 | $255 | 63 |
| 501 N Hawthorne St | 0.26mi | 3/2.0 | 1,221 (-9%) | 8mo | $300,000 | $246 | 62 |
| 157 Brookstone Dr | 0.54mi | 3/2.0 | 1,392 (+4%) | 7mo | $335,000 | $241 | 58 |
| 402 N Hawthorne St | 0.30mi | 3/2.0 | 1,469 (+10%) | 10mo | $280,000 | $191 | 58 |
| 401 W Charlotte Ave | 0.55mi | 3/2.5 | 1,433 (+7%) | 8mo | $309,900 | $216 | 50 |
| 1005 N Main St | 0.47mi | 3/2.0 | 1,482 (+11%) | 11mo | $320,000 | $216 | 48 |
| 708 Noles Dr | 0.64mi | 3/2.0 | 1,485 (+11%) | 2mo | $289,900 | $195 | 46 |
| 225 N Lee St | 0.70mi | 3/2.0 | 1,488 (+11%) | 6mo | $280,000 | $188 | 40 |
Match score weights: distance 35% · size 25% · config 20% · recency 20%. Top-matched comps best support the ARV.
Projected returns pro-forma
-3.0% appreciation · 2.14% rent growth · sell at horizon
- IRR
- -28.8%
- Equity multiple
- 0.05×
- Total profit
- $-79,917
- Equity at exit
- $44,582
- IRR
- -32.2%
- Equity multiple
- -0.37×
- Total profit
- $-114,596
- Equity at exit
- $25,852
Cash invested: $83,720 (down + closing). Projections, not guarantees.
Landlord ↔ Tenant lean methodology
- Overall (STATE)
- 85 Strongly Landlord-Friendly
- State North Carolina
- 85 Strongly Landlord-Friendly · R+3
- County
- — inherits STATE
- City
- — inherits STATE
ZIP-level market 28120
- Rents YoY
- 2.1%
- Active inventory
- 135
- Price-to-rent
- 13.7×
Monthly cashflow live
- Estimated rent
- $1,824 high interval (Pro) →
- Mortgage (P&I)
- −$1,568
- Tax from tax record
- −$217 /mo · $2,605/yr
- Insurance
- −$125
- HOA
- −$0
- Vacancy / Maint / Mgmt
- −$383
- Net cashflow
- $-468
Break-even live
Sensitivity live
| Price | -10% $-299 | -5% $-384 | +0% $-468 | +5% $-553 | +10% $-638 |
|---|---|---|---|---|---|
| Rent | -10% $-613 | -5% $-540 | +0% $-468 | +5% $-396 | +10% $-324 |
| Rate | -1.0pp $-318 | -0.5pp $-392 | base $-468 | +0.5pp $-546 | +1.0pp $-625 |
UW: 25.0% down · 7.5% · 30yr · 1.5% tax · 5.0% vac · 8.0% maint · 8.0% mgmt
Financing live
Cash to close
- Down payment
- $74,750
- Closing costs
- $8,970
- Reserves months
- —
- Total cash needed
- —
Loan-product check · same deal, 3 products live
Conventional
25% down · 7.5% · 30yr
- Down + closing
- —
- Monthly P&I
- —
- Monthly cashflow
- —
- DSCR
- —
- Eligible?
- —
Personal DTI + credit; lowest rate.
DSCR
20% down · 8.5% · 30yr
- Down + closing
- —
- Monthly P&I
- —
- Monthly cashflow
- —
- DSCR
- —
- Eligible?
- —
No personal income docs; deal must DSCR.
Hard money
10% down · 12.0% · 12mo
- Down + closing
- —
- Monthly P&I
- —
- Monthly cashflow
- —
- DSCR
- —
- Eligible?
- —
Short-term bridge; refi at stabilization.
Rent comps 12 comps
| Address | Beds | Baths | Sqft | Rent | $/sqft | DOM | Units | Dist |
|---|---|---|---|---|---|---|---|---|
| 101 Cavin Ave Mount Holly, NC | 2.0 | 2.0 | 924 | $1,650 | $1.79 | 6d | 1 | 0.21mi |
| 177 Brookstone Dr Mount Holly, NC | 3.0 | 2.0 | 1218 | $1,775 | $1.46 | 25d | 1 | 0.55mi |
| 340 W Central Ave Mount Holly, NC | 3.0 | 1.0 | 1315 | $1,950 | $1.48 | 25d | 1 | 0.65mi |
| 300 E Charlotte Ave Mount Holly, NC | 2.0 | 1.5 | 1000 | $1,358 | $1.36 | 6d | 3 | 0.67mi |
| 300 E Charlotte Ave Mount Holly, NC | 2.0 | 1.5 | 1000 | $1,418 | $1.42 | 0d | 2 | 0.67mi |
| 105 Julia St Mount Holly, NC | 3.0 | 1.5 | 1000 | $1,695 | $1.70 | 3d | 1 | 0.79mi |
| 312 W Catawba Ave Unit CAT-01 Mt Holly, NC | 2.0 | 1.5 | 940 | $1,250 | $1.33 | 0d | 1 | 0.92mi |
| 318 Highland St Unit 2 Mt Holly, NC | 2.0 | 1.5 | 950 | $1,250 | $1.32 | 13d | 1 | 0.97mi |
| 318 Highland St Mount Holly, NC | 2.0 | 2.0 | 980 | $1,250 | $1.28 | 23d | 1 | 0.98mi |
| 366 Crandon Rd Mount Holly, NC | 3.0 | 2.5 | 1832 | $2,650 | $1.45 | 25d | 1 | 0.99mi |
| 104 Arbor Ridge Rd Mount Holly, NC | 4.0 | 2.5 | 1833 | $2,070 | $1.13 | 14d | 1 | 1.04mi |
| 164 Silver Birch Ln Mount Holly, NC | 3.0 | 2.0 | 1725 | $2,000 | $1.16 | 0d | 1 | 1.45mi |
Listing history 7 events
-
2026-06-21days on market $299,000 Active 9 DOM
-
2026-06-18days on market $299,000 Active 6 DOM
-
2026-06-17days on market $299,000 Active 5 DOM
-
2026-06-16days on market $299,000 Active 4 DOM
-
2026-06-15days on market $299,000 Active 3 DOM
-
2026-06-13remarks 664-char remark
-
2026-06-13$299,000 Active 1 DOM
ⓘ Source: listings_history table (triggers on properties + properties_extension) + one-shot
backfill from property_details.listing_events for pre-trigger history.
Tax reassessment forecast NC · Resets to sale price
- Current annual tax
- $2,605 · $217/mo
- Projected year-2 tax
- $2,605 · $217/mo
- Expected delta
- $0/yr ($0/mo · 0.0%)
ⓘ Screening estimate from a state-policy table — verify with the county assessor before closing.
Climate risk First Street
- Flood 1/10 Low FEMA zone X (unshaded) · 0% chance over 30 yrs
- Wildfire 1/10 Low
- Heat 6/10 Major 7 d/yr ≥105°F today · 17 d/yr by 30 yrs out
- Wind 5/10 Major 23% chance of damaging wind over 30 yrs
- Air quality 3/10 Moderate 3 unhealthy d/yr today · 4 by 30 yrs out
Nearby sold comps map
Loading sold comps map…
Walkable amenities ~0.75 mi
Loading nearby amenities…
Taxation est. · year 1
- Rental income
- $21,892
- − Mortgage interest
- −$16,749
- − Property taxes
- −$2,605
- − Insurance
- −$1,495
- − Repairs & maintenance
- −$1,751
- − Management
- −$1,751
- − Depreciation
- −$8,698
- Taxable loss
- −$11,157
- Est. tax savings @ 24.0%
- +$2,678
- After-tax cash flow
- $-2,943/yr
For passive investors: Depreciation is non-cash, so a rental often shows a tax loss while cash-flowing — sheltering income. Rental losses are passive: they offset passive income freely, and up to $25,000/yr can offset ordinary (W-2) income if you actively participate and your MAGI is under $100k (phasing out to $0 by $150k); unused losses carry forward. On sale, claimed depreciation is recaptured at up to 25%, and gains may owe capital-gains tax (a 1031 exchange can defer both). Figures are a year-1 estimate at your 24.0% rate — not tax advice; consult a CPA.
Schools (NCES district)
- District
- Gaston County Schools
- NCES district ID
- 3701620
- Math proficiency
- 44% ▲ 4.00%
- Reading proficiency
- 42% ▲ 1.00%
- Median HH income
- $43,644
- Composite
- 36.39/100
- National rank
- #4680
- State rank
- #93 of 178 in NC
Livability — Mount Holly
- Score
- 67/100
- State rank
- #214
- US rank
- #10224
Category grades
Schools grade is shown separately in the Schools card above.
Census & demographics
- Census place
- Mount Holly, NC
- County
- Gaston County · 201,497 people
- City population
- 25,805
- Metro
- Charlotte-Concord-Gastonia, NC-SC
- Population (ZIP)
- 25,805
- Household income
- $78,231
- Rent vs Own
- Severe rent burden
- 817.0
Population outlook (Gaston County) Hauer SSP2
- Today (2025)
- 230,027 people
- By 2030
- 237,300 · +3.2%
- By 2040
- 249,659 · +8.5%
- By 2050
- 257,806 · +12.1%
- By 2075
- 272,163 · +18.3%
- By 2100
- 268,652 · +16.8%
Race, ethnicity, and origin ACS 2023
- Neighborhood character
- Predominantly White (71%)
- Race & ethnicity
- White 71% Black 14% Hispanic / Latino 9% Two or more races 8% Asian 2%
- Hispanic origin (detail)
- Mexican 3% Puerto Rican 3%
- Common ancestry
- Serbian 3% Slovak 2% Italian 2%
- Foreign-born
- 6% · Canada, Jamaica, Dominican Republic
- Languages at home
- 92% English-only · Spanish 6% Other Asian/Pacific 1% Other Indo-European 1%
Political lean MEDSL · Gaston
- 2024 margin
- Strong R (+25.0) · D 37.0% · R 62.1%
- 2008→2024 swing
- 0.0pp no change · 2008: -25.0pp · 2024: -25.0pp
- All cycles
- 2024: R+25.0 2020: R+27.8 2016: R+32.1 2012: R+25.6 2008: R+25.0
Not yet ingested
- Civics
- —
Market trends
- HPI YoY
- ▼ -141.08%
- Current HPI
- 245.2596
- Rent YoY
- ▲ 2.14%
- Metro
- Charlotte-Concord-Gastonia, NC-SC
- State GDP YoY
- ▲ 3.28%
- F500 in state
- 26
Industry mix (Fortune 500 HQ in NC)
| Industry | F500 HQs | Revenue |
|---|---|---|
| Financial Services | 2 | $213B |
|
||
| Retail | 2 | $95B |
|
||
| Industrial Conglomerate | 1 | $38B |
|
||
| Metals / Steel | 1 | $35B |
|
||
| Utilities | 1 | $30B |
|
||
| Industrial Machinery | 1 | $19B |
|
||
Price history
+587.4% since first listed2 events — show timeline
- 2026-06-12 Listed $299,000 CANOPYMLS as Distributed by MLS Grid
- 1982-11-01 Sold (Public Records) $43,500 Public Records
Property tax history
+79.0%/yrLatest (2025): $2,605 · +0.0% YoY. Source: county tax records.
Cash-flow waterfall
monthlySold comps — $/sqft
last 12 mo · ≤1 miLoading sold comps…