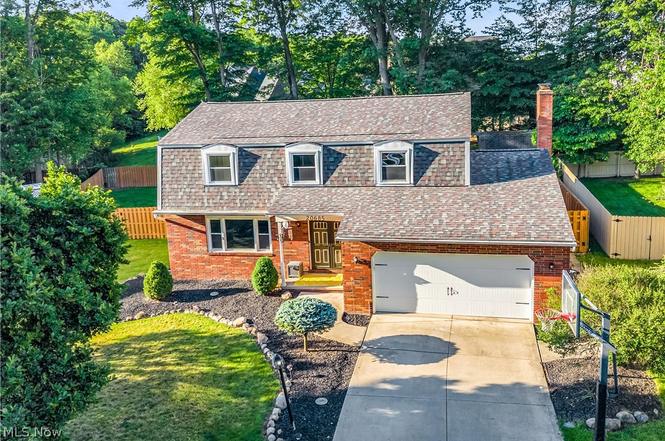
20685 Chestnut Dr · Strongsville, OH
Flood risk 1/10 · Minimal
- FEMA flood zone
- X (unshaded)
- Chance of flooding over 30 yrs
- 0.0%
- Est. flood insurance / yr
- $473 – $860
Fire risk 1/10 · Minimal
- Est. fire insurance / yr
- $713 – $1,323
Heat risk 3/10 · Minor
- Hot days now (above 96°F)
- 7 days/yr
- Hot days in 30 yrs
- 16 days/yr
Wind risk 1/10 · Minimal
- Chance of severe wind over 30 yrs
- —
Air-quality risk 2/10 · Minimal
- Unhealthy air days now
- 1 days/yr
- Unhealthy air days in 30 yrs
- 2 days/yr
Risk factors via First Street. Map © Google.
Why this score? — see what drove the F grade
The composite is a weighted blend of 9 inputs, each scored 0–100. Each bar is that input's sub-score; the figure is the points it added to the 100-point composite (weight × sub-score).
- Schools +6.7/10.0
- Cash flow +5.2/30.0
- Livability +4.4/5.0
- Rent growth +2.5/5.0
- Condition / age +2.5/5.0
- 1% rule +0.4/10.0
- DSCR +0.0/10.0
- ARV discount +0.0/15.0
- Appreciation +0.0/10.0
$469,000
🖨 Deal sheet 📄 Offer letter ✓ Due diligence
Listing remarks MLS
Looking for a completely remodeled colonial in a beautiful, private, low-traffic area of Strongsville? Look no further than this 4 bedroom, 2.5 bath home that sits on a secluded lot. Nearly all of the major components of this home have been replaced/redone. The gorgeous hardwood floors have been refinished, furnace was just replaced in 2018, a tankless water heater was installed in 2015, new windows in 2014, new driveway, roof was done in 2013, and the basement is finished!! This home is very convenient for entertaining with an open floor plan that features two separate living areas, a dining room, an open kitchen, AND a Florida room. In the Florida room you will find a wet-bar, a mini fridge, and a sliding glass door that opens to a stunning stone patio with a custom stone fireplace. All bedrooms are generous in size. The master has a walk in closet and an en-suite bath. This home truly leaves nothing to be desired and it simply won’t last. Call us immediately to schedule your private
Key facts
- Cozy gas fireplace
- Wet bar
- Updated kitchen
Tags
Property features AI
Exterior
- Parking: Attached 2-car garage
- Security: Security system installed
- Utilities: Public water; Public sewer
- Home design: Two-story home; Concrete perimeter foundation; Asphalt/fiberglass roof
- Construction: Concrete construction
- Exterior features: Garden; Private yard; Privacy vinyl fencing enclosing the backyard
Interior
- Kitchen: Granite counters; Eat-in kitchen; Range; Microwave; Dishwasher; Refrigerator
- Bedrooms: Total rooms: 8; Finished full basement (below grade finished area included)
- Bathrooms: 2 full bathrooms; 1 half bathroom; 1 main-level bathroom
- Heating & cooling: Forced air heating; Central air conditioning
- Interior features: Wet bar; Ceiling fans; Entrance foyer; Eat-in kitchen; Granite counters; Open floorplan; Bar
- Laundry & utility: Washer; Dryer
Neighborhood map
What this means for you Summary
Snapshot
- This is a 4-bed/2.5-bath single-family listed at $469k.
Deal economics
- At list price, monthly cash flow is $-1k ($-13k/yr) — negative.
- To cash-flow at today's rent, offer at most $282k (39.9% below list).
- To meet the 1% rule (rent ≥ 1% of price), the offer needs to be $255k (45.6% below list).
- Recommended offer: $255k (45.6% below list) — sets the bar for 1% rule.
Location & tenants
- Location reads 88/100 on livability (#27 in OH, #243 nationally) — a professional / high-income tenant draw. Strengths: schools A+, crime A+, amenities A+; Watch: commute F.
- Strongsville City (suburban): math 73% / reading 79% proficiency, ranked #62 of 656 in OH (top 10%) — strong family-tenant draw, lease renewals of 3-5y typical; only 15% free/reduced lunch — higher-income household profile.
- Market conditions: 116 active listings in the ZIP; 5 comparable units currently listed for rent nearby; rentals leasing fast (median 3d on market — plan ~1-2 weeks tenant-placement turnaround); high-income renter base; 1,441 units permitted in Cuyahoga County in 2024 (700 in 5+ unit buildings).
Forward outlook
- Local home prices are declining (-3.0%/yr); year-one equity from $3k of loan paydown is wiped out by about $14k of value loss. Plan a longer hold.
- Cuyahoga County population projected to shrink 8% by 2050 — rents likely to lag national; underwrite the cash flow, not the appreciation.
Negotiation context
- Only 4 days on market — expect competitive offers; lowballing is unlikely to land.
- 9 sale attempts since 24y ago with the ask held roughly flat each time — persistent listings suggest the price (not the market) is what's stuck; bring a comps-based counter.
- Current owner paid $238k; list at $469k implies a 97% gain — meaningful room to come down on a strong offer.
Questions for the listing agent
- What do current leases actually rent for vs. the listed asking? Can we see a recent rent roll and the last 12 months of T-12 income?
- Built in 1971 — when were the roof, HVAC, electrical panel, plumbing, and water heater last replaced?
- Is there a deadline driving the sale (1031 exchange, divorce, estate, relocation)? That informs how much negotiation room exists.
- Schools are A-rated — typically a magnet for longer-tenancy family renters. What's the average tenant stay here, and is there a school-zone premium baked into asking?
- The area grade is low — what's the realistic commute time and amenity access for the typical tenant pool here? Any planned neighborhood developments (good or bad) we should know about?
- What's the average days-on-market for RENTAL listings here right now (not sales)? A rising rental-DOM trend means longer vacancies and softer asking-rent achievability than the comps imply.
- What's the recent tenant-quality profile in this submarket — average credit score on applications, eviction rate, late-payment / NSF rate, and stable-employment percentage? A property-management company in the area should have these aggregated.
- How much new for-sale + rental construction is in the pipeline within 1–3 miles? Heavy new supply typically softens prices + rents 12–24 months out; constrained supply supports both.
Investment metrics
- 1% rule
- 0.54% ✗
- Cap rate
- 3.58%
- Cash-on-cash
- -9.68%
- DSCR
- 0.57
- GRM
- 15.3
CMA / ARV
- ARV (on-the-fly)
- $388,395
- Comps found
- 12
Show comp detail 12 sales within ~0.75 mi
| Address | Dist | Beds/Ba | Sqft | Sold | Price | $/sf | Match |
|---|---|---|---|---|---|---|---|
| 10020 Fair Rd | 0.16mi | 3/2.5 (-1) | 2,104 (+2%) | 4mo | $417,000 | $198 | 81 |
| 19825 Deer Run Ln | 0.35mi | 3/2.5 (-1) | 1,878 (-9%) | 2mo | $435,000 | $232 | 63 |
| 10024 Fair Rd | 0.16mi | 3/2.0 (-1) | 2,276 (+11%) | 8mo | $399,000 | $175 | 61 |
| 20771 Rudy Dr | 0.47mi | 4/2.5 | 2,280 (+11%) | 2mo | $430,000 | $189 | 59 |
| 21292 Creekside Dr | 0.55mi | 3/2.5 (-1) | 2,124 (+3%) | 8mo | $385,000 | $181 | 58 |
| 19338 Idlewood Trl | 0.61mi | 3/2.0 (-1) | 2,166 (+5%) | 1mo | $330,000 | $152 | 54 |
| 11179 Fawn Meadow Ln | 0.53mi | 3/2.0 (-1) | 2,178 (+6%) | 6mo | $405,000 | $186 | 53 |
| 21355 Hickory Branch Trl | 0.58mi | 3/2.0 (-1) | 2,170 (+6%) | 6mo | $465,000 | $214 | 51 |
| 19654 Tanbark Ln | 0.40mi | 3/2.5 (-1) | 1,828 (-11%) | 11mo | $360,000 | $197 | 49 |
| 11480 Blodgett Creek Trl | 0.46mi | 3/2.5 (-1) | 1,759 (-14%) | 12mo | $322,500 | $183 | 40 |
| 21359 Briar Bush Ln Ln | 0.74mi | 4/2.0 | 2,320 (+13%) | 4mo | $455,000 | $196 | 39 |
| 21520 Oak Bark Trl | 0.68mi | 3/2.5 (-1) | 2,292 (+12%) | 11mo | $340,000 | $148 | 35 |
Match score weights: distance 35% · size 25% · config 20% · recency 20%. Top-matched comps best support the ARV.
Projected returns pro-forma
-3.0% appreciation · 3.0% rent growth · sell at horizon
- IRR
- -33.7%
- Equity multiple
- -0.09×
- Total profit
- $-143,519
- Equity at exit
- $69,929
- IRR
- -41.8%
- Equity multiple
- -0.62×
- Total profit
- $-212,094
- Equity at exit
- $40,551
Cash invested: $131,320 (down + closing). Projections, not guarantees.
Landlord ↔ Tenant lean methodology
- Overall (STATE)
- 73 Landlord-Friendly
- State Ohio
- 73 Landlord-Friendly · R+6
- County
- — inherits STATE
- City
- — inherits STATE
ZIP-level market 44149
- Active inventory
- 116
- Price-to-rent
- 15.3×
Monthly cashflow live
- Estimated rent
- $2,551 medium interval (Pro) →
- Mortgage (P&I)
- −$2,459
- Tax from tax record
- −$420 /mo · $5,036/yr
- Insurance
- −$195
- HOA
- −$0
- Vacancy / Maint / Mgmt
- −$536
- Net cashflow
- $-1,059
Break-even live
UW: 25.0% down · 7.5% · 30yr · 1.5% tax · 5.0% vac · 8.0% maint · 8.0% mgmt
Financing live
Cash to close
- Down payment
- $117,250
- Closing costs
- $14,070
- Reserves months
- —
- Total cash needed
- —
Loan-product check · same deal, 3 products live
Conventional
25% down · 7.5% · 30yr
- Down + closing
- —
- Monthly P&I
- —
- Monthly cashflow
- —
- DSCR
- —
- Eligible?
- —
Personal DTI + credit; lowest rate.
DSCR
20% down · 8.5% · 30yr
- Down + closing
- —
- Monthly P&I
- —
- Monthly cashflow
- —
- DSCR
- —
- Eligible?
- —
No personal income docs; deal must DSCR.
Hard money
10% down · 12.0% · 12mo
- Down + closing
- —
- Monthly P&I
- —
- Monthly cashflow
- —
- DSCR
- —
- Eligible?
- —
Short-term bridge; refi at stabilization.
Rent comps 5 comps
| Address | Beds | Baths | Sqft | Rent | $/sqft | DOM | Units | Dist |
|---|---|---|---|---|---|---|---|---|
| 20368 Westwood Dr Strongsville, OH | 4.0 | 2.0 | 1864 | $2,400 | $1.29 | 3d | 1 | 1.02mi |
| 22410 Rock Creek Cir Strongsville, OH | 3.0 | 2.0 | 2103 | $2,400 | $1.14 | 1d | 1 | 1.11mi |
| 9790 Pebble Brook Ln Strongsville, OH | 3.0 | 2.0 | 2785 | $2,800 | $1.01 | 19d | 1 | 1.18mi |
| 13187 Yager Dr Strongsville, OH | 4.0 | 1.5 | 1850 | $2,700 | $1.46 | 3d | 1 | 1.19mi |
| 8040 Strongsville Blvd Unit 1496063P Strongsville, OH | 3.0 | 2.0 | 1980 | $8,055 | $4.07 | 21d | 1 | 1.41mi |
Listing history 5 events
-
2026-06-18days on market $469,000 Active 4 DOM
-
2026-06-17days on market $469,000 Active 3 DOM
-
2026-06-16days on market $469,000 Active 2 DOM
-
2026-06-15remarks 699-char remark
-
2026-06-15$469,000 Active 1 DOM
ⓘ Source: listings_history table (triggers on properties + properties_extension) + one-shot
backfill from property_details.listing_events for pre-trigger history.
Tax reassessment forecast OH · Partial reset (capped growth)
- Current annual tax
- $5,036 · $420/mo
- Projected year-2 tax
- $6,176 · $515/mo
- Expected delta
- +$1,140/yr (+$95/mo · 22.6%)
ⓘ Screening estimate from a state-policy table — verify with the county assessor before closing.
Climate risk First Street
- Flood 1/10 Low FEMA zone X (unshaded) · 0% chance over 30 yrs
- Wildfire 1/10 Low
- Heat 3/10 Moderate 7 d/yr ≥96°F today · 16 d/yr by 30 yrs out
- Wind 1/10 Low
- Air quality 2/10 Low 1 unhealthy d/yr today · 2 by 30 yrs out
Nearby sold comps map
Loading sold comps map…
Walkable amenities ~0.75 mi
Loading nearby amenities…
Taxation est. · year 1
- Rental income
- $30,615
- − Mortgage interest
- −$26,271
- − Property taxes
- −$5,036
- − Insurance
- −$2,345
- − Repairs & maintenance
- −$2,449
- − Management
- −$2,449
- − Depreciation
- −$13,644
- Taxable loss
- −$21,580
- Est. tax savings @ 24.0%
- +$5,179
- After-tax cash flow
- $-7,530/yr
For passive investors: Depreciation is non-cash, so a rental often shows a tax loss while cash-flowing — sheltering income. Rental losses are passive: they offset passive income freely, and up to $25,000/yr can offset ordinary (W-2) income if you actively participate and your MAGI is under $100k (phasing out to $0 by $150k); unused losses carry forward. On sale, claimed depreciation is recaptured at up to 25%, and gains may owe capital-gains tax (a 1031 exchange can defer both). Figures are a year-1 estimate at your 24.0% rate — not tax advice; consult a CPA.
Schools (NCES district)
- District
- Strongsville City
- NCES district ID
- 3904484
- Math proficiency
- 73% ▼ -10.00%
- Reading proficiency
- 79% ▼ -2.00%
- Median HH income
- $78,206
- Composite
- 67.02/100
- National rank
- #395
- State rank
- #62 of 656 in OH
Livability — Strongsville
- Score
- 88/100
- State rank
- #27
- US rank
- #243
Category grades
Schools grade is shown separately in the Schools card above.
Census & demographics
- Census place
- Strongsville, OH
- County
- Cuyahoga · 1,045,444 people
- City population
- 46,110
- Metro
- Cleveland, OH
- Population (ZIP)
- 21,042
- Household income
- $114,107
- Rent vs Own
- Severe rent burden
- 2.7
Population outlook (Cuyahoga County) Hauer SSP2
- Today (2025)
- 1,244,621 people
- By 2030
- 1,230,093 · -1.2%
- By 2040
- 1,189,108 · -4.5%
- By 2050
- 1,145,706 · -7.9%
- By 2075
- 1,076,557 · -13.5%
- By 2100
- 978,987 · -21.3%
Race, ethnicity, and origin ACS 2023
- Neighborhood character
- Predominantly White (91%)
- Race & ethnicity
- White 91% Asian 3% Two or more races 3% Hispanic / Latino 3% Black 1%
- Common ancestry
- Romanian 11% Italian 2% Slovak 2%
- Foreign-born
- 7% · Canada, China
- Languages at home
- 92% English-only · Other Indo-European 2% Arabic 1% Russian/Polish/Slavic 1%
Political lean MEDSL · Cuyahoga
- 2024 margin
- Solid D (+31.5) · D 65.4% · R 33.9%
- 2008→2024 swing
- -7.4pp toward R · 2008: 38.9pp · 2024: 31.5pp
- All cycles
- 2024: D+31.5 2020: D+34.1 2016: D+35.0 2012: D+38.7 2008: D+38.9
Not yet ingested
- Civics
- —
Market trends
- HPI YoY
- ▼ -238.17%
- Current HPI
- 196.9311
- Rent YoY
- —
- Metro
- —
- State GDP YoY
- ▲ 1.98%
- F500 in state
- 48
Industry mix (Fortune 500 HQ in OH)
| Industry | F500 HQs | Revenue |
|---|---|---|
| Insurance | 3 | $145B |
|
||
| Industrial Machinery | 3 | $49B |
|
||
| Financial Services | 3 | $24B |
|
||
| Consumer Goods | 2 | $93B |
|
||
| Aerospace / Defense | 2 | $47B |
|
||
| Utilities | 2 | $33B |
|
||
Price history
+135.8% since first listed22 events — show timeline
- 2026-06-12 Listed $469,000 MLSNOW
- 2018-09-04 Sold (Public Records) $238,000 Public Records
- 2018-09-04 Sold (MLS) $238,000 MLSNOW
- 2018-08-10 Pending — MLSNOW
- 2018-07-19 Contingent — MLSNOW
- 2018-07-13 Listed $229,000 MLSNOW
- 2010-12-30 Listing Removed — MLSNOW
- 2010-12-15 Sold (Public Records) $190,000 Public Records
- 2009-12-11 Listed $199,000 MLSNOW
- 2009-08-24 Sold (MLS) $96,000 MLSNOW
- 2009-06-16 Listed $105,900 MLSNOW
- 2004-05-03 Sold (MLS) $192,900 MLSNOW
- 2004-04-29 Sold (Public Records) $192,900 Public Records
- 2004-01-06 Listed $192,900 MLSNOW
- 2003-12-28 Listing Removed — MLSNOW
- 2003-07-01 Listed $198,800 MLSNOW
- 2003-03-24 Listing Removed — MLSNOW
- 2003-02-25 Listed $198,900 MLSNOW
- 2003-02-22 Listing Removed — MLSNOW
- 2002-12-22 Listed $198,900 MLSNOW
- 2002-12-21 Listing Removed — MLSNOW
- 2002-10-21 Listed $198,900 MLSNOW
Property tax history
+1.2%/yrLatest (2025): $5,036 · -0.0% YoY. Source: county tax records.
Cash-flow waterfall
monthlySold comps — $/sqft
last 12 mo · ≤1 miLoading sold comps…