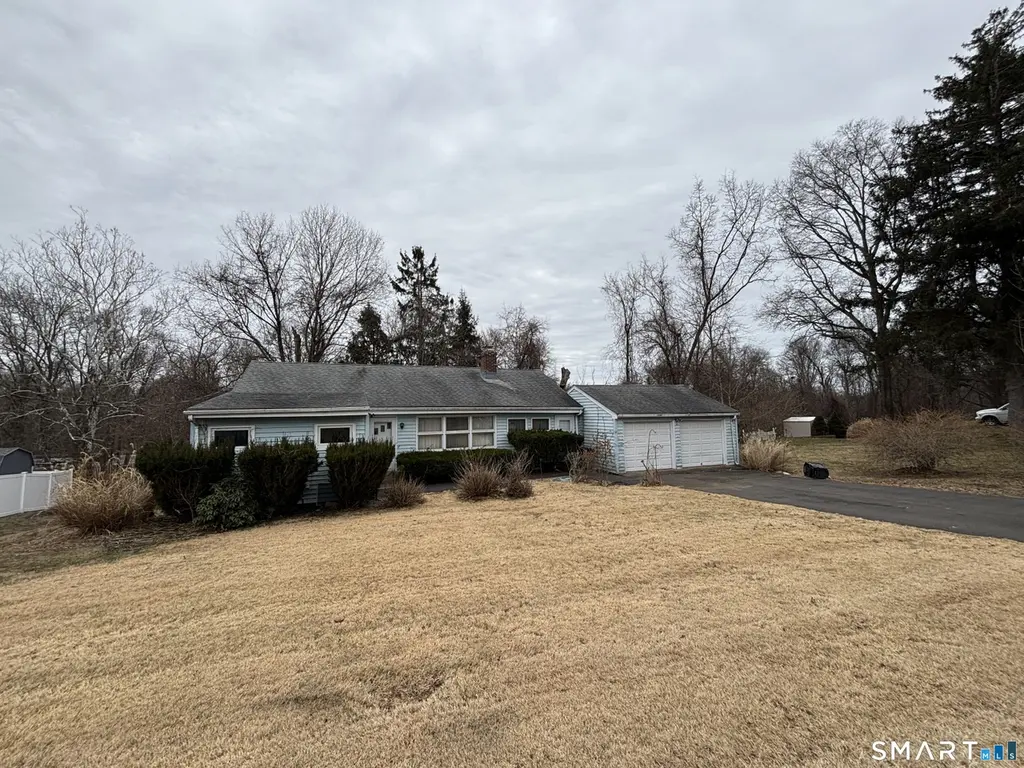
44 Upper State St · North Haven, CT
Flood risk No data
- FEMA flood zone
- —
- Chance of flooding over 30 yrs
- —
- Est. flood insurance / yr
- —
Fire risk No data
- Est. fire insurance / yr
- —
Heat risk No data
- Hot days now (above threshold)
- —
- Hot days in 30 yrs
- —
Wind risk No data
- Chance of severe wind over 30 yrs
- —
Air-quality risk No data
- Unhealthy air days now
- —
- Unhealthy air days in 30 yrs
- —
Risk factors via First Street. Map © Google.
Why this score? — see what drove the C+ grade
The composite is a weighted blend of 9 inputs, each scored 0–100. Each bar is that input's sub-score; the figure is the points it added to the 100-point composite (weight × sub-score).
- Cash flow +20.2/30.0
- ARV discount +15.0/15.0
- DSCR +6.4/10.0
- 1% rule +5.8/10.0
- Schools +5.2/10.0
- Livability +3.9/5.0
- Rent growth +2.5/5.0
- Condition / age +2.5/5.0
- Appreciation +0.0/10.0
$269,000
🖨 Deal sheet 📄 Offer letter ✓ Due diligence
Listing remarks
Opportunity at 44 Upper State Street in North Haven. This ranch-style home offers convenient one-level living with 3 bedrooms and 1 full bathroom. Very functional layout, this home features a 2-car attached garage with a mudroom entry. A full unfinished basement offers future finishing potential and includes a walkout to the backyard, opening up additional possibilities for expanded living space. Commuter-friendly location close to major highways. With strong comparable sales in the area, this is a great value-add property. Property is in need of repairs and strictly sold as-is. Contingent on probate approval.
Key facts
- Attached garage
- One-level living
- Unfinished basement
Tags
Property features AI
Exterior
- Utilities: Public water connected; Septic system
- Home design: Single-family home
- Construction: Frame construction; Concrete foundation
- Exterior features: Level lot; Vinyl siding; Asphalt shingle roof
Interior
- Kitchen: Refrigerator included
- Bedrooms: Three bedrooms
- Bathrooms: One full bathroom
- Heating & cooling: Hot air heating (oil fuel)
- Interior features: Full unfinished basement; Attic with access via hatch; One fireplace; Six total rooms
- Laundry & utility: Oil-fired hot air heating (fuel tank in basement)
Neighborhood map
What this means for you Summary
Snapshot
- This is a 3-bed/1.0-bath single-family listed at $269k.
Deal economics
- At list price, monthly cash flow is $338 ($4k/yr) — positive.
- The deal already cash-flows at list — no discount required.
- Meets the 1% rule at list price ($3k rent vs $269k).
- Recommended offer: $265k (1.5% below list) — sets the bar for market timing.
- Cap rate 7.8% vs local median 4.0% in North Haven — top-decile yield for the area; either an underpriced asset or a hidden risk that comps aren't pricing in. Stress-test before assuming the spread holds.
Location & tenants
- Location reads 78/100 on livability (#39 in CT, #2,723 nationally) — a middle-class / working-renter tenant base. Strengths: employment A+, housing A+, health & safety A+; Watch: amenities F, commute F, cost of living D-.
- North Haven School District (suburban): math 49% / reading 64% proficiency, ranked #55 of 153 in CT (top 36%) — acceptable for families but not a draw, mixed tenant base, ~2y average lease; only 8% free/reduced lunch — higher-income household profile.
- Market conditions: 77 active listings in the ZIP; 4 comparable units currently listed for rent nearby; rentals at typical pace (median 14d on market — plan ~3-4 weeks tenant-placement turnaround); 1,059 units permitted in South Central Connecticut Planning Region in 2024 (779 in 5+ unit buildings).
Forward outlook
- Local home prices are declining (-3.0%/yr); year-one equity from $2k of loan paydown is wiped out by about $8k of value loss. Plan a longer hold.
Negotiation context
- It's been on market 23 days — a 2% lower offer ($265k) is reasonable based on typical stale-listing flexibility.
- 2 sale attempts with the ask held roughly flat each time — persistent listings suggest the price (not the market) is what's stuck; bring a comps-based counter.
Risks & watch-outs
- Watch-outs: built in 1954 — expect roof / HVAC / electrical / plumbing capex.
Questions for the listing agent
- Built in 1954 — when were the roof, HVAC, electrical panel, plumbing, and water heater last replaced?
- Is there a deadline driving the sale (1031 exchange, divorce, estate, relocation)? That informs how much negotiation room exists.
- Schools are A-rated — typically a magnet for longer-tenancy family renters. What's the average tenant stay here, and is there a school-zone premium baked into asking?
- What's the average days-on-market for RENTAL listings here right now (not sales)? A rising rental-DOM trend means longer vacancies and softer asking-rent achievability than the comps imply.
- What's the recent tenant-quality profile in this submarket — average credit score on applications, eviction rate, late-payment / NSF rate, and stable-employment percentage? A property-management company in the area should have these aggregated.
- How much new for-sale + rental construction is in the pipeline within 1–3 miles? Heavy new supply typically softens prices + rents 12–24 months out; constrained supply supports both.
Investment metrics
- 1% rule
- 1.08% ✓
- Cap rate
- 7.80%
- Cash-on-cash
- 5.38%
- DSCR
- 1.24
- GRM
- 7.7
CMA / ARV
- ARV (on-the-fly)
- $441,180
- Comps found
- 3
Show comp detail 3 sales within ~0.75 mi
| Address | Dist | Beds/Ba | Sqft | Sold | Price | $/sf | Match |
|---|---|---|---|---|---|---|---|
| 15 Kings Hwy | 0.38mi | 2/1.0 (-1) | 1,314 (+2%) | 10mo | $418,000 | $318 | 66 |
| 113 Kings Hwy | 0.57mi | 2/1.0 (-1) | 1,248 (-3%) | 10mo | $460,000 | $369 | 54 |
| 25 Mansfield Rd | 0.45mi | 3/2.5 | 1,448 (+12%) | 21mo | $495,500 | $342 | 36 |
Match score weights: distance 35% · size 25% · config 20% · recency 20%. Top-matched comps best support the ARV.
Projected returns pro-forma
-3.0% appreciation · 3.0% rent growth · sell at horizon
- IRR
- -7.9%
- Equity multiple
- 0.71×
- Total profit
- $-21,973
- Equity at exit
- $40,109
- IRR
- 1.7%
- Equity multiple
- 1.12×
- Total profit
- $8,980
- Equity at exit
- $23,258
Cash invested: $75,320 (down + closing). Projections, not guarantees.
Landlord ↔ Tenant lean methodology
- Overall (STATE)
- 27 Tenant-Leaning
- State Connecticut
- 27 Tenant-Leaning · D+7
- County
- — inherits STATE
- City
- — inherits STATE
ZIP-level market 06473
- Active inventory
- 77
- Price-to-rent
- 7.7×
Monthly cashflow live
- Estimated rent
- $2,897 medium interval (Pro) →
- Mortgage (P&I)
- −$1,411
- Tax from tax record
- −$428 /mo · $5,141/yr
- Insurance
- −$112
- HOA
- −$0
- Vacancy / Maint / Mgmt
- −$608
- Net cashflow
- $338
Break-even live
UW: 25.0% down · 7.5% · 30yr · 1.5% tax · 5.0% vac · 8.0% maint · 8.0% mgmt
Financing live
Cash to close
- Down payment
- $67,250
- Closing costs
- $8,070
- Reserves months
- —
- Total cash needed
- —
Loan-product check · same deal, 3 products live
Conventional
25% down · 7.5% · 30yr
- Down + closing
- —
- Monthly P&I
- —
- Monthly cashflow
- —
- DSCR
- —
- Eligible?
- —
Personal DTI + credit; lowest rate.
DSCR
20% down · 8.5% · 30yr
- Down + closing
- —
- Monthly P&I
- —
- Monthly cashflow
- —
- DSCR
- —
- Eligible?
- —
No personal income docs; deal must DSCR.
Hard money
10% down · 12.0% · 12mo
- Down + closing
- —
- Monthly P&I
- —
- Monthly cashflow
- —
- DSCR
- —
- Eligible?
- —
Short-term bridge; refi at stabilization.
Rent comps 4 comps
| Address | Beds | Baths | Sqft | Rent | $/sqft | DOM | Units | Dist |
|---|---|---|---|---|---|---|---|---|
| 23 Maiden Ln North Haven, CT | 2.0 | 1.5 | 879 | $2,662 | $3.03 | 2d | 6 | 0.70mi |
| 100 Avalon Haven Dr North Haven, CT | 1.0–3.0 | 1.0–2.0 | 1009 | $3,000 | $2.97 | 14d | 5 | 0.73mi |
| 1400 Hartford Tpke #10 North Haven, CT | 3.0 | 2.0 | 1295 | $2,990 | $2.31 | 43d | 1 | 0.91mi |
| 1298 Hartford Tpke North Haven, CT | 2.0 | 2.0 | 1118 | $2,925 | $2.62 | 11d | 2 | 1.26mi |
Listing history 4 events
-
2026-04-14status Under Contract
-
2026-04-09status Active
-
2026-04-03status Under Contract
-
2026-03-16$269,000 Active
ⓘ Source: listings_history table (triggers on properties + properties_extension) + one-shot
backfill from property_details.listing_events for pre-trigger history.
Tax reassessment forecast CT · Partial reset (capped growth)
- Current annual tax
- $5,141 · $428/mo
- Projected year-2 tax
- $5,449 · $454/mo
- Expected delta
- +$308/yr (+$26/mo · 6.0%)
ⓘ Screening estimate from a state-policy table — verify with the county assessor before closing.
Nearby sold comps map
Loading sold comps map…
Walkable amenities ~0.75 mi
Loading nearby amenities…
Taxation est. · year 1
- Rental income
- $34,770
- − Mortgage interest
- −$15,068
- − Property taxes
- −$5,141
- − Insurance
- −$1,345
- − Repairs & maintenance
- −$2,782
- − Management
- −$2,782
- − Depreciation
- −$7,825
- Taxable loss
- −$173
- Est. tax savings @ 24.0%
- +$42
- After-tax cash flow
- $4,096/yr
For passive investors: Depreciation is non-cash, so a rental often shows a tax loss while cash-flowing — sheltering income. Rental losses are passive: they offset passive income freely, and up to $25,000/yr can offset ordinary (W-2) income if you actively participate and your MAGI is under $100k (phasing out to $0 by $150k); unused losses carry forward. On sale, claimed depreciation is recaptured at up to 25%, and gains may owe capital-gains tax (a 1031 exchange can defer both). Figures are a year-1 estimate at your 24.0% rate — not tax advice; consult a CPA.
Schools (NCES district)
- District
- North Haven School District
- NCES district ID
- 0903030
- Math proficiency
- 49% ▼ -12.00%
- Reading proficiency
- 64% ▼ -8.00%
- Median HH income
- $85,727
- Composite
- 51.53/100
- National rank
- #1714
- State rank
- #55 of 153 in CT
Livability — North Haven
- Score
- 78/100
- State rank
- #39
- US rank
- #2723
Category grades
Schools grade is shown separately in the Schools card above.
Census & demographics
- Census place
- North Haven, CT
- City population
- 24,527
- Population (ZIP)
- 24,527
Population outlook (South Central Connecticut County) Hauer SSP2
- By 2040
- 608,362
Race, ethnicity, and origin ACS 2023
- Neighborhood character
- Predominantly White (79%)
- Race & ethnicity
- White 79% Hispanic / Latino 7% Asian 7% Two or more races 6% Black 4%
- Hispanic origin (detail)
- Mexican 1% Puerto Rican 4%
- Common ancestry
- Romanian 7% Lithuanian 2% Scotch-Irish 1%
- Foreign-born
- 11% · China, South Korea, Canada
- Languages at home
- 86% English-only · Other Indo-European 4% Spanish 3% Chinese 2%
Political lean MEDSL · South Central Connecticut
- 2024 margin
- Strong D (+20.1) · D 59.0% · R 38.9% · Other 2.1%
- All cycles
- 2024: D+20.1
Not yet ingested
- Civics
- —
Market trends
- HPI YoY
- ▼ -294.57%
- Current HPI
- 168.0717
- Rent YoY
- —
- Metro
- —
- State GDP YoY
- ▲ 1.06%
- F500 in state
- 38
Industry mix (Fortune 500 HQ in CT)
| Industry | F500 HQs | Revenue |
|---|---|---|
| Industrial Machinery | 4 | $38B |
|
||
| Insurance | 3 | $71B |
|
||
| Financial Services | 2 | $25B |
|
||
| Transportation / Logistics | 2 | $18B |
|
||
| Healthcare | 1 | $247B |
|
||
| Telecommunications | 1 | $55B |
|
||
Price history
4 events — show timeline
- 2026-04-14 Pending — Smart MLS
- 2026-04-09 Relisted — Smart MLS
- 2026-04-03 Pending — Smart MLS
- 2026-03-16 Listed $269,000 Smart MLS
Property tax history
+0.5%/yrLatest (2023): $5,141 · +6.3% YoY. Source: county tax records.
Cash-flow waterfall
monthlySold comps — $/sqft
last 12 mo · ≤1 miLoading sold comps…