6532 Monterey Pt #202 · Vineyards, FL
Flood risk 4/10 · Minor
- FEMA flood zone
- X (unshaded)
- Chance of flooding over 30 yrs
- 0.13%
- Est. flood insurance / yr
- $507 – $1,088
Fire risk 1/10 · Minimal
- Est. fire insurance / yr
- $947 – $1,759
Heat risk 10/10 · Severe
- Hot days now (above 107°F)
- 7 days/yr
- Hot days in 30 yrs
- 31 days/yr
Wind risk 10/10 · Severe
- Chance of severe wind over 30 yrs
- 99.0%
Air-quality risk 2/10 · Minimal
- Unhealthy air days now
- 2 days/yr
- Unhealthy air days in 30 yrs
- 2 days/yr
Risk factors via First Street. Map © Google.
Why this score? — see what drove the C- grade
The composite is a weighted blend of 9 inputs, each scored 0–100. Each bar is that input's sub-score; the figure is the points it added to the 100-point composite (weight × sub-score).
- Cash flow +17.8/30.0
- ARV discount +7.5/15.0
- 1% rule +6.3/10.0
- DSCR +5.6/10.0
- Schools +5.0/10.0
- Condition / age +3.8/5.0
- Livability +3.2/5.0
- Rent growth +2.7/5.0
- Appreciation +0.0/10.0
$520,000
🖨 Deal sheet 📄 Offer letter ✓ Due diligence
Listing remarks
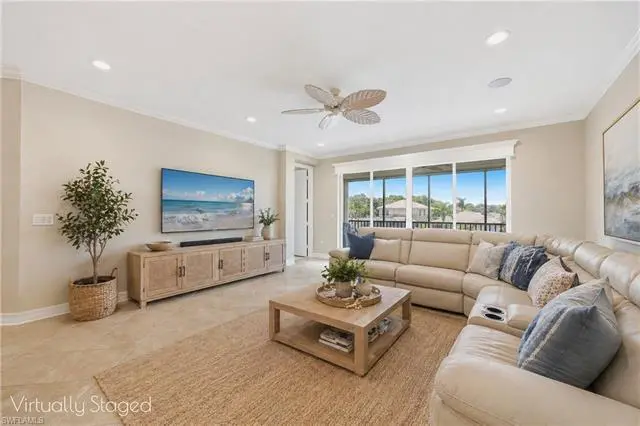
One or more photo(s) has been virtually staged, AI generated or rendered. Nestled in one of Naples’ most desirable communities, this stunning meticulously cared for 2 floor coach home harmoniously blends comfort, style, and the quintessential Florida lifestyle. With nearly 2,200 square feet of thoughtfully designed living space, residence is a testament to gracious living and meticulous attention to detail. Step inside to discover an open concept living and dining area that seamlessly blends, perfect for both entertaining and everyday living. The residence boasts elegant finishes that create a canvas for any style—whether your tastes are coastal, contemporary, or classic. The co
Key facts
- Resort style pools
- Open concept living
- Clubhouse
Tags
Property features AI
Other
- Other: Unit in a complex with 480 total units and 8 units in the building; 2 units per floor; 2 total floors in building; Possession at closing; Subdivision/Condo: Marbella Lakes
Finance
- HOA & community: Mandatory HOA; Master HOA fee $726 quarterly; Condo fee $1,072 quarterly; Total annual recurring fees $7,192; Total one-time fees $1,958; Professional management; Maintenance covers lawn/land, legal/accounting, recreation facilities, reserves, security, street lights, and street maintenance; Community amenities include clubhouse, community pool, spa/hot tub, exercise room, basketball, tennis, pickleball, play area, community park, BBQ/picnic area, and underground utilities; Community type: Gated with tennis
Exterior
- Parking: Attached 1-car garage
- Security: Gated community
- Utilities: Central water; Central sewer; Cable available
- Home design: Residential property; Low-rise (1–3) building; 2-story building; Rear exposure faces south; Located in Marbella Lakes
- Construction: Built in 2010; Concrete block and wood frame construction; Stucco exterior; Tile roof; Impact resistant windows
- Exterior features: Patio; Pond view; Central irrigation; Regular lot; Has freshwater waterfront
Interior
- Kitchen: Electric cooktop; Double oven; Self-cleaning oven; Microwave; Dishwasher; Disposal; Refrigerator / freezer; Refrigerator with icemaker
- Bedrooms: 3 bedrooms plus den
- Flooring: Carpet; Tile
- Bathrooms: 2 full bathrooms; 1 half bathroom; Master bath with dual sinks and separate tub and shower
- Heating & cooling: Central electric heat; Central electric cooling
- Interior features: Cable prewire; Foyer; High-speed internet available; Volume ceilings; Walk-in closet; Great room floor plan; Split bedroom layout; Screened balcony; Den (study); Dining (living); Laundry in residence; Unfurnished
- Laundry & utility: Washer; Dryer; Auto garage door
Neighborhood map
What this means for you Summary
Snapshot
- This is a 3-bed/2.5-bath condo listed at $520k. Condition is rated good.
Deal economics
- At list price, monthly cash flow is $432 ($5k/yr) — positive.
- The deal already cash-flows at list — no discount required.
- Meets the 1% rule at list price ($6k rent vs $520k).
- Recommended offer: $504k (3.0% below list) — sets the bar for market timing.
Location & tenants
- Location reads 64/100 on livability (#679 in FL) — a middle-class / working-renter tenant base. Strengths: crime A+, employment A+, housing A-; Watch: health & safety D, amenities F, commute F.
- Collier (suburban): math 60% / reading 56% proficiency, ranked #16 of 73 in FL (top 22%) — acceptable for families but not a draw, mixed tenant base, ~2y average lease.
- Market conditions: Rents flat; 329 active listings in the ZIP; 22 comparable units currently listed for rent nearby; rentals at typical pace (median 24d on market — plan ~3-4 weeks tenant-placement turnaround); solid renter incomes; 3,520 units permitted in Collier County in 2024 (959 in 5+ unit buildings).
- At $5,854/mo this rent would consume 76% of the median local household income ($92k/yr) (locally 780% of renters already pay >50% of income on rent) — very limited rent-growth headroom before tenants either downsize or default.
Forward outlook
- Local home prices are declining (-3.0%/yr); year-one equity from $4k of loan paydown is wiped out by about $16k of value loss. Plan a longer hold.
- Collier County population projected at +30% by 2050 — long-run rental-demand tailwind backs the buy-and-hold thesis.
Negotiation context
- It's been on market 49 days — a 3% lower offer ($504k) is reasonable based on typical stale-listing flexibility.
Risks & watch-outs
- Climate carrying-cost: severe wind risk, 99% chance of damaging wind over 30y; extreme-heat days projected 7→31/yr by 2055 (HVAC capex compounding) — expect insurance premiums to compound above CPI over the hold.
Questions for the listing agent
- It's been on market 49 days. Have you received any prior offers? Is the seller open to a 3% concession, seller financing, or rate buy-down credit?
- What does the HOA fee cover, when was the last increase, and are there any pending special assessments or reserve-fund shortfalls?
- Any open or pending special assessments — roof, HVAC, plumbing, elevator, façade? What's the per-unit balance and payoff schedule, and is the seller paying it off at close or rolling it to the buyer?
- Is there a deadline driving the sale (1031 exchange, divorce, estate, relocation)? That informs how much negotiation room exists.
- What's the average days-on-market for RENTAL listings here right now (not sales)? A rising rental-DOM trend means longer vacancies and softer asking-rent achievability than the comps imply.
- What's the recent tenant-quality profile in this submarket — average credit score on applications, eviction rate, late-payment / NSF rate, and stable-employment percentage? A property-management company in the area should have these aggregated.
- How much new apartment / multifamily construction is in the pipeline within 1–3 miles? Heavy new supply (>2% of stock underway) typically softens rents 12–24 months out; light construction supports rent growth.
Investment metrics
- 1% rule
- 1.13% ✓
- Cap rate
- 7.29%
- Cash-on-cash
- 3.56%
- DSCR
- 1.16
- GRM
- 7.4
CMA / ARV
No comps found within radius.
Projected returns pro-forma
-3.0% appreciation · 0.85% rent growth · sell at horizon
- IRR
- -13.4%
- Equity multiple
- 0.53×
- Total profit
- $-68,710
- Equity at exit
- $77,534
- IRR
- -8.8%
- Equity multiple
- 0.51×
- Total profit
- $-71,299
- Equity at exit
- $44,960
Cash invested: $145,600 (down + closing). Projections, not guarantees.
Landlord ↔ Tenant lean methodology
- Overall (STATE)
- 87 Strongly Landlord-Friendly
- State Florida
- 87 Strongly Landlord-Friendly · R+3
- County
- — inherits STATE
- City
- — inherits STATE
ZIP-level market 34105
- Home prices YoY
- -30.5%
- Rents YoY
- 0.8%
- Active inventory
- 329
- Price-to-rent
- 7.4×
Monthly cashflow live
- Estimated rent
- $5,854 high interval (Pro) →
- Mortgage (P&I)
- −$2,727
- Tax est. 1.5%
- −$650 /mo · $7,800/yr
- Insurance
- −$217
- HOA
- −$599
- Vacancy / Maint / Mgmt
- −$1,229
- Net cashflow
- $432
Break-even live
UW: 25.0% down · 7.5% · 30yr · 1.5% tax · 5.0% vac · 8.0% maint · 8.0% mgmt
Financing live
Cash to close
- Down payment
- $130,000
- Closing costs
- $15,600
- Reserves months
- —
- Total cash needed
- —
Loan-product check · same deal, 3 products live
Conventional
25% down · 7.5% · 30yr
- Down + closing
- —
- Monthly P&I
- —
- Monthly cashflow
- —
- DSCR
- —
- Eligible?
- —
Personal DTI + credit; lowest rate.
DSCR
20% down · 8.5% · 30yr
- Down + closing
- —
- Monthly P&I
- —
- Monthly cashflow
- —
- DSCR
- —
- Eligible?
- —
No personal income docs; deal must DSCR.
Hard money
10% down · 12.0% · 12mo
- Down + closing
- —
- Monthly P&I
- —
- Monthly cashflow
- —
- DSCR
- —
- Eligible?
- —
Short-term bridge; refi at stabilization.
Rent comps 22 comps
| Address | Beds | Baths | Sqft | Rent | $/sqft | DOM | Units | Dist |
|---|---|---|---|---|---|---|---|---|
| 6525 Monterey Pt Unit 203 Naples, FL | 3.0 | 2.5 | 2288 | $5,250 | $2.29 | 14d | 1 | 0.09mi |
| 6548 Monterey Pt Unit 204 Naples, FL | 3.0 | 2.5 | 2288 | $6,000 | $2.62 | 14d | 1 | 0.14mi |
| 6559 Monterey Pt Naples, FL | 3.0 | 2.0 | 2300 | $9,000 | $3.91 | 21d | 1 | 0.25mi |
| 6542 Marbella Dr Naples, FL | 3.0 | 2.5 | 2144 | $6,250 | $2.92 | 23d | 1 | 0.27mi |
| 836 Hampton Cir #171 Naples, FL | 3.0 | 2.5 | 1580 | $5,000 | $3.16 | 23d | 1 | 0.40mi |
| 836 Hampton Cir #171 Naples, FL | 3.0 | 2.5 | 1580 | $5,000 | $3.16 | 21d | 1 | 0.40mi |
| 12839 Carrington Cir Unit 8-102 Naples, FL | 3.0 | 2.0 | 2063 | $6,500 | $3.15 | 23d | 1 | 0.48mi |
| 6670 Marbella Ln Naples, FL | 3.0 | 3.0 | 2439 | $8,400 | $3.44 | 23d | 1 | 0.66mi |
| 1299 Verde Dr Unit 1503 Naples, FL | 3.0 | 2.0 | 1744 | $4,200 | $2.41 | 14d | 1 | 0.78mi |
| 1303 Verde Dr Unit 1603 Naples, FL | 3.0 | 2.0 | 1877 | $2,500 | $1.33 | 14d | 1 | 0.80mi |
| 1256 Carpazi Ct #502 Naples, FL | 3.0 | 2.0 | 1744 | $2,495 | $1.43 | 23d | 1 | 0.82mi |
| 1256 Carpazi Ct Unit 502 Naples, FL | 3.0 | 2.0 | 1744 | $2,495 | $1.43 | 14d | 1 | 0.82mi |
| 12667 Biscayne Ct Naples, FL | 4.0 | 3.5 | 2600 | $8,500 | $3.27 | 23d | 1 | 0.88mi |
| 13078 Pembroke Dr Naples, FL | 3.0 | 2.5 | 2024 | $6,500 | $3.21 | 23d | 1 | 0.98mi |
| 12885 Brynwood Way Naples, FL | 3.0 | 3.0 | 2489 | $10,000 | $4.02 | 23d | 1 | 1.01mi |
| 5858 Star Grass Ln Naples, FL | 4.0 | 2.0 | 2432 | $12,000 | $4.93 | 23d | 1 | 1.03mi |
| 12848 Brynwood Way Naples, FL | 4.0 | 2.5 | 2689 | $6,000 | $2.23 | 23d | 1 | 1.06mi |
| 12914 Brynwood Preserve Ln Naples, FL | 2.0 | 2.0 | 1720 | $7,000 | $4.07 | 23d | 1 | 1.06mi |
| 12902 Brynwood Preserve Ln Naples, FL | 3.0 | 3.0 | 2100 | $7,500 | $3.57 | 23d | 1 | 1.08mi |
| 4752 Stratford Ct #1404 Naples, FL | 3.0 | 3.0 | 2686 | $8,500 | $3.16 | 23d | 1 | 1.08mi |
| 12832 Brynwood Way Naples, FL | 3.0 | 2.0 | 1714 | $5,250 | $3.06 | 14d | 1 | 1.09mi |
| 4740 Stratford Ct #1603 Naples, FL | 3.0 | 3.0 | 2686 | $14,000 | $5.21 | 23d | 1 | 1.10mi |
HOA detail condo
- Monthly dues
- $599 · $7,188/yr
- Assessments
- None detected in remarks — confirm with the listing agent.
Listing history 14 events
-
2026-06-18days on market $520,000 Active 49 DOM
-
2026-06-17days on market $520,000 Active 48 DOM
-
2026-06-16days on market $520,000 Active 47 DOM
-
2026-06-15days on market $520,000 Active 46 DOM
-
2026-06-14days on market $520,000 Active 44 DOM
-
2026-06-10days on market $520,000 Active 41 DOM
-
2026-06-09days on market $520,000 Active 40 DOM
-
2026-06-08days on market $520,000 Active 39 DOM
-
2026-06-07days on market $520,000 Active 38 DOM
-
2026-06-03days on market $520,000 Active 34 DOM
-
2026-06-02days on market $520,000 Active 33 DOM
-
2026-06-01days on market $520,000 Active 32 DOM
-
2026-06-01remarks 687-char remark
-
2026-06-01$520,000 Active 31 DOM
ⓘ Source: listings_history table (triggers on properties + properties_extension) + one-shot
backfill from property_details.listing_events for pre-trigger history.
Climate risk First Street
- Flood 4/10 Moderate FEMA zone X (unshaded) · 13% chance over 30 yrs
- Wildfire 1/10 Low
- Heat 10/10 Extreme 7 d/yr ≥107°F today · 31 d/yr by 30 yrs out
- Wind 10/10 Extreme 99% chance of damaging wind over 30 yrs
- Air quality 2/10 Low 2 unhealthy d/yr today · 2 by 30 yrs out
Nearby sold comps map
Loading sold comps map…
Walkable amenities ~0.75 mi
Loading nearby amenities…
Taxation est. · year 1
- Rental income
- $70,242
- − Mortgage interest
- −$29,128
- − Property taxes
- −$7,800
- − Insurance
- −$2,600
- − Repairs & maintenance
- −$5,619
- − Management
- −$5,619
- − HOA
- −$7,188
- − Depreciation
- −$15,127
- Taxable loss
- −$2,840
- Est. tax savings @ 24.0%
- +$682
- After-tax cash flow
- $5,862/yr
For passive investors: Depreciation is non-cash, so a rental often shows a tax loss while cash-flowing — sheltering income. Rental losses are passive: they offset passive income freely, and up to $25,000/yr can offset ordinary (W-2) income if you actively participate and your MAGI is under $100k (phasing out to $0 by $150k); unused losses carry forward. On sale, claimed depreciation is recaptured at up to 25%, and gains may owe capital-gains tax (a 1031 exchange can defer both). Figures are a year-1 estimate at your 24.0% rate — not tax advice; consult a CPA.
Condition & rehab AI · 6 photos
This well-maintained, 2-story condo in a desirable Naples community offers a good balance of comfort and style. Minor repairs and updates to the ceiling fans and walls would enhance its curb appeal and value.
Repairs flagged
- Minor ceiling fans — Worn blades
- Minor ceiling lights — Worn fixtures
Value-add opportunities
- Both Paint interior walls — Enhances curb appeal and interior aesthetics
- Both Replace ceiling fans — Improves air circulation and aesthetics
- Both Deep clean tile flooring — Maintains cleanliness and appearance
Renovation cost estimate screening
| Repair item | Severity | Est. cost |
|---|---|---|
| ceiling fans · Worn blades | Minor | $500–3,000 |
| ceiling lights · Worn fixtures | Minor | $500–3,000 |
| Total estimated repair cost · 2 items | $1,000–6,000 |
Value-add ROI direction
- Both Paint interior walls — Enhances curb appeal and interior aesthetics ↑
- Both Replace ceiling fans — Improves air circulation and aesthetics ↑
- Both Deep clean tile flooring — Maintains cleanliness and appearance ↑
ⓘ Cost ranges are severity-bucket heuristics (US national rule-of-thumb). Get contractor quotes + a written scope before underwriting a rehab budget.
Schools (NCES district)
- District
- Collier
- NCES district ID
- 1200330
- Math proficiency
- 60% ▼ -4.00%
- Reading proficiency
- 56% ▼ -2.00%
- Median HH income
- $58,275
- Composite
- 50.23/100
- National rank
- #1892
- State rank
- #16 of 73 in FL
Livability — Vineyards
- Score
- 64/100
- State rank
- #679
- US rank
- #14101
Category grades
Schools grade is shown separately in the Schools card above.
Census & demographics
- County
- Collier County · 396,295 people
- Metro
- Naples-Marco Island, FL
- Population (ZIP)
- 15,441
- Household income
- $92,214
- Rent vs Own
- Severe rent burden
- 780.0
Population outlook (Collier County) Hauer SSP2
- Today (2025)
- 420,858 people
- By 2030
- 450,054 · +6.9%
- By 2040
- 502,232 · +19.3%
- By 2050
- 544,932 · +29.5%
- By 2075
- 627,203 · +49.0%
- By 2100
- 659,015 · +56.6%
Race, ethnicity, and origin ACS 2023
- Neighborhood character
- Predominantly White (79%)
- Race & ethnicity
- White 79% Hispanic / Latino 14% Two or more races 7% Asian 5%
- Hispanic origin (detail)
- Mexican 3% Puerto Rican 1% Cuban 3% Salvadoran 1%
- Common ancestry
- Romanian 3% Lithuanian 3% Italian 3%
- Foreign-born
- 22% · Canada, China, Jamaica
- Languages at home
- 77% English-only · Spanish 11% Other Indo-European 3% Russian/Polish/Slavic 3%
Political lean MEDSL · Collier
- 2024 margin
- Solid R (+33.1) · D 33.1% · R 66.2%
- 2008→2024 swing
- -10.6pp toward R · 2008: -22.5pp · 2024: -33.1pp
- All cycles
- 2024: R+33.1 2020: R+24.7 2016: R+26.0 2012: R+30.1 2008: R+22.5
Not yet ingested
- Civics
- —
Market trends
- HPI YoY
- ▼ -124.65%
- Current HPI
- 283.9084
- Rent YoY
- ▲ 0.85%
- Metro
- Naples-Marco Island, FL
- State GDP YoY
- ▲ 3.28%
- F500 in state
- 36
Industry mix (Fortune 500 HQ in FL)
| Industry | F500 HQs | Revenue |
|---|---|---|
| Industrial Technology | 2 | $29B |
|
||
| Insurance | 2 | $17B |
|
||
| Retail | 1 | $60B |
|
||
| Technology Distribution | 1 | $58B |
|
||
| Homebuilding | 1 | $35B |
|
||
| Technology Manufacturing | 1 | $35B |
|
||
Price history
1 event — show timeline
- 2026-04-30 Listed $520,000 NAPLESMLS
Cash-flow waterfall
monthlySold comps — $/sqft
last 12 mo · ≤1 miLoading sold comps…