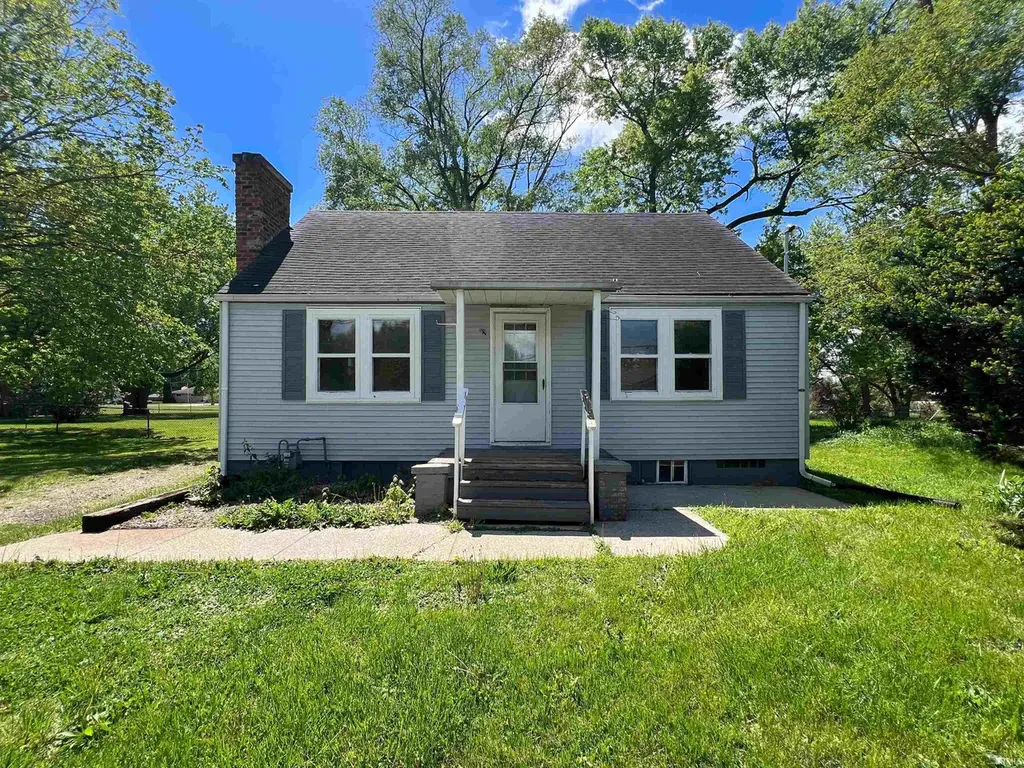
1503 E 21st St · Muncie, IN
Flood risk 1/10 · Minimal
- FEMA flood zone
- X (unshaded)
- Chance of flooding over 30 yrs
- 0.0%
- Est. flood insurance / yr
- $473 – $860
Fire risk 1/10 · Minimal
- Est. fire insurance / yr
- $717 – $1,331
Heat risk 3/10 · Minor
- Hot days now (above 101°F)
- 7 days/yr
- Hot days in 30 yrs
- 18 days/yr
Wind risk 2/10 · Minimal
- Chance of severe wind over 30 yrs
- 1.0%
Air-quality risk 3/10 · Minor
- Unhealthy air days now
- 2 days/yr
- Unhealthy air days in 30 yrs
- 3 days/yr
Risk factors via First Street. Map © Google.
Why this score? — see what drove the B grade
The composite is a weighted blend of 9 inputs, each scored 0–100. Each bar is that input's sub-score; the figure is the points it added to the 100-point composite (weight × sub-score).
- Cash flow +27.4/30.0
- ARV discount +14.2/15.0
- DSCR +9.5/10.0
- 1% rule +7.5/10.0
- Rent growth +4.0/5.0
- Livability +4.0/5.0
- Condition / age +2.5/5.0
- Schools +1.7/10.0
- Appreciation +0.0/10.0
$65,000
🖨 Deal sheet 📄 Offer letter ✓ Due diligence
Listing remarks MLS
Nice 2 bedroom 1 bath corner lot on the southside of town. Kitchen features lots of cabinets for storage, range and refrigerator stay. Large basement with utility as well as a nice sun room on the back of the house. Comes with 2 storage sheds out back.
Key facts
- Large eat-in kitchen
- Furnace replaced
- Spacious corner lot
Tags
Property features AI
Exterior
- Utilities: Public water; Public sewer
- Home design: Single-family site-built home; 1 story
- Construction: Vinyl siding; Block foundation
- Exterior features: Corner lot
Interior
- Kitchen: Electric range; Refrigerator
- Bedrooms: Total of 4 rooms (includes bedrooms and living spaces)
- Bathrooms: 1 full bathroom (main level)
- Heating & cooling: Natural gas forced-air heating; Central air conditioning
- Interior features: Refrigerator; Electric range; Gas water heater; Water heater; Full unfinished basement
- Laundry & utility: Laundry located in basement
Neighborhood map
What this means for you Summary
Snapshot
- This is a 2-bed/1.0-bath single-family listed at $65k.
Deal economics
- At list price, monthly cash flow is $189 ($2k/yr) — positive.
- The deal already cash-flows at list — no discount required.
- Meets the 1% rule at list price ($810 rent vs $65k).
- Recommended offer: $63k (3.0% below list) — sets the bar for market timing.
- Cap rate 9.8% vs local median 6.0% in Muncie — top-decile yield for the area; either an underpriced asset or a hidden risk that comps aren't pricing in. Stress-test before assuming the spread holds.
Location & tenants
- Location reads 80/100 on livability (#18 in IN, #1,654 nationally) — a professional / high-income tenant draw. Strengths: amenities A+, commute A+, cost of living A+; Watch: crime F, employment F.
- Muncie Community Schools (urban): math 18% / reading 25% proficiency, ranked #275 of 301 in IN (top 91%) — low school quality limits family demand, transient renter base, plan for 1-2y turnover; 68% free/reduced lunch — lower-income household profile, screen leases tightly.
- Zoned schools: Grissom Elementary School (math 8% / reading 8%, grade F, #949 of 994 statewide, top 97%, 450 students, 85% FRL); Southside Middle School (math 7% / reading 15%, grade F, #312 of 330 statewide, top 95%, 443 students, 85% FRL) — zoned schools average 85% FRL vs 68% district-wide (17 pts higher); higher-poverty schools than district average — tighter screening recommended.
- Zoned-school proficiency averages 9% at this address vs 22% district-wide (-12 pts) — the specific schools serving this property underperform the Muncie Community Schools average; the district grade overstates school quality for this exact location.
- Market conditions: Rents rising fast (+6.1%/yr); 148 active listings in the ZIP; 10 comparable units currently listed for rent nearby; rentals lingering (median 44d on market — plan ~5-8 weeks vacancy on turnover, expect pricing pressure); 100% of comp listings sitting > 30 days — soft ceiling on asking rent; 171 units permitted in Delaware County in 2024 (57 in 5+ unit buildings).
Forward outlook
- Local home prices are declining (-3.0%/yr); year-one equity from $449 of loan paydown is wiped out by about $2k of value loss. Plan a longer hold.
- Delaware County population projected at -11% by 2050 — secular population decline; favor cash flow + early exit over multi-decade hold.
- At projected returns (-3.0% appreciation + 6.1% rent growth), your $18k cash investment doubles in ~8 years — after that, you're playing with house money.
Negotiation context
- It's been on market 45 days — a 3% lower offer ($63k) is reasonable based on typical stale-listing flexibility.
- 3 sale attempts since 20y ago; this cycle's ask has dropped $5k (7%) from the opening price — seller is motivated, your offer sets the floor, not the list.
- Current owner paid $50k; 30% above their basis — modest negotiation headroom, anchor on the comps not their cost.
Risks & watch-outs
- Watch-outs: built in 1940 — expect roof / HVAC / electrical / plumbing capex.
Questions for the listing agent
- It's been on market 45 days. Have you received any prior offers? Is the seller open to a 3% concession, seller financing, or rate buy-down credit?
- Built in 1940 — when were the roof, HVAC, electrical panel, plumbing, and water heater last replaced?
- Is there a deadline driving the sale (1031 exchange, divorce, estate, relocation)? That informs how much negotiation room exists.
- Schools are D-rated, which usually means shorter tenancies and higher turnover. Who's the typical renter profile here, and what's been the actual vacancy rate?
- Crime grade is F in this area — have there been break-ins, vandalism, or insurance claims at this property in the last 3 years? What carrier currently insures it and at what premium?
- What's the average days-on-market for RENTAL listings here right now (not sales)? A rising rental-DOM trend means longer vacancies and softer asking-rent achievability than the comps imply.
- What's the recent tenant-quality profile in this submarket — average credit score on applications, eviction rate, late-payment / NSF rate, and stable-employment percentage? A property-management company in the area should have these aggregated.
- How much new for-sale + rental construction is in the pipeline within 1–3 miles? Heavy new supply typically softens prices + rents 12–24 months out; constrained supply supports both.
Investment metrics
- 1% rule
- 1.25% ✓
- Cap rate
- 9.78%
- Cash-on-cash
- 12.47%
- DSCR
- 1.55
- GRM
- 6.7
CMA / ARV
- ARV (median comp)
- $76,421
- List price
- $65,000
- Delta
- -14.94%
- Verdict
- UNDERPRICED
- Comps
- 20 within 1.0 mi
Show comp detail 12 sales within ~0.75 mi
| Address | Dist | Beds/Ba | Sqft | Sold | Price | $/sf | Match |
|---|---|---|---|---|---|---|---|
| 1400 E 24th St | 0.23mi | 2/1.0 | 680 (-6%) | 4mo | $18,000 | $26 | 76 |
| 1727 E 24th St | 0.27mi | 2/1.0 | 768 (+7%) | 1mo | $85,000 | $111 | 75 |
| 2911 S Hackley St | 0.44mi | 2/1.0 | 728 (+1%) | 5mo | $62,500 | $86 | 74 |
| 2115 S Grant St | 0.49mi | 2/1.0 | 700 (-3%) | 7mo | $87,000 | $124 | 67 |
| 1904 E Greenlawn Ct | 0.42mi | 2/1.0 | 768 (+7%) | 4mo | $103,000 | $134 | 67 |
| 2101 S Pershing Dr | 0.67mi | 2/1.0 | 725 (+1%) | 1mo | $53,000 | $73 | 66 |
| 3404 S Grant St | 0.52mi | 2/1.0 | 774 (+8%) | 1mo | $80,000 | $103 | 62 |
| 2312 S Pershing St | 0.55mi | 2/1.0 | 672 (-7%) | 4mo | $79,000 | $118 | 60 |
| 3506 S Penn St | 0.60mi | 2/1.0 | 792 (+10%) | 1mo | $121,000 | $153 | 54 |
| 2806 S Sycamore Ave | 0.50mi | 2/1.0 | 816 (+13%) | 2mo | $120,000 | $147 | 52 |
| 2815 S Elm St | 0.74mi | 2/1.0 | 672 (-7%) | 3mo | $67,900 | $101 | 52 |
| 2920 S Vine St | 0.54mi | 1/1.0 (-1) | 624 (-13%) | 4mo | $50,900 | $82 | 44 |
Match score weights: distance 35% · size 25% · config 20% · recency 20%. Top-matched comps best support the ARV.
Projected returns pro-forma
-3.0% appreciation · 6.11% rent growth · sell at horizon
- IRR
- 5.7%
- Equity multiple
- 1.23×
- Total profit
- $4,139
- Equity at exit
- $9,692
- IRR
- 17.7%
- Equity multiple
- 2.68×
- Total profit
- $30,596
- Equity at exit
- $5,620
Cash invested: $18,200 (down + closing). Projections, not guarantees.
Landlord ↔ Tenant lean methodology
- Overall (STATE)
- 90 Strongly Landlord-Friendly
- State Indiana
- 90 Strongly Landlord-Friendly · R+11
- County
- — inherits STATE
- City
- — inherits STATE
ZIP-level market 47302
- Home prices YoY
- -12.6%
- Rents YoY
- 6.1%
- Active inventory
- 148
- Price-to-rent
- 6.7×
Monthly cashflow live
- Estimated rent
- $810 high interval (Pro) →
- Mortgage (P&I)
- −$341
- Tax from tax record
- −$82 /mo · $990/yr
- Insurance
- −$27
- HOA
- −$0
- Vacancy / Maint / Mgmt
- −$170
- Net cashflow
- $189
Break-even live
UW: 25.0% down · 7.5% · 30yr · 1.5% tax · 5.0% vac · 8.0% maint · 8.0% mgmt
Financing live
Cash to close
- Down payment
- $16,250
- Closing costs
- $1,950
- Reserves months
- —
- Total cash needed
- —
Loan-product check · same deal, 3 products live
Conventional
25% down · 7.5% · 30yr
- Down + closing
- —
- Monthly P&I
- —
- Monthly cashflow
- —
- DSCR
- —
- Eligible?
- —
Personal DTI + credit; lowest rate.
DSCR
20% down · 8.5% · 30yr
- Down + closing
- —
- Monthly P&I
- —
- Monthly cashflow
- —
- DSCR
- —
- Eligible?
- —
No personal income docs; deal must DSCR.
Hard money
10% down · 12.0% · 12mo
- Down + closing
- —
- Monthly P&I
- —
- Monthly cashflow
- —
- DSCR
- —
- Eligible?
- —
Short-term bridge; refi at stabilization.
Rent comps 10 comps
| Address | Beds | Baths | Sqft | Rent | $/sqft | DOM | Units | Dist |
|---|---|---|---|---|---|---|---|---|
| 2011 E 18th St Muncie, IN | 2.0 | 1.0 | 470 | $725 | $1.54 | 44d | 1 | 0.37mi |
| 1901 E 26th St Unit 5 Muncie, IN | 2.0 | 1.0 | 600 | $865 | $1.44 | 44d | 1 | 0.45mi |
| 1311 E 11th St Unit 2 Muncie, IN | 1.0 | 1.0 | 672 | $715 | $1.06 | 44d | 1 | 0.70mi |
| 2815 S Elm St Muncie, IN | 2.0 | 1.0 | 672 | $875 | $1.30 | 44d | 1 | 0.75mi |
| 1307 S Ebright St Unit 2 Muncie, IN | 1.0 | 1.0 | 630 | $695 | $1.10 | 44d | 1 | 1.09mi |
| 301 W 13th St Muncie, IN | 1.0–2.0 | 1.0 | 725 | $844 | $1.16 | 44d | 1 | 1.20mi |
| 219 W Memorial Dr Muncie, IN | 1.0 | 1.0 | 450 | $600 | $1.33 | 44d | 1 | 1.20mi |
| 1521 E Kirby Ave Muncie, IN | 2.0–4.0 | 1.0–2.0 | 972 | $800 | $0.82 | 44d | 2 | 1.33mi |
| 415 W 9th St Muncie, IN | 2.0 | 1.0 | 705 | $925 | $1.31 | 44d | 1 | 1.41mi |
| 421 W 9th St Muncie, IN | 1.0 | 1.0 | 672 | $525 | $0.78 | 44d | 1 | 1.41mi |
Listing history 19 events
-
2026-06-15status $65,000 Pending 45 DOM
-
2026-06-15days on market $65,000 Active 45 DOM
-
2026-06-14days on market $65,000 Active 43 DOM
-
2026-06-13days on market $65,000 Active 42 DOM
-
2026-06-10days on market $65,000 Active 40 DOM
-
2026-06-09days on market $65,000 Active 39 DOM
-
2026-06-08days on market $65,000 Active 38 DOM
-
2026-06-07days on market $65,000 Active 37 DOM
-
2026-06-05days on market $65,000 Active 34 DOM
-
2026-06-03days on market $65,000 Active 33 DOM
-
2026-06-02days on market $65,000 Active 32 DOM
-
2026-06-01days on market $65,000 Active 31 DOM
-
2026-05-31days on market $65,000 Active 30 DOM
-
2026-05-30days on market $65,000 Active 29 DOM
-
2026-05-01$70,000 Active 302-char remark
-
2022-05-10soldstatus $50,000 252-char remark
Show marketing remark (252 chars)
Nice 2 bedroom 1 bath corner lot on the southside of town. Kitchen features lots of cabinets for storage, range and refrigerator stay. Large basement with utility as well as a nice sun room on the back of the house. Comes with 2 storage sheds out back.
-
2022-04-08$54,500 252-char remark
Show marketing remark (252 chars)
Nice 2 bedroom 1 bath corner lot on the southside of town. Kitchen features lots of cabinets for storage, range and refrigerator stay. Large basement with utility as well as a nice sun room on the back of the house. Comes with 2 storage sheds out back.
-
2006-10-11soldstatus $20,000
Show marketing remark (213 chars)
2 BR 'FIXER UPPER' BUNGALOW ON A LARGE CORNER LOT. POTENTIAL TO BE A CHARMING HOME. THIS BEING SOLD 'AS-IS' BY A BANKRUPTCY TRUSTEE WHO HAS NO INFO ON IT'S CONDITION. ** NO DISCLOSURES ** GARAGE IS A UTILITY SHED.
-
2006-08-11$29,900
Show marketing remark (213 chars)
2 BR 'FIXER UPPER' BUNGALOW ON A LARGE CORNER LOT. POTENTIAL TO BE A CHARMING HOME. THIS BEING SOLD 'AS-IS' BY A BANKRUPTCY TRUSTEE WHO HAS NO INFO ON IT'S CONDITION. ** NO DISCLOSURES ** GARAGE IS A UTILITY SHED.
ⓘ Source: listings_history table (triggers on properties + properties_extension) + one-shot
backfill from property_details.listing_events for pre-trigger history.
Tax reassessment forecast IN · Partial reset (capped growth)
- Current annual tax
- $990 · $82/mo
- Projected year-2 tax
- $990 · $82/mo
- Expected delta
- $0/yr ($0/mo · 0.0%)
ⓘ Screening estimate from a state-policy table — verify with the county assessor before closing.
Climate risk First Street
- Flood 1/10 Low FEMA zone X (unshaded) · 0% chance over 30 yrs
- Wildfire 1/10 Low
- Heat 3/10 Moderate 7 d/yr ≥101°F today · 18 d/yr by 30 yrs out
- Wind 2/10 Low 100% chance of damaging wind over 30 yrs
- Air quality 3/10 Moderate 2 unhealthy d/yr today · 3 by 30 yrs out
Nearby sold comps map
Loading sold comps map…
Walkable amenities ~0.75 mi
Loading nearby amenities…
Taxation est. · year 1
- Rental income
- $9,715
- − Mortgage interest
- −$3,641
- − Property taxes
- −$990
- − Insurance
- −$325
- − Repairs & maintenance
- −$777
- − Management
- −$777
- − Depreciation
- −$1,891
- Taxable income
- $1,314
- Est. tax owed @ 24.0%
- −$315
- After-tax cash flow
- $1,954/yr
For passive investors: Depreciation is non-cash, so a rental often shows a tax loss while cash-flowing — sheltering income. Rental losses are passive: they offset passive income freely, and up to $25,000/yr can offset ordinary (W-2) income if you actively participate and your MAGI is under $100k (phasing out to $0 by $150k); unused losses carry forward. On sale, claimed depreciation is recaptured at up to 25%, and gains may owe capital-gains tax (a 1031 exchange can defer both). Figures are a year-1 estimate at your 24.0% rate — not tax advice; consult a CPA.
Schools (NCES district)
- District
- Muncie Community Schools
- NCES district ID
- 1807320
- Math proficiency
- 18% ▼ -9.00%
- Reading proficiency
- 25% ▼ -4.00%
- Median HH income
- $30,052
- Composite
- 17.22/100
- National rank
- #9099
- State rank
- #275 of 301 in IN
Livability — Muncie
- Score
- 80/100
- State rank
- #18
- US rank
- #1654
Category grades
Schools grade is shown separately in the Schools card above.
Census & demographics
- Census place
- Muncie, IN
- County
- Delaware County · 84,658 people
- City population
- 84,658
- Metro
- Muncie, IN
- Population (ZIP)
- 25,473
- Household income
- $47,837
- Rent vs Own
- Severe rent burden
- 1150.0
Population outlook (Delaware County) Hauer SSP2
- Today (2025)
- 113,036 people
- By 2030
- 111,313 · -1.5%
- By 2040
- 106,432 · -5.8%
- By 2050
- 100,747 · -10.9%
- By 2075
- 91,000 · -19.5%
- By 2100
- 80,687 · -28.6%
Race, ethnicity, and origin ACS 2023
- Neighborhood character
- Predominantly White (84%)
- Race & ethnicity
- White 84% Two or more races 6% Black 6% Hispanic / Latino 4%
- Common ancestry
- Italian 2% Slovak 1% Romanian 1%
- Foreign-born
- 1% · Canada
- Languages at home
- 98% English-only · Spanish 1% German/W. Germanic 1%
Political lean MEDSL · Delaware
- 2024 margin
- R (+15.8) · D 41.2% · R 57.0% · Other 1.8%
- 2008→2024 swing
- -30.8pp toward R · 2008: 15.0pp · 2024: -15.8pp
- All cycles
- 2024: R+15.8 2020: R+13.2 2016: R+13.7 2012: D+3.1 2008: D+15.0
Not yet ingested
- Civics
- —
Market trends
- HPI YoY
- ▼ -30.32%
- Current HPI
- 210.431
- Rent YoY
- ▲ 6.11%
- Metro
- Muncie, IN
- State GDP YoY
- ▲ 2.90%
- F500 in state
- 18
Industry mix (Fortune 500 HQ in IN)
| Industry | F500 HQs | Revenue |
|---|---|---|
| Industrial Machinery | 2 | $37B |
|
||
| Healthcare | 1 | $177B |
|
||
| Pharmaceuticals | 1 | $45B |
|
||
| Metals / Steel | 1 | $18B |
|
||
| Agriculture | 1 | $17B |
|
||
| Packaging | 1 | $12B |
|
||
Price history
+117.4% since first listed7 events — show timeline
- 2026-06-15 Pending — IRMLS
- 2026-05-19 Price Changed $65,000 IRMLS
- 2026-05-01 Listed $70,000 IRMLS
- 2022-05-10 Sold (MLS) $50,000 IRMLS
- 2022-04-08 Listed $54,500 IRMLS
- 2006-10-11 Sold (MLS) $20,000 MIBOR as Distributed by MLS Grid
- 2006-08-11 Listed $29,900 MIBOR as Distributed by MLS Grid
Property tax history
-6.0%/yrLatest (2024): $990 · -1.3% YoY. Source: county tax records.
Cash-flow waterfall
monthlySold comps — $/sqft
last 12 mo · ≤1 miLoading sold comps…