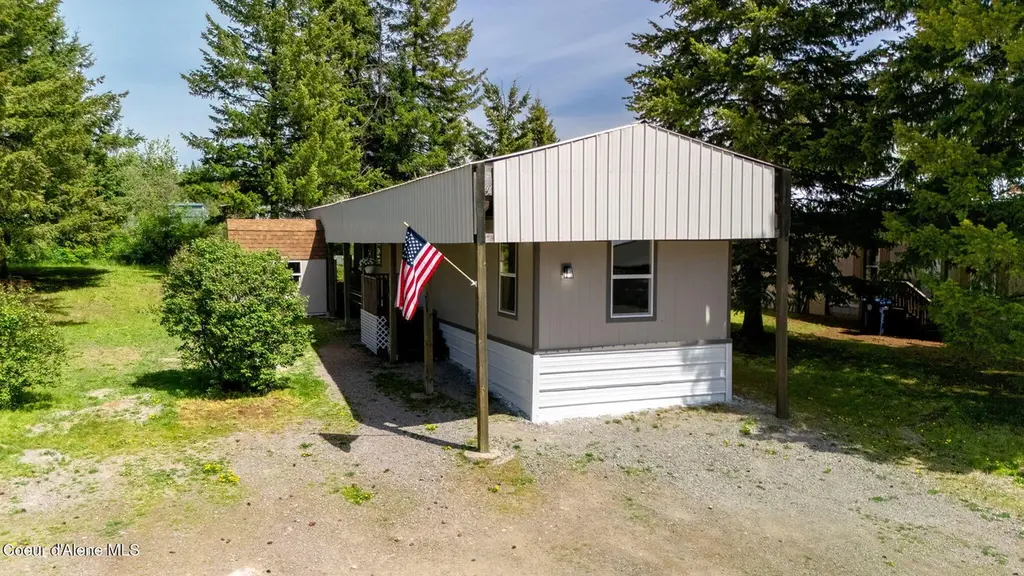
28128 N Highway 41 Trlr 40 · Spirit Lake, ID
Flood risk 1/10 · Minimal
- FEMA flood zone
- X (unshaded)
- Chance of flooding over 30 yrs
- 0.0%
- Est. flood insurance / yr
- $507 – $1,088
Fire risk 5/10 · Moderate
- Est. fire insurance / yr
- $584 – $1,086
Heat risk 2/10 · Minimal
- Hot days now (above 90°F)
- 7 days/yr
- Hot days in 30 yrs
- 15 days/yr
Wind risk 1/10 · Minimal
- Chance of severe wind over 30 yrs
- —
Air-quality risk 9/10 · Severe
- Unhealthy air days now
- 16 days/yr
- Unhealthy air days in 30 yrs
- 20 days/yr
Risk factors via First Street. Map © Google.
Why this score? — see what drove the D grade
The composite is a weighted blend of 9 inputs, each scored 0–100. Each bar is that input's sub-score; the figure is the points it added to the 100-point composite (weight × sub-score).
- Cash flow +12.4/30.0
- ARV discount +7.3/15.0
- Schools +4.2/10.0
- Condition / age +4.0/5.0
- DSCR +3.7/10.0
- 1% rule +3.5/10.0
- Livability +3.3/5.0
- Rent growth +2.5/5.0
- Appreciation +0.0/10.0
$130,000
🖨 Deal sheet (PDF) 📄 Offer letter ✓ Due diligence
Listing remarks
Completely Remodeled & Move-In Ready! Welcome to this beautifully updated 3-bedroom, 2-bath home offering just under 1,000 sq ft of modern comfort and style--all on leased land for an affordable, low-maintenance lifestyle. Head inside and fall in love with the fresh, clean feel throughout. Gorgeous LVP flooring flows seamlessly through the home, creating both durability and a high-end look. The fully refreshed kitchen shines with stainless steel appliances, sleek finishes, and a layout that makes everyday living and entertaining easy. The thoughtful remodel continues into both bathrooms and all three bedrooms, giving you a space that feels updated, functional, and truly move-in rea
Key facts
- Remodeled
- Storage shed
- Updated kitchen
Tags
Property features AI
Exterior
- Parking: Driveway access
- Utilities: Shared well water; Shared septic
- Home design: Mobile home; Single-story
- Construction: T1-11 siding; Metal roof; Pillar/post/pier foundation; Built as a manufactured/mobile structure
- Exterior features: Level lot; Located on a cul-de-sac; Shed(s) on property; Gravel road access
Interior
- Kitchen: Electric range; Microwave; Dishwasher; Refrigerator
- Bedrooms: 3 main-level bedrooms
- Flooring: LVP
- Bathrooms: 2 main-level bathrooms
- Heating & cooling: Electric heating; Forced air furnace
- Interior features: Disposal; Crawl space (no finished basement)
- Laundry & utility: Washer; Electric dryer; Electric water heater
Neighborhood map
What this means for you Summary
Snapshot
- This is a 3-bed/2.0-bath single-family listed at $130k. Condition is rated good.
Deal economics
- At list price, monthly cash flow is $-21 ($-250/yr) — negative.
- To cash-flow at today's rent, offer at most $127k (2.3% below list).
- To meet the 1% rule (rent ≥ 1% of price), the offer needs to be $111k (14.5% below list).
- Recommended offer: $111k (14.5% below list) — sets the bar for 1% rule.
- Cap rate 6.1% vs local median 0.1% in Spirit Lake — top-decile yield for the area; either an underpriced asset or a hidden risk that comps aren't pricing in. Stress-test before assuming the spread holds.
Location & tenants
- Location reads 66/100 on livability (#114 in ID) — a middle-class / working-renter tenant base. Strengths: housing A+, cost of living A, crime A-; Watch: schools C-, employment D+, amenities F.
- Lakeland District (rural): math 41% / reading 57% proficiency, ranked #34 of 92 in ID (top 37%) — families likely to look elsewhere, expect single-tenant / working-renter base with shorter leases.
- Market conditions: 104 active listings in the ZIP; 1,606 units permitted in Kootenai County in 2024 (154 in 5+ unit buildings).
Forward outlook
- Local home prices are declining (-3.0%/yr); year-one equity from $899 of loan paydown is wiped out by about $4k of value loss. Plan a longer hold.
- Kootenai County population projected at +33% by 2050 — long-run rental-demand tailwind backs the buy-and-hold thesis.
Negotiation context
- It's been on market 41 days — a 3% lower offer ($126k) is reasonable based on typical stale-listing flexibility.
Risks & watch-outs
- Climate carrying-cost: moderate wildfire risk — expect insurance premiums to compound above CPI over the hold.
Questions for the listing agent
- What do current leases actually rent for vs. the listed asking? Can we see a recent rent roll and the last 12 months of T-12 income?
- It's been on market 41 days. Have you received any prior offers? Is the seller open to a 15% concession, seller financing, or rate buy-down credit?
- Built in 1976 — when were the roof, HVAC, electrical panel, plumbing, and water heater last replaced?
- Is there a deadline driving the sale (1031 exchange, divorce, estate, relocation)? That informs how much negotiation room exists.
- The area grade is low — what's the realistic commute time and amenity access for the typical tenant pool here? Any planned neighborhood developments (good or bad) we should know about?
- What's the average days-on-market for RENTAL listings here right now (not sales)? A rising rental-DOM trend means longer vacancies and softer asking-rent achievability than the comps imply.
- What's the recent tenant-quality profile in this submarket — average credit score on applications, eviction rate, late-payment / NSF rate, and stable-employment percentage? A property-management company in the area should have these aggregated.
- How much new for-sale + rental construction is in the pipeline within 1–3 miles? Heavy new supply typically softens prices + rents 12–24 months out; constrained supply supports both.
Investment metrics
- 1% rule
- 0.85% ✗
- Cap rate
- 6.10%
- Cash-on-cash
- -0.69%
- DSCR
- 0.97
- GRM
- 9.8
CMA / ARV
- ARV (on-the-fly)
- $129,360
- Comps found
- 2
Show comp detail 2 sales within ~0.75 mi
| Address | Dist | Beds/Ba | Sqft | Sold | Price | $/sf | Match |
|---|---|---|---|---|---|---|---|
| 28128 N Highway 41 #41 | 0.06mi | 3/1.0 | 924 (0%) | 12mo | $129,400 | $140 | 84 |
| 28128 N Highway 41 #29 | 0.06mi | 2/1.0 (-1) | 924 (0%) | 13mo | $89,900 | $97 | 77 |
Match score weights: distance 35% · size 25% · config 20% · recency 20%. Top-matched comps best support the ARV.
Projected returns pro-forma
-3.0% appreciation · 3.0% rent growth · sell at horizon
- IRR
- -17.4%
- Equity multiple
- 0.39×
- Total profit
- $-22,374
- Equity at exit
- $19,383
- IRR
- -9.4%
- Equity multiple
- 0.42×
- Total profit
- $-21,122
- Equity at exit
- $11,240
Cash invested: $36,400 (down + closing). Projections, not guarantees.
Landlord ↔ Tenant lean methodology
- Overall (STATE)
- 91 Strongly Landlord-Friendly
- State Idaho
- 91 Strongly Landlord-Friendly · R+18
- County
- — inherits STATE
- City
- — inherits STATE
ZIP-level market 83869
- Home prices YoY
- -19.3%
- Active inventory
- 104
- Price-to-rent
- 9.8×
Monthly cashflow live
- Estimated rent
- $1,111 medium interval (Pro) →
- Mortgage (P&I)
- −$682
- Tax est. 1.5%
- −$162 /mo · $1,950/yr
- Insurance
- −$54
- HOA
- −$0
- Vacancy / Maint / Mgmt
- −$233
- Net cashflow
- $-21
Break-even live
Sensitivity live
| Price | -10% $69 | -5% $24 | +0% $-21 | +5% $-66 | +10% $-111 |
|---|---|---|---|---|---|
| Rent | -10% $-109 | -5% $-65 | +0% $-21 | +5% $23 | +10% $67 |
| Rate | -1.0pp $45 | -0.5pp $12 | base $-21 | +0.5pp $-54 | +1.0pp $-89 |
UW: 25.0% down · 7.5% · 30yr · 1.5% tax · 5.0% vac · 8.0% maint · 8.0% mgmt
Financing live
Cash to close
- Down payment
- $32,500
- Closing costs
- $3,900
- Reserves months
- —
- Total cash needed
- —
Loan-product check · same deal, 3 products live
Conventional
25% down · 7.5% · 30yr
- Down + closing
- —
- Monthly P&I
- —
- Monthly cashflow
- —
- DSCR
- —
- Eligible?
- —
Personal DTI + credit; lowest rate.
DSCR
20% down · 8.5% · 30yr
- Down + closing
- —
- Monthly P&I
- —
- Monthly cashflow
- —
- DSCR
- —
- Eligible?
- —
No personal income docs; deal must DSCR.
Hard money
10% down · 12.0% · 12mo
- Down + closing
- —
- Monthly P&I
- —
- Monthly cashflow
- —
- DSCR
- —
- Eligible?
- —
Short-term bridge; refi at stabilization.
Listing history 16 events
-
2026-06-19days on market $130,000 Active 41 DOM
-
2026-06-18days on market $130,000 Active 40 DOM
-
2026-06-17days on market $130,000 Active 39 DOM
-
2026-06-16days on market $130,000 Active 38 DOM
-
2026-06-15days on market $130,000 Active 37 DOM
-
2026-06-14days on market $130,000 Active 35 DOM
-
2026-06-13statusdays on market $130,000 Active 34 DOM
-
2026-06-10status $130,000 Pending 33 DOM
-
2026-06-09days on market $130,000 Active 33 DOM
-
2026-06-08days on market $130,000 Active 32 DOM
-
2026-06-07days on market $130,000 Active 31 DOM
-
2026-06-02pricedays on market $130,000 Active 26 DOM
-
2026-06-01days on market $159,000 Active 25 DOM
-
2026-05-31days on market $159,000 Active 24 DOM
-
2026-05-30days on market $159,000 Active 23 DOM
-
2026-05-07$159,000 Active
ⓘ Source: listings_history table (triggers on properties + properties_extension) + one-shot
backfill from property_details.listing_events for pre-trigger history.
Climate risk First Street
- Flood 1/10 Low FEMA zone X (unshaded) · 0% chance over 30 yrs
- Wildfire 5/10 Major
- Heat 2/10 Low 7 d/yr ≥90°F today · 15 d/yr by 30 yrs out
- Wind 1/10 Low
- Air quality 9/10 Extreme 16 unhealthy d/yr today · 20 by 30 yrs out
Nearby sold comps map
Loading sold comps map…
Walkable amenities ~0.75 mi
Loading nearby amenities…
Taxation est. · year 1
- Rental income
- $13,330
- − Mortgage interest
- −$7,282
- − Property taxes
- −$1,950
- − Insurance
- −$650
- − Repairs & maintenance
- −$1,066
- − Management
- −$1,066
- − Depreciation
- −$3,782
- Taxable loss
- −$2,466
- Est. tax savings @ 24.0%
- +$592
- After-tax cash flow
- $342/yr
For passive investors: Depreciation is non-cash, so a rental often shows a tax loss while cash-flowing — sheltering income. Rental losses are passive: they offset passive income freely, and up to $25,000/yr can offset ordinary (W-2) income if you actively participate and your MAGI is under $100k (phasing out to $0 by $150k); unused losses carry forward. On sale, claimed depreciation is recaptured at up to 25%, and gains may owe capital-gains tax (a 1031 exchange can defer both). Figures are a year-1 estimate at your 24.0% rate — not tax advice; consult a CPA.
Condition & rehab AI · 13 photos
This completely remodeled and move-in ready home offers modern comfort and style with updated kitchens and bathrooms, all on leased land for an affordable, low-maintenance lifestyle.
Value-add opportunities
- Both landscaping — enhances curb appeal and adds value
- Both paint exterior — improves curb appeal and adds value
Renovation cost estimate screening
Value-add ROI direction
- Both landscaping — enhances curb appeal and adds value ↑
- Both paint exterior — improves curb appeal and adds value ↑
ⓘ Cost ranges are severity-bucket heuristics (US national rule-of-thumb). Get contractor quotes + a written scope before underwriting a rehab budget.
Schools (NCES district)
- District
- Lakeland District
- NCES district ID
- 1601800
- Math proficiency
- 41% ▼ -6.00%
- Reading proficiency
- 57% ▼ -2.00%
- Median HH income
- $52,454
- Composite
- 42.13/100
- National rank
- #3310
- State rank
- #34 of 92 in ID
Livability — Spirit Lake
- Score
- 66/100
- State rank
- #114
- US rank
- #12060
Category grades
Schools grade is shown separately in the Schools card above.
Census & demographics
- Population (ZIP)
- 5,278
Population outlook (Kootenai County) Hauer SSP2
- Today (2025)
- 177,692 people
- By 2030
- 190,689 · +7.3%
- By 2040
- 214,704 · +20.8%
- By 2050
- 236,510 · +33.1%
- By 2075
- 285,984 · +60.9%
- By 2100
- 316,459 · +78.1%
Race, ethnicity, and origin ACS 2023
- Neighborhood character
- Predominantly White (84%)
- Race & ethnicity
- White 84% Two or more races 11% Hispanic / Latino 9%
- Hispanic origin (detail)
- Mexican 5% Cuban 2%
- Common ancestry
- Slovak 7% Romanian 4% Lithuanian 4%
- Foreign-born
- 0%
- Languages at home
- 99% English-only · Spanish 1%
Political lean MEDSL · Kootenai
- 2024 margin
- Solid R (+51.9) · D 22.9% · R 74.8% · Other 2.2%
- 2008→2024 swing
- -25.6pp toward R · 2008: -26.3pp · 2024: -51.9pp
- All cycles
- 2024: R+51.9 2020: R+42.9 2016: R+42.5 2012: R+34.3 2008: R+26.3
Not yet ingested
- Civics
- —
Market trends
- HPI YoY
- ▼ -73.46%
- Current HPI
- 307.8853
- Rent YoY
- —
- Metro
- —
- State GDP YoY
- ▲ 4.51%
- F500 in state
- 6
Industry mix (Fortune 500 HQ in ID)
| Industry | F500 HQs | Revenue |
|---|---|---|
| Retail | 1 | $79B |
|
||
| Technology | 1 | $25B |
|
||
| Food / Agriculture | 1 | $6B |
|
||
Price history
1 event — show timeline
- 2026-05-07 Listed $159,000 CDAMLS
Cash-flow waterfall
monthlySold comps — $/sqft
last 12 mo · ≤1 miLoading sold comps…