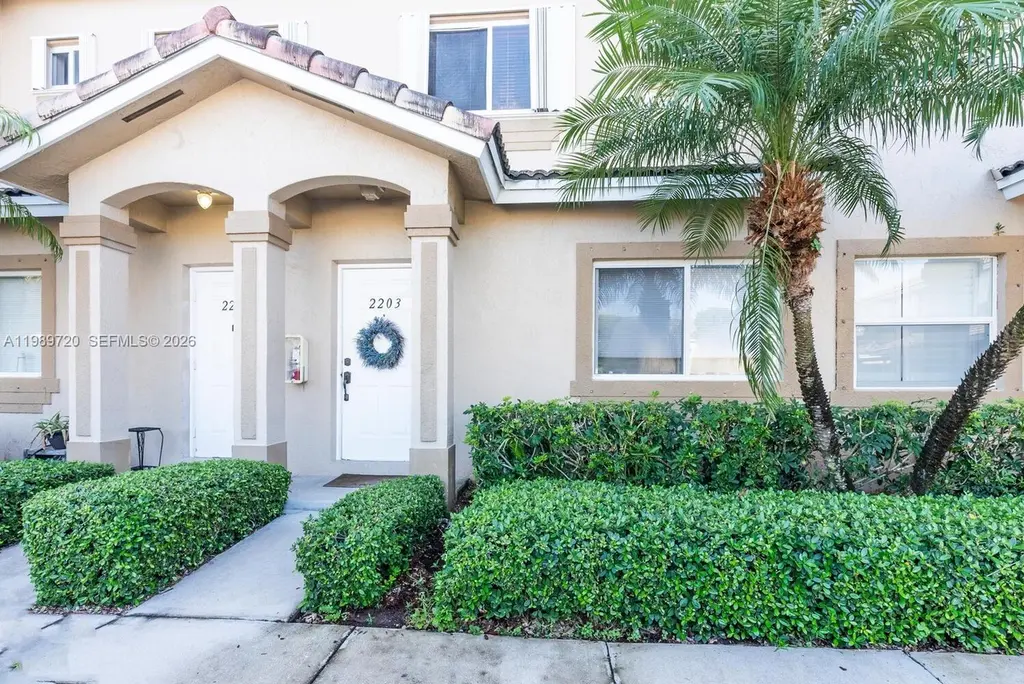
2203 SE 23rd Ter #2203 · Homestead, FL
Flood risk 6/10 · Moderate
- FEMA flood zone
- X (unshaded)
- Chance of flooding over 30 yrs
- 0.62%
- Est. flood insurance / yr
- $507 – $1,088
Fire risk 2/10 · Minimal
- Est. fire insurance / yr
- $947 – $1,759
Heat risk 10/10 · Severe
- Hot days now (above 106°F)
- 7 days/yr
- Hot days in 30 yrs
- 33 days/yr
Wind risk 10/10 · Severe
- Chance of severe wind over 30 yrs
- 99.0%
Air-quality risk 2/10 · Minimal
- Unhealthy air days now
- 1 days/yr
- Unhealthy air days in 30 yrs
- 1 days/yr
Risk factors via First Street. Map © Google.
Why this score? — see what drove the D- grade
The composite is a weighted blend of 9 inputs, each scored 0–100. Each bar is that input's sub-score; the figure is the points it added to the 100-point composite (weight × sub-score).
- Cash flow +9.4/30.0
- ARV discount +7.5/15.0
- 1% rule +4.4/10.0
- Schools +4.2/10.0
- Livability +3.9/5.0
- DSCR +2.6/10.0
- Condition / age +2.5/5.0
- Appreciation +2.4/10.0
- Rent growth +1.7/5.0
$249,999
🖨 Deal sheet (PDF) 📄 Offer letter ✓ Due diligence
Listing remarks
Spacious 2-bedroom townhouse featuring dual master suites, perfect for privacy and flexible living arrangements. This well-maintained home offers laminate flooring throughout, creating a clean and modern feel. Enjoy your own private fenced patio, ideal for relaxing or entertaining. Association includes cable, internet, and alarm service, providing added value and convenience. Located in a great community with security, offering peace of mind and a welcoming environment. A fantastic opportunity for comfortable and low-maintenance living!
Key facts
- Private fenced patio
- Dual master suites
- $288 HOA
Tags
Property features AI
Finance
- Financial info: Lease considered; Pets allowed with restrictions or conditions
- HOA & community: Monthly association fee; Association covers common areas, cable TV, internet, grounds maintenance, and structure maintenance; Community amenities include a playground and pool
Exterior
- Parking: Guest parking; One assigned space
- Security: Key card entry; Security guard
- Utilities: Cable available
- Home design: Attached property; 2 stories; Entry on level 1
- Construction: Block construction; Resale property
- Exterior features: Fenced; Association pool
Interior
- Kitchen: Electric range; Dishwasher; Garbage disposal; Refrigerator
- Bedrooms: Primary bedroom on upper level
- Flooring: Vinyl
- Bathrooms: 2 full bathrooms; 1 half bathroom
- Heating & cooling: Central heating (electric); Central air conditioning (electric)
- Interior features: Sliding windows; First floor entry; Kitchen/dining combo; Living/dining room; Upper-level primary bedroom; Unfurnished
- Laundry & utility: Washer; Dryer
Neighborhood map
What this means for you Summary
Snapshot
- This is a 2-bed/2.0-bath condo listed at $250k.
Deal economics
- At list price, monthly cash flow is $-177 ($-2k/yr) — negative.
- To cash-flow at today's rent, offer at most $219k (12.5% below list).
- To meet the 1% rule (rent ≥ 1% of price), the offer needs to be $234k (6.4% below list).
- Recommended offer: $219k (12.5% below list) — sets the bar for cash-flow.
- Cap rate 5.4% vs local median 3.5% in Homestead — top-decile yield for the area; either an underpriced asset or a hidden risk that comps aren't pricing in. Stress-test before assuming the spread holds.
Location & tenants
- Location reads 78/100 on livability (#158 in FL, #2,408 nationally) — a middle-class / working-renter tenant base. Strengths: commute A+, housing A+, health & safety A+; Watch: employment C-.
- Miami-Dade (suburban): math 45% / reading 54% proficiency, ranked #40 of 73 in FL (top 55%) — families likely to look elsewhere, expect single-tenant / working-renter base with shorter leases; 64% free/reduced lunch — lower-income household profile, screen leases tightly.
- Zoned schools: Gateway Environmental K-8 Learning Center (math 23% / reading 34%, grade F, #1,943 of 2,144 statewide, top 91%, 1,355 students, 74% FRL); Homestead Middle School (math 23% / reading 25%, grade F, #532 of 571 statewide, top 94%, 666 students, 81% FRL); Homestead Senior High School (math 24% / reading 23%, grade F, #533 of 667 statewide, top 80%, 2,020 students, 74% FRL).
- Zoned-school proficiency averages 25% at this address vs 50% district-wide (-24 pts) — the specific schools serving this property underperform the Miami-Dade average; the district grade overstates school quality for this exact location.
- Market conditions: Rents falling (-3.2%/yr); 466 active listings in the ZIP; 40 comparable units currently listed for rent nearby; rentals at typical pace (median 24d on market — plan ~3-4 weeks tenant-placement turnaround); 10,051 units permitted in Miami-Dade County in 2024 (7,758 in 5+ unit buildings).
- This rent runs 41% of the median local income ($68k/yr) — at the standard rent-burdened threshold; future hikes will face affordability resistance.
Forward outlook
- Local home prices are declining (-3.0%/yr); year-one equity from $2k of loan paydown is wiped out by about $8k of value loss. Plan a longer hold.
- Miami-Dade County population projected at +28% by 2050 — long-run rental-demand tailwind backs the buy-and-hold thesis.
Negotiation context
- It's been on market 89 days — a 6% lower offer ($235k) is reasonable based on typical stale-listing flexibility.
- 9 sale attempts since 11y ago; this cycle's ask is 13413% above the opening price — seller raised mid-cycle; expect resistance to lowballs.
- Current owner paid $129k; list at $250k implies a 94% gain — meaningful room to come down on a strong offer.
Risks & watch-outs
- Climate carrying-cost: major flood risk; severe wind risk, 99% chance of damaging wind over 30y; extreme-heat days projected 7→33/yr by 2055 (HVAC capex compounding) — expect insurance premiums to compound above CPI over the hold.
Questions for the listing agent
- What do current leases actually rent for vs. the listed asking? Can we see a recent rent roll and the last 12 months of T-12 income?
- It's been on market 89 days. Have you received any prior offers? Is the seller open to a 13% concession, seller financing, or rate buy-down credit?
- What does the HOA fee cover, when was the last increase, and are there any pending special assessments or reserve-fund shortfalls?
- Any open or pending special assessments — roof, HVAC, plumbing, elevator, façade? What's the per-unit balance and payoff schedule, and is the seller paying it off at close or rolling it to the buyer?
- Why hasn't it sold? Are there any deal-killer items the seller is aware of (foundation, flood, title, zoning, code violations)?
- Is there a deadline driving the sale (1031 exchange, divorce, estate, relocation)? That informs how much negotiation room exists.
- Schools are B-rated — typically a magnet for longer-tenancy family renters. What's the average tenant stay here, and is there a school-zone premium baked into asking?
- The area grade is low — what's the realistic commute time and amenity access for the typical tenant pool here? Any planned neighborhood developments (good or bad) we should know about?
- What's the average days-on-market for RENTAL listings here right now (not sales)? A rising rental-DOM trend means longer vacancies and softer asking-rent achievability than the comps imply.
- What's the recent tenant-quality profile in this submarket — average credit score on applications, eviction rate, late-payment / NSF rate, and stable-employment percentage? A property-management company in the area should have these aggregated.
- How much new apartment / multifamily construction is in the pipeline within 1–3 miles? Heavy new supply (>2% of stock underway) typically softens rents 12–24 months out; light construction supports rent growth.
Investment metrics
- 1% rule
- 0.94% ✗
- Cap rate
- 5.44%
- Cash-on-cash
- -3.03%
- DSCR
- 0.86
- GRM
- 8.9
CMA / ARV
No comps found within radius.
Projected returns pro-forma
-3.0% appreciation · 0.0% rent growth · sell at horizon
- IRR
- -25.3%
- Equity multiple
- 0.17×
- Total profit
- $-58,425
- Equity at exit
- $37,276
- IRR
- -38.4%
- Equity multiple
- -0.30×
- Total profit
- $-91,012
- Equity at exit
- $21,615
Cash invested: $70,000 (down + closing). Projections, not guarantees.
Landlord ↔ Tenant lean methodology
- Overall (STATE)
- 87 Strongly Landlord-Friendly
- State Florida
- 87 Strongly Landlord-Friendly · R+3
- County
- — inherits STATE
- City
- — inherits STATE
ZIP-level market 33035
- Home prices YoY
- -1.4%
- Rents YoY
- -3.2%
- Active inventory
- 466
- Price-to-rent
- 8.9×
Monthly cashflow live
- Estimated rent
- $2,341 high interval (Pro) →
- Mortgage (P&I)
- −$1,311
- Tax from tax record
- −$323 /mo · $3,875/yr
- Insurance
- −$104
- HOA
- −$288
- Vacancy / Maint / Mgmt
- −$492
- Net cashflow
- $-177
Break-even live
Sensitivity live
| Price | -10% $-35 | -5% $-106 | +0% $-177 | +5% $-248 | +10% $-319 |
|---|---|---|---|---|---|
| Rent | -10% $-362 | -5% $-269 | +0% $-177 | +5% $-85 | +10% $8 |
| Rate | -1.0pp $-51 | -0.5pp $-113 | base $-177 | +0.5pp $-242 | +1.0pp $-308 |
UW: 25.0% down · 7.5% · 30yr · 1.5% tax · 5.0% vac · 8.0% maint · 8.0% mgmt
Financing live
Cash to close
- Down payment
- $62,500
- Closing costs
- $7,500
- Reserves months
- —
- Total cash needed
- —
Loan-product check · same deal, 3 products live
Conventional
25% down · 7.5% · 30yr
- Down + closing
- —
- Monthly P&I
- —
- Monthly cashflow
- —
- DSCR
- —
- Eligible?
- —
Personal DTI + credit; lowest rate.
DSCR
20% down · 8.5% · 30yr
- Down + closing
- —
- Monthly P&I
- —
- Monthly cashflow
- —
- DSCR
- —
- Eligible?
- —
No personal income docs; deal must DSCR.
Hard money
10% down · 12.0% · 12mo
- Down + closing
- —
- Monthly P&I
- —
- Monthly cashflow
- —
- DSCR
- —
- Eligible?
- —
Short-term bridge; refi at stabilization.
Rent comps 40 comps
| Address | Beds | Baths | Sqft | Rent | $/sqft | DOM | Units | Dist |
|---|---|---|---|---|---|---|---|---|
| 2373 SE 23rd Dr #2373 Homestead, FL | 3.0 | 2.5 | 1458 | $2,300 | $1.58 | 26d | 1 | 0.08mi |
| 2373 SE 23rd Dr #2373 Homestead, FL | 3.0 | 2.5 | 1458 | $2,150 | $1.47 | 3d | 1 | 0.08mi |
| 2205 SE 23rd Rd Homestead, FL | 3.0 | 2.5 | 1452 | $2,600 | $1.79 | 26d | 1 | 0.08mi |
| 2320 SE 23rd Rd #2320 Homestead, FL | 3.0 | 2.5 | 1452 | $2,250 | $1.55 | 26d | 1 | 0.11mi |
| 2320 SE 23rd Rd #2320 Homestead, FL | 3.0 | 2.5 | 1452 | $2,250 | $1.55 | 10d | 1 | 0.11mi |
| 1904 SE 23rd Ave Unit 1904 Homestead, FL | 3.0 | 2.5 | 1854 | $2,800 | $1.51 | 26d | 1 | 0.13mi |
| 1904 SE 23rd Ave Unit 1904 Homestead, FL | 3.0 | 2.5 | 1854 | $2,750 | $1.48 | 10d | 1 | 0.13mi |
| 2414 SE 21st St Homestead, FL | 2.0 | 2.5 | 1431 | $2,500 | $1.75 | 26d | 1 | 0.14mi |
| 2424 SE 19th Ct Unit 2424 Homestead, FL | 2.0 | 2.5 | 1431 | $2,150 | $1.50 | 1d | 1 | 0.17mi |
| 2424 SE 19th Ct Unit 2424 Homestead, FL | 2.0 | 2.5 | 1431 | $2,200 | $1.54 | 15d | 1 | 0.17mi |
| 2201 SE 24th Pl #2201 Homestead, FL | 2.0 | 2.5 | 1370 | $1,850 | $1.35 | 26d | 1 | 0.18mi |
| 1645 SE 20th Rd Unit 1645 Homestead, FL | 3.0 | 2.5 | 1874 | $2,750 | $1.47 | 24d | 1 | 0.21mi |
| 2877 SE 24th Ct Homestead, FL | 3.0 | 2.5 | 1334 | $2,900 | $2.17 | 26d | 1 | 0.24mi |
| 2232 SE 26th Ln Unit 2232-1 Homestead, FL | 3.0 | 2.5 | 1519 | $2,100 | $1.38 | 24d | 1 | 0.27mi |
| 1575 SE 20th Rd Homestead, FL | 3.0 | 2.5 | 1693 | $2,850 | $1.68 | 1d | 1 | 0.28mi |
| 1575 SE 20th Rd Homestead, FL | 3.0 | 2.0 | 1693 | $2,850 | $1.68 | 26d | 1 | 0.28mi |
| 2518 SE 20th Pl Unit 203B Homestead, FL | 2.0 | 2.0 | 1040 | $2,000 | $1.92 | 6d | 1 | 0.30mi |
| 2518 SE 20th Pl Unit 203B Homestead, FL | 2.0 | 2.0 | 1040 | $2,000 | $1.92 | 5d | 1 | 0.30mi |
| 2525 SE 19th Pl Unit 105B Homestead, FL | 3.0 | 2.0 | 1220 | $2,200 | $1.80 | 26d | 1 | 0.31mi |
| 2407 SE 14th St Homestead, FL | 3.0 | 3.0 | 1704 | $2,550 | $1.50 | 17d | 1 | 0.33mi |
| 2746 SE 24th Ter Unit 2746 Homestead, FL | 3.0 | 2.5 | 1828 | $2,650 | $1.45 | 24d | 1 | 0.35mi |
| 2532 SE 15th Ct Unit 2532 Homestead, FL | 3.0 | 3.0 | 1704 | $2,500 | $1.47 | 16d | 1 | 0.35mi |
| 2621 SE 21st Ct Unit 105B Homestead, FL | 2.0 | 2.0 | 1070 | $2,100 | $1.96 | 26d | 1 | 0.37mi |
| 2601 SE 19th Ct Homestead, FL | 2.0 | 2.0 | 1070 | $2,300 | $2.15 | 26d | 1 | 0.37mi |
| 2629 SE 19th Ct Homestead, FL | 2.0 | 2.0 | 1070 | $2,000 | $1.87 | 26d | 1 | 0.37mi |
| 2622 SE 19th Ct Unit 207B Homestead, FL | 3.0 | 2.0 | 1310 | $2,200 | $1.68 | 5d | 1 | 0.37mi |
| 2603 SE 20th Ct Unit 102A Homestead, FL | 2.0 | 2.0 | 1070 | $2,000 | $1.87 | 26d | 1 | 0.37mi |
| 2603 SE 20th Ct Unit 102A Homestead, FL | 2.0 | 2.0 | 1070 | $2,000 | $1.87 | 10d | 1 | 0.37mi |
| 2277 SE 27th Dr Homestead, FL | 2.0 | 2.0 | 1070 | $2,200 | $2.06 | 26d | 1 | 0.39mi |
| 2624 SE 25th Ct Homestead, FL | 3.0 | 3.0 | 1328 | $2,800 | $2.11 | 4d | 1 | 0.39mi |
| 2725 SE 26th Rd Unit 2725 Homestead, FL | 3.0 | 2.5 | 1414 | $2,500 | $1.77 | 26d | 1 | 0.39mi |
| 2729 SE 26th Rd #2729 Homestead, FL | 3.0 | 3.0 | 1328 | $2,400 | $1.81 | 26d | 1 | 0.39mi |
| 2764 SE 26th Ave Unit 2764 Homestead, FL | 3.0 | 2.5 | 1483 | $2,499 | $1.69 | 26d | 1 | 0.42mi |
| 2764 SE 26th Ave Unit 2764 Homestead, FL | 3.0 | 2.5 | 1483 | $2,450 | $1.65 | 5d | 1 | 0.42mi |
| 2732 SE 26th Ave Unit 2732 Homestead, FL | 3.0 | 2.5 | 1414 | $2,500 | $1.77 | 26d | 1 | 0.42mi |
| 1158 SE 23rd Ave Unit 1158 Homestead, FL | 3.0 | 2.0 | 1302 | $2,400 | $1.84 | 18d | 1 | 0.43mi |
| 1158 SE 23rd Ave Homestead, FL | 3.0 | 2.0 | 1302 | $2,450 | $1.88 | 21d | 1 | 0.43mi |
| 1684 SE 26th Ter #1684 Homestead, FL | 3.0 | 2.5 | 1612 | $2,400 | $1.49 | 22d | 1 | 0.43mi |
| 1684 SE 26th Ter #1684 Homestead, FL | 3.0 | 2.5 | 1612 | $2,400 | $1.49 | 10d | 1 | 0.43mi |
| 2628 SE 19th St Unit 2628 Homestead, FL | 3.0 | 2.5 | 1545 | $2,400 | $1.55 | 17d | 1 | 0.44mi |
HOA detail condo
- Monthly dues
- $288 · $3,456/yr
- Likely covers
- internetcablesecurity
- Assessments
- None detected in remarks — confirm with the listing agent.
Listing history 44 events
-
2026-06-22days on market $249,999 Active 89 DOM
-
2026-06-21days on market $249,999 Active 88 DOM
-
2026-06-18days on market $249,999 Active 85 DOM
-
2026-06-17days on market $249,999 Active 84 DOM
-
2026-06-16days on market $249,999 Active 83 DOM
-
2026-06-15days on market $249,999 Active 82 DOM
-
2026-06-13days on market $249,999 Active 80 DOM
-
2026-06-09days on market $249,999 Active 76 DOM
-
2026-06-08days on market $249,999 Active 75 DOM
-
2026-06-07days on market $249,999 Active 74 DOM
-
2026-06-04days on market $249,999 Active 71 DOM
-
2026-06-03days on market $249,999 Active 70 DOM
-
2026-06-02days on market $249,999 Active 69 DOM
-
2026-06-01days on market $249,999 Active 68 DOM
-
2026-05-31days on market $249,999 Active 67 DOM
-
2026-04-08price $1,950
-
2026-03-26$1,850
-
2026-03-25$249,999 Active
-
2025-08-05historical
-
2025-04-15historical $2,000
-
2025-04-03price $277,000
-
2025-03-14$2,000
-
2025-01-06status Active
-
2024-08-05$299,000 Active
-
2024-08-03historical
-
2024-03-16historical $1,950
-
2024-03-08$1,950
-
2024-01-03price $299,000
-
2023-08-23price $304,999
-
2023-08-02$320,000 Active
-
2016-11-14soldstatus $129,000 Sold
-
2016-10-27soldstatus $120,000
-
2016-09-27status Pending
-
2016-08-08price $129,000
-
2016-07-15price $138,500
-
2016-07-13price $155,000
-
2016-07-11price $138,500
-
2016-06-20price $155,000
-
2016-01-20$178,000 Active
-
2015-12-25historical
-
2015-02-24$178,000 Active
-
2013-12-30soldstatus $77,077 Sold
-
2013-07-24status Pending
-
2004-10-06soldstatus $136,300
ⓘ Source: listings_history table (triggers on properties + properties_extension) + one-shot
backfill from property_details.listing_events for pre-trigger history.
Tax reassessment forecast FL · Resets to sale price
- Current annual tax
- $3,875 · $323/mo
- Projected year-2 tax
- $3,875 · $323/mo
- Expected delta
- $0/yr ($0/mo · 0.0%)
ⓘ Screening estimate from a state-policy table — verify with the county assessor before closing.
Climate risk First Street
- Flood 6/10 Major FEMA zone X (unshaded) · 62% chance over 30 yrs
- Wildfire 2/10 Low
- Heat 10/10 Extreme 7 d/yr ≥106°F today · 33 d/yr by 30 yrs out
- Wind 10/10 Extreme 99% chance of damaging wind over 30 yrs
- Air quality 2/10 Low 1 unhealthy d/yr today · 1 by 30 yrs out
Nearby sold comps map
Loading sold comps map…
Walkable amenities ~0.75 mi
Loading nearby amenities…
Taxation est. · year 1
- Rental income
- $28,088
- − Mortgage interest
- −$14,004
- − Property taxes
- −$3,875
- − Insurance
- −$1,250
- − Repairs & maintenance
- −$2,247
- − Management
- −$2,247
- − HOA
- −$3,456
- − Depreciation
- −$7,273
- Taxable loss
- −$6,264
- Est. tax savings @ 24.0%
- +$1,503
- After-tax cash flow
- $-621/yr
For passive investors: Depreciation is non-cash, so a rental often shows a tax loss while cash-flowing — sheltering income. Rental losses are passive: they offset passive income freely, and up to $25,000/yr can offset ordinary (W-2) income if you actively participate and your MAGI is under $100k (phasing out to $0 by $150k); unused losses carry forward. On sale, claimed depreciation is recaptured at up to 25%, and gains may owe capital-gains tax (a 1031 exchange can defer both). Figures are a year-1 estimate at your 24.0% rate — not tax advice; consult a CPA.
Schools (NCES district)
- District
- Miami-Dade
- NCES district ID
- 1200390
- Math proficiency
- 45% ▼ -16.00%
- Reading proficiency
- 54% ▼ -5.00%
- Median HH income
- $43,928
- Composite
- 41.76/100
- National rank
- #3397
- State rank
- #40 of 73 in FL
Livability — Homestead
- Score
- 78/100
- State rank
- #158
- US rank
- #2408
Category grades
Schools grade is shown separately in the Schools card above.
Census & demographics
- Census place
- Homestead, FL
- County
- Miami-Dade County · 2,697,751 people
- City population
- 191,470
- Metro
- Miami-Fort Lauderdale-Pompano Beach, FL
- Population (ZIP)
- 17,202
- Household income
- $68,354
- Rent vs Own
- Severe rent burden
- 687.0
Population outlook (Miami-Dade County) Hauer SSP2
- Today (2025)
- 3,126,439 people
- By 2030
- 3,325,765 · +6.4%
- By 2040
- 3,697,561 · +18.3%
- By 2050
- 4,012,134 · +28.3%
- By 2075
- 4,605,612 · +47.3%
- By 2100
- 4,866,598 · +55.7%
Race, ethnicity, and origin ACS 2023
- Neighborhood character
- Diverse neighborhood (Simpson 0.55)
- Race & ethnicity
- Hispanic / Latino 63% Two or more races 35% Black 18% White 12%
- Hispanic origin (detail)
- Mexican 6% Puerto Rican 13% Cuban 25% Dominican 2% Salvadoran 1%
- Common ancestry
- Hispanic 6% Lithuanian 3% Estonian 1%
- Foreign-born
- 33% · Canada, Dominican Republic, Jamaica
- Languages at home
- 32% English-only · Spanish 60% French/Haitian/Cajun 7% Other Indo-European 1%
Political lean MEDSL · Miami-Dade
- 2024 margin
- R (+11.4) · D 43.9% · R 55.4%
- 2008→2024 swing
- -27.6pp toward R · 2008: 16.1pp · 2024: -11.4pp
- All cycles
- 2024: R+11.4 2020: D+7.3 2016: D+29.6 2012: D+23.7 2008: D+16.1
Not yet ingested
- Civics
- —
Market trends
- HPI YoY
- ▼ -5.24%
- Current HPI
- 369.3031
- Rent YoY
- ▼ -3.20%
- Metro
- Miami-Fort Lauderdale-Pompano Beach, FL
- State GDP YoY
- ▲ 3.28%
- F500 in state
- 36
Industry mix (Fortune 500 HQ in FL)
| Industry | F500 HQs | Revenue |
|---|---|---|
| Industrial Technology | 2 | $29B |
|
||
| Insurance | 2 | $17B |
|
||
| Retail | 1 | $60B |
|
||
| Technology Distribution | 1 | $58B |
|
||
| Homebuilding | 1 | $35B |
|
||
| Technology Manufacturing | 1 | $35B |
|
||
Price history
-98.6% since first listed29 events — show timeline
- 2026-04-08 Price Changed $1,950 MARMLS
- 2026-03-26 Listed for Rent $1,850 MARMLS
- 2026-03-25 Listed $249,999 MARMLS
- 2025-08-05 Listing Removed — MARMLS
- 2025-04-15 Rental Removed $2,000 MARMLS
- 2025-04-03 Price Changed $277,000 MARMLS
- 2025-03-14 Listed for Rent $2,000 MARMLS
- 2025-01-06 Relisted — MARMLS
- 2024-08-05 Listed $299,000 MARMLS
- 2024-08-03 Listing Removed — MARMLS
- 2024-03-16 Rental Removed $1,950 MARMLS
- 2024-03-08 Listed for Rent $1,950 MARMLS
- 2024-01-03 Price Changed $299,000 MARMLS
- 2023-08-23 Price Changed $304,999 MARMLS
- 2023-08-02 Listed $320,000 MARMLS
- 2016-11-14 Sold (MLS) $129,000 MARMLS
- 2016-10-27 Sold (Public Records) $120,000 Public Records
- 2016-09-27 Pending — MARMLS
- 2016-08-08 Price Changed $129,000 MARMLS
- 2016-07-15 Price Changed $138,500 MARMLS
- 2016-07-13 Price Changed $155,000 MARMLS
- 2016-07-11 Price Changed $138,500 MARMLS
- 2016-06-20 Price Changed $155,000 MARMLS
- 2016-01-20 Listed $178,000 MARMLS
- 2015-12-25 Listing Removed — MARMLS
- 2015-02-24 Listed $178,000 MARMLS
- 2013-12-30 Sold (MLS) $77,077 MARMLS
- 2013-07-24 Pending — MARMLS
- 2004-10-06 Sold (Public Records) $136,300 Public Records
Property tax history
+8.0%/yrLatest (2025): $3,875 · +4.3% YoY. Source: county tax records.
Cash-flow waterfall
monthlySold comps — $/sqft
last 12 mo · ≤1 miLoading sold comps…