1931 E Meats · Orange, CA
Flood risk 1/10 · Minimal
- FEMA flood zone
- X (unshaded)
- Chance of flooding over 30 yrs
- 0.0%
- Est. flood insurance / yr
- $507 – $1,088
Fire risk 1/10 · Minimal
- Est. fire insurance / yr
- $659 – $1,223
Heat risk 6/10 · Moderate
- Hot days now (above 95°F)
- 7 days/yr
- Hot days in 30 yrs
- 22 days/yr
Wind risk 1/10 · Minimal
- Chance of severe wind over 30 yrs
- —
Air-quality risk 5/10 · Moderate
- Unhealthy air days now
- 7 days/yr
- Unhealthy air days in 30 yrs
- 9 days/yr
Risk factors via First Street. Map © Google.
Why this score? — see what drove the B grade
The composite is a weighted blend of 9 inputs, each scored 0–100. Each bar is that input's sub-score; the figure is the points it added to the 100-point composite (weight × sub-score).
- Cash flow +30.0/30.0
- 1% rule +10.0/10.0
- DSCR +10.0/10.0
- ARV discount +8.3/15.0
- Schools +4.5/10.0
- Condition / age +4.0/5.0
- Livability +3.7/5.0
- Rent growth +2.5/5.0
- Appreciation +0.0/10.0
$199,000
🖨 Deal sheet 📄 Offer letter ✓ Due diligence
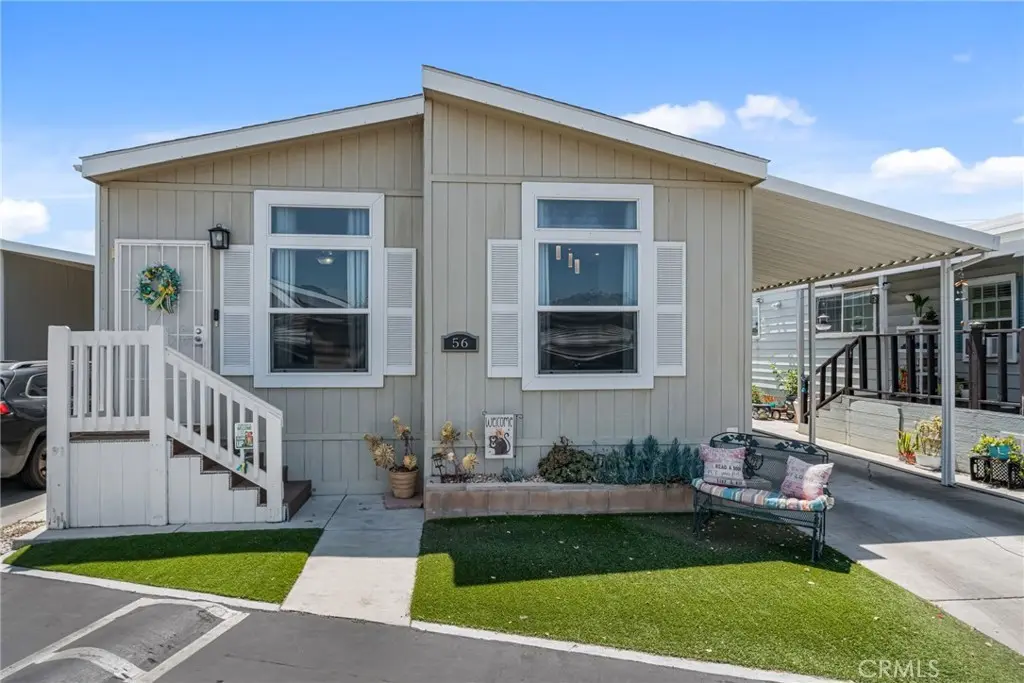
Listing remarks
This charming 3-bedroom home sits in a desirable all-ages community within the Award-Winning Orange Unified School District. The bright, open floor plan boasts luxury vinyl plank flooring, recessed lighting, and neutral tones throughout. A spacious living room flows into a separate dining area and a beautifully designed kitchen with plenty of cabinetry, quality appliances, and a refrigerator included. Down the hall are two secondary bedrooms and a full bath, while the large primary suite offers a private retreat with a roomy ensuite featuring dual sinks, a soaking tub, and a separate shower. Other perks include an indoor laundry room with ample storage and washer and dryer included, plus a
Key facts
- Covered carport
- Recessed lighting
- Separate dining area
Tags
Property features AI
Finance
- Other: Manager approval required; Pets allowed; Rent includes trash (see remarks)
- Financial info: Monthly land lease paid to park
- HOA & community: Orange Mobile Home Park (land lease community); Community features include street lighting and a park
Exterior
- Parking: Covered tandem private parking for 3 vehicles; Three carport spaces
- Security: On-site resident manager
- Utilities: Public sewer; District/public water; Natural gas connected; Electricity connected; Water connected
- Home design: Single-story mobile home (Cal - 5224B model); Mobile remains on site; Mobile dimensions approx. 22' x 52'; One entry level; Has view
- Construction: Pier jacks foundation
- Exterior features: Composition roof; In-ground community pool; One shed; Close to clubhouse; Private paved road frontage; No fencing
Interior
- Kitchen: Gas cooktop; Free-standing range; Microwave; Dishwasher; Refrigerator; Water line to refrigerator
- Bedrooms: Primary suite with walk-in closet
- Flooring: Vinyl
- Bathrooms: Two full bathrooms; Soaking tub; Separate tub and shower; Shower in tub
- Heating & cooling: Central cooling; Central furnace
- Interior features: Ceiling fan; Recessed lighting; Open floor plan; Storage space; Energy Star doors; Double pane windows with blinds and screens; Resident manager
- Laundry & utility: Inside laundry room; Washer included; Dryer included; Gas dryer hookup
Neighborhood map
What this means for you Summary
Snapshot
- This is a 3-bed/2.0-bath manufactured listed at $199k. Condition is rated good.
Deal economics
- At list price, monthly cash flow is $1k ($16k/yr) — positive.
- The deal already cash-flows at list — no discount required.
- Meets the 1% rule at list price ($3k rent vs $199k).
- Cap rate 14.5% vs local median 2.3% in Orange — top-decile yield for the area; either an underpriced asset or a hidden risk that comps aren't pricing in. Stress-test before assuming the spread holds.
Location & tenants
- Location reads 73/100 on livability (#172 in CA) — a middle-class / working-renter tenant base. Strengths: amenities A+, employment A+, crime B; Watch: health & safety C-, cost of living F.
- Orange Unified (urban): math 39% / reading 60% proficiency, ranked #127 of 517 in CA (top 25%) — families likely to look elsewhere, expect single-tenant / working-renter base with shorter leases.
- Zoned schools: Taft Elementary (447 students, 93% FRL); Cerro Villa Middle (750 students, 59% FRL); Villa Park High (math 34% / reading 58%, grade D-, #409 of 1,170 statewide, top 36%, 2,110 students, 54% FRL) — zoned schools average 69% FRL vs 38% district-wide (31 pts higher); higher-poverty schools than district average — tighter screening recommended.
- Market conditions: 30 active listings in the ZIP; 23 comparable units currently listed for rent nearby; rentals at typical pace (median 17d on market — plan ~3-4 weeks tenant-placement turnaround); high-income renter base; 6,974 units permitted in Orange County in 2024 (3,839 in 5+ unit buildings).
- This rent runs 33% of the median local income ($127k/yr) — at the standard rent-burdened threshold; future hikes will face affordability resistance.
Forward outlook
- Local home prices are declining (-3.0%/yr); year-one equity from $1k of loan paydown is wiped out by about $6k of value loss. Plan a longer hold.
- Orange County population projected at +14% by 2050 — modest demand growth; plan on rents tracking national, not racing it.
- At projected returns (-3.0% appreciation + 3.0% rent growth), your $56k cash investment doubles in ~5 years — after that, you're playing with house money.
Negotiation context
- Only 3 days on market — expect competitive offers; lowballing is unlikely to land.
Risks & watch-outs
- Climate carrying-cost: extreme-heat days projected 7→22/yr by 2055 (HVAC capex compounding) — expect insurance premiums to compound above CPI over the hold.
Questions for the listing agent
- Is there a deadline driving the sale (1031 exchange, divorce, estate, relocation)? That informs how much negotiation room exists.
- What's the average days-on-market for RENTAL listings here right now (not sales)? A rising rental-DOM trend means longer vacancies and softer asking-rent achievability than the comps imply.
- What's the recent tenant-quality profile in this submarket — average credit score on applications, eviction rate, late-payment / NSF rate, and stable-employment percentage? A property-management company in the area should have these aggregated.
- How much new for-sale + rental construction is in the pipeline within 1–3 miles? Heavy new supply typically softens prices + rents 12–24 months out; constrained supply supports both.
Investment metrics
- 1% rule
- 1.74% ✓
- Cap rate
- 14.51%
- Cash-on-cash
- 29.33%
- DSCR
- 2.31
- GRM
- 4.8
CMA / ARV
- ARV (on-the-fly)
- $202,776
- Comps found
- 3
Show comp detail 3 sales within ~0.75 mi
| Address | Dist | Beds/Ba | Sqft | Sold | Price | $/sf | Match |
|---|---|---|---|---|---|---|---|
| 1931 E Meats Ave #172 | 0.03mi | 3/2.0 | 1,120 (-7%) | 18mo | $199,900 | $178 | 71 |
| 1931 E Meats Ave #54 | 0.03mi | 3/2.0 | 1,104 (-8%) | 20mo | $186,000 | $168 | 67 |
| 1931 E Meats Ave #161 | 0.03mi | 4/2.0 (+1) | 1,344 (+11%) | 16mo | $220,000 | $164 | 62 |
Match score weights: distance 35% · size 25% · config 20% · recency 20%. Top-matched comps best support the ARV.
Projected returns pro-forma
-3.0% appreciation · 3.0% rent growth · sell at horizon
- IRR
- 23.8%
- Equity multiple
- 1.98×
- Total profit
- $54,559
- Equity at exit
- $29,672
- IRR
- 31.7%
- Equity multiple
- 3.86×
- Total profit
- $159,430
- Equity at exit
- $17,206
Cash invested: $55,720 (down + closing). Projections, not guarantees.
Landlord ↔ Tenant lean methodology
- Overall (STATE)
- 18 Strongly Tenant-Friendly
- State California
- 18 Strongly Tenant-Friendly · D+13
- County
- — inherits STATE
- City
- — inherits STATE
ZIP-level market 92865
- Active inventory
- 30
- Price-to-rent
- 4.8×
Monthly cashflow live
- Estimated rent
- $3,465 high interval (Pro) →
- Mortgage (P&I)
- −$1,044
- Tax est. 1.5%
- −$249 /mo · $2,985/yr
- Insurance
- −$83
- HOA
- −$0
- Vacancy / Maint / Mgmt
- −$728
- Net cashflow
- $1,362
Break-even live
UW: 25.0% down · 7.5% · 30yr · 1.5% tax · 5.0% vac · 8.0% maint · 8.0% mgmt
Financing live
Cash to close
- Down payment
- $49,750
- Closing costs
- $5,970
- Reserves months
- —
- Total cash needed
- —
Loan-product check · same deal, 3 products live
Conventional
25% down · 7.5% · 30yr
- Down + closing
- —
- Monthly P&I
- —
- Monthly cashflow
- —
- DSCR
- —
- Eligible?
- —
Personal DTI + credit; lowest rate.
DSCR
20% down · 8.5% · 30yr
- Down + closing
- —
- Monthly P&I
- —
- Monthly cashflow
- —
- DSCR
- —
- Eligible?
- —
No personal income docs; deal must DSCR.
Hard money
10% down · 12.0% · 12mo
- Down + closing
- —
- Monthly P&I
- —
- Monthly cashflow
- —
- DSCR
- —
- Eligible?
- —
Short-term bridge; refi at stabilization.
Rent comps 23 comps
| Address | Beds | Baths | Sqft | Rent | $/sqft | DOM | Units | Dist |
|---|---|---|---|---|---|---|---|---|
| 2169 N Mori Ln Orange, CA | 3.0 | 2.0 | 1262 | $4,295 | $3.40 | 2d | 1 | 0.33mi |
| 1450 E Del Mar Ave Orange, CA | 2.0 | 2.0 | 1100 | $2,525 | $2.30 | 44d | 1 | 0.41mi |
| 1450 Grove Ave Orange, CA | 2.0–3.0 | 1.5–2.0 | 904 | $2,995 | $3.31 | 3d | 2 | 0.46mi |
| 1410 Grove Ave Unit 72 Orange, CA | 3.0 | 2.0 | 1054 | $2,995 | $2.84 | 3d | 1 | 0.49mi |
| 1410 Grove Ave Unit 64 Orange, CA | 2.0 | 1.5 | 754 | $2,685 | $3.56 | 4d | 1 | 0.49mi |
| 1410 Grove Ave Unit 56 Orange, CA | 2.0 | 2.0 | 870 | $2,700 | $3.10 | 24d | 1 | 0.49mi |
| 1410 Grove Ave Orange, CA | 2.0 | 1.5–2.0 | 812 | $2,635 | $3.25 | 44d | 3 | 0.49mi |
| 2627 N Bourbon St Orange, CA | 1.0–2.0 | 1.0 | 761 | $2,930 | $3.85 | 2d | 3 | 0.58mi |
| 1918 E Vanowen Ave Orange, CA | 2.0–3.0 | 1.5–2.5 | 1147 | $3,245 | $2.83 | 3d | 8 | 0.98mi |
| 16641 E Main St Unit B Orange, CA | 2.0 | 1.0 | 950 | $3,400 | $3.58 | 19d | 1 | 0.98mi |
| 338 E Meats Ave Orange, CA | 3.0 | 2.0 | 1100 | $3,985 | $3.62 | 4d | 1 | 0.99mi |
| 420 E Blueridge Ave Orange, CA | 2.0 | 1.0 | 950 | $2,600 | $2.74 | 24d | 1 | 1.04mi |
| 16572 E Buena Vista Ave Orange, CA | 3.0 | 2.0 | 1500 | $5,500 | $3.67 | 1d | 1 | 1.05mi |
| 243 E Blueridge Ave Orange, CA | 2.0 | 2.0 | 950 | $3,000 | $3.16 | 24d | 1 | 1.12mi |
| 339 E Taft Ave #2 Orange, CA | 2.0 | 2.0 | 1104 | $2,995 | $2.71 | 24d | 1 | 1.15mi |
| 1189 N Shattuck St Unit C Orange, CA | 2.0 | 1.5 | 1100 | $2,900 | $2.64 | 17d | 1 | 1.21mi |
| 1172 N Shattuck St Orange, CA | 2.0–3.0 | 1.5–2.5 | 1140 | $3,595 | $3.15 | 44d | 2 | 1.24mi |
| 109 N Merrimac Dr Apt D Anaheim, CA | 2.0 | 1.0 | 950 | $2,200 | $2.32 | 44d | 1 | 1.25mi |
| 1139 N Shattuck St Unit C Orange, CA | 3.0 | 2.0 | 1350 | $3,550 | $2.63 | 24d | 1 | 1.27mi |
| 501 E Katella Ave Orange, CA | 2.0 | 2.0 | 1200 | $3,480 | $2.90 | 2d | 2 | 1.32mi |
| 1056 N Lincoln St Unit 1 Orange, CA | 2.0 | 2.0 | 714 | $2,700 | $3.78 | 11d | 1 | 1.40mi |
| 1056 N Lincoln St Orange, CA | 2.0 | 2.0 | 714 | $2,700 | $3.78 | 4d | 1 | 1.40mi |
| 1491 N Glassell St Unit 471D Orange, CA | 2.0 | 2.0 | 1080 | $3,190 | $2.95 | 44d | 1 | 1.46mi |
Listing history 4 events
-
2026-06-09days on market $199,000 Active 3 DOM
-
2026-06-08days on market $199,000 Active 2 DOM
-
2026-06-07remarks 699-char remark
-
2026-06-07$199,000 Active 1 DOM
ⓘ Source: listings_history table (triggers on properties + properties_extension) + one-shot
backfill from property_details.listing_events for pre-trigger history.
Climate risk First Street
- Flood 1/10 Low FEMA zone X (unshaded) · 0% chance over 30 yrs
- Wildfire 1/10 Low
- Heat 6/10 Major 7 d/yr ≥95°F today · 22 d/yr by 30 yrs out
- Wind 1/10 Low
- Air quality 5/10 Major 7 unhealthy d/yr today · 9 by 30 yrs out
Nearby sold comps map
Loading sold comps map…
Walkable amenities ~0.75 mi
Loading nearby amenities…
Taxation est. · year 1
- Rental income
- $41,580
- − Mortgage interest
- −$11,147
- − Property taxes
- −$2,985
- − Insurance
- −$995
- − Repairs & maintenance
- −$3,326
- − Management
- −$3,326
- − Depreciation
- −$5,789
- Taxable income
- $14,011
- Est. tax owed @ 24.0%
- −$3,363
- After-tax cash flow
- $12,983/yr
For passive investors: Depreciation is non-cash, so a rental often shows a tax loss while cash-flowing — sheltering income. Rental losses are passive: they offset passive income freely, and up to $25,000/yr can offset ordinary (W-2) income if you actively participate and your MAGI is under $100k (phasing out to $0 by $150k); unused losses carry forward. On sale, claimed depreciation is recaptured at up to 25%, and gains may owe capital-gains tax (a 1031 exchange can defer both). Figures are a year-1 estimate at your 24.0% rate — not tax advice; consult a CPA.
Condition & rehab AI · 14 photos
This home is in good condition with a good condition score of 80. It has a good kitchen, bathrooms, exterior, flooring, interior walls/paint, windows, foundation/structure, HVAC/mechanicals, and landscaping/curb appeal. The home is move-in ready and has a good rehab level of cosmetic. The highest-ROI updates that would raise its resale or rental value are painting the exterior siding and replacing the artificial grass with real grass.
Value-add opportunities
- Resale Paint the exterior siding — A fresh coat of paint can enhance the curb appeal and make the home look more inviting to potential buyers.
- Rental Replace the artificial grass with real grass — Real grass can add value to a rental property by making the home more appealing to tenants.
Renovation cost estimate screening
Value-add ROI direction
- Resale Paint the exterior siding — A fresh coat of paint can enhance the curb appeal and make the home look more inviting to potential buyers. ↑
- Rental Replace the artificial grass with real grass — Real grass can add value to a rental property by making the home more appealing to tenants. ↑
ⓘ Cost ranges are severity-bucket heuristics (US national rule-of-thumb). Get contractor quotes + a written scope before underwriting a rehab budget.
Schools (NCES district)
- District
- Orange Unified
- NCES district ID
- 0628650
- Math proficiency
- 39% ▼ -6.00%
- Reading proficiency
- 60% ▲ 3.00%
- Median HH income
- $83,557
- Composite
- 45.5/100
- National rank
- #2609
- State rank
- #127 of 517 in CA
Livability — Orange
- Score
- 73/100
- State rank
- #172
- US rank
- #5560
Category grades
Schools grade is shown separately in the Schools card above.
Census & demographics
- Census place
- Orange, CA
- County
- Orange County · 3,096,323 people
- City population
- 143,297
- Metro
- Los Angeles-Long Beach-Anaheim, CA
- Population (ZIP)
- 20,589
- Household income
- $127,431
- Rent vs Own
- Severe rent burden
- 493.0
Population outlook (Orange County) Hauer SSP2
- Today (2025)
- 3,477,456 people
- By 2030
- 3,613,117 · +3.9%
- By 2040
- 3,835,945 · +10.3%
- By 2050
- 3,968,736 · +14.1%
- By 2075
- 4,097,053 · +17.8%
- By 2100
- 3,903,633 · +12.3%
Race, ethnicity, and origin ACS 2023
- Neighborhood character
- Diverse neighborhood (Simpson 0.69)
- Race & ethnicity
- Hispanic / Latino 40% White 36% Two or more races 17% Asian 15% Native American 1%
- Hispanic origin (detail)
- Mexican 33%
- Common ancestry
- Slovak 2% Italian 2% Romanian 2%
- Foreign-born
- 22% · Canada, China, Vietnam
- Languages at home
- 61% English-only · Spanish 26% Vietnamese 3% Chinese 2%
Political lean MEDSL · Orange
- 2024 margin
- Toss-up / Even · D 49.7% · R 47.1% · Other 3.2%
- 2008→2024 swing
- +5.2pp toward D · 2008: -2.6pp · 2024: 2.6pp
- All cycles
- 2024: D+2.6 2020: D+9.0 2016: D+7.7 2012: R+8.3 2008: R+2.6
Not yet ingested
- Civics
- —
Market trends
- HPI YoY
- ▼ -693.98%
- Current HPI
- 458.5534
- Rent YoY
- —
- Metro
- Los Angeles-Long Beach-Anaheim, CA
- State GDP YoY
- ▲ 3.21%
- F500 in state
- 116
Industry mix (Fortune 500 HQ in CA)
| Industry | F500 HQs | Revenue |
|---|---|---|
| Technology | 27 | $1,492B |
|
||
| Financial Services | 3 | $174B |
|
||
| Retail | 3 | $44B |
|
||
| Insurance | 3 | $26B |
|
||
| Media / Entertainment | 2 | $115B |
|
||
| Pharmaceuticals / Biotech | 2 | $62B |
|
||
Price history
1 event — show timeline
- 2026-06-06 Listed $199,000 CRMLS
Cash-flow waterfall
monthlySold comps — $/sqft
last 12 mo · ≤1 miLoading sold comps…