2430 Pink Pearl · San Antonio, TX
Flood risk 1/10 · Minimal
- FEMA flood zone
- X (unshaded)
- Chance of flooding over 30 yrs
- 0.0%
- Est. flood insurance / yr
- $507 – $1,088
Fire risk 5/10 · Moderate
- Est. fire insurance / yr
- $1,222 – $2,270
Heat risk 8/10 · Major
- Hot days now (above 109°F)
- 6 days/yr
- Hot days in 30 yrs
- 18 days/yr
Wind risk 8/10 · Major
- Chance of severe wind over 30 yrs
- 80.0%
Air-quality risk 2/10 · Minimal
- Unhealthy air days now
- 0 days/yr
- Unhealthy air days in 30 yrs
- 1 days/yr
Risk factors via First Street. Map © Google.
Why this score? — see what drove the D grade
The composite is a weighted blend of 9 inputs, each scored 0–100. Each bar is that input's sub-score; the figure is the points it added to the 100-point composite (weight × sub-score).
- ARV discount +13.8/15.0
- Appreciation +10.0/10.0
- Cash flow +5.9/30.0
- Livability +4.0/5.0
- 1% rule +3.2/10.0
- Rent growth +2.7/5.0
- Condition / age +2.5/5.0
- Schools +2.2/10.0
- DSCR +0.3/10.0
$239,900
🖨 Deal sheet (PDF) 📄 Offer letter ✓ Due diligence
Listing remarks MLS
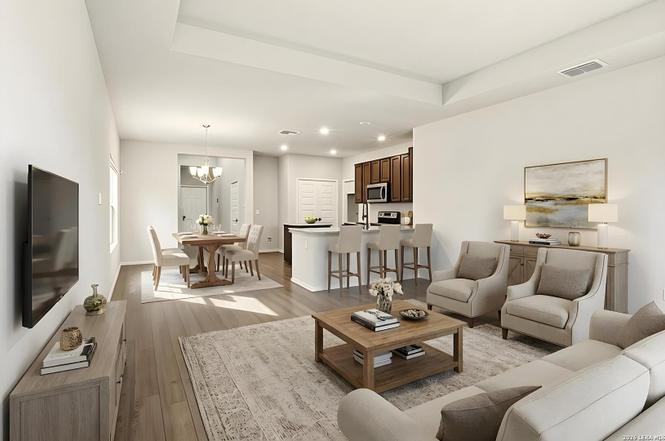
Ready Now! Love where you live in Applewhite Meadows in San Antonio, TX! Conveniently located off SH16, with easy access to IH410 & IH35, Applewhite Meadows makes commuting to Toyota, Lackland AFB, Palo Alto College, and Texas A&M University a breeze! The Fulton floor plan is a stunning two-story home with soaring ceilings in the foyer! Complete with 4 bedrooms, 2.5 baths, game room, and 2-car garage. This home has it all, including tray ceilings in the family room for some dramatic flair! The gourmet kitchen is sure to please with an island, 42-inch cabinetry, and granite countertops. Retreat to the first-floor Owner's Suite featuring a boxed-out window, double sinks, a sizable shower, and a walk-in closet. Enjoy the great outdoors with a covered patio! Don't miss your opportunity to call Applewhite Meadows home, schedule a visit today!
Key facts
- Large kitchen island
- Open floorplan
- Granite countertops
Tags
Property features AI
Finance
- Financial info: Down payment resources available
- HOA & community: Mandatory HOA with $450 annual fee; Association transfer fee $220; Community amenities include a pool, park/playground, and jogging trails; Subdivision: Applewhite Meadows
Exterior
- Parking: 2-car garage
- Security: Owned security system
- Utilities: City water and sewer; Electric service via CPS
- Home design: Pre-owned single-family home; Built by Legend Homes (approx. 5 years old)
- Construction: Brick and cement fiber exterior; Composition roof; Slab foundation
- Exterior features: Covered patio; Privacy fence; Sprinkler system; Double pane windows
Interior
- Kitchen: Stove/Range; Dishwasher; Ice maker connection; Island and breakfast bar; Solid countertops
- Bedrooms: Master bedroom on lower level with walk-in closet and full bath; Second bedroom (14 x 11); Third bedroom (13 x 10); Fourth bedroom (13 x 11); Master bedroom dimensions 15 x 17
- Flooring: Carpeting; Vinyl flooring
- Bathrooms: Total of 3 bathrooms (2 full, 1 half); Master bath with shower only and double vanity (10 x 11)
- Heating & cooling: Central heating (electric); Central air conditioning (1 unit)
- Interior features: Two living areas; Living/dining room combination; Island kitchen with breakfast bar; Game room; High ceilings; Cable TV available; Some window coverings remain; Security system (owned); Water softener plumbing; Solid countertops; City garbage service; Electric water heater
- Laundry & utility: Washer connection; Dryer connection; Laundry room on main level; Utility room (9 x 6)
Neighborhood map
What this means for you Summary
Snapshot
- This is a 4-bed/2.5-bath single-family listed at $240k.
Deal economics
- At list price, monthly cash flow is $-467 ($-6k/yr) — negative.
- To cash-flow at today's rent, offer at most $157k (34.4% below list).
- To meet the 1% rule (rent ≥ 1% of price), the offer needs to be $196k (18.2% below list).
- Recommended offer: $157k (34.4% below list) — sets the bar for cash-flow.
Location & tenants
- Location reads 80/100 on livability (#31 in TX, #1,616 nationally) — a professional / high-income tenant draw. Strengths: amenities A+, commute A+, cost of living A+; Watch: crime F.
- Southwest ISD (rural): math 21% / reading 31% proficiency, ranked #701 of 826 in TX (top 85%) — low school quality limits family demand, transient renter base, plan for 1-2y turnover; 75% free/reduced lunch — lower-income household profile, screen leases tightly.
- Zoned schools: Spicewood Park El (math 16% / reading 23%, grade F, #3,583 of 4,322 statewide, top 86%, 593 students, 93% FRL); Southwest H S (math 17% / reading 39%, grade F, #1,170 of 1,632 statewide, top 72%, 2,152 students, 72% FRL).
- Market conditions: Rents flat; 276 active listings in the ZIP; 40 comparable units currently listed for rent nearby; rentals at typical pace (median 25d on market — plan ~3-4 weeks tenant-placement turnaround); 45% of comp listings sitting > 30 days — soft ceiling on asking rent; 8,308 units permitted in Bexar County in 2024 (2,506 in 5+ unit buildings).
- This rent runs 39% of the median local income ($60k/yr) — at the standard rent-burdened threshold; future hikes will face affordability resistance.
Forward outlook
- In year one you build about $26k of equity ($2k loan paydown + $24k appreciation (10.0% local appreciation)).
- Bexar County population projected at +50% by 2050 — long-run rental-demand tailwind backs the buy-and-hold thesis.
- By year 2, paydown + projected appreciation supports a ~$41k cash-out refi (75% LTV) — recoverable capital for the next deal without selling this one.
Negotiation context
- It's been on market 154 days — a 12% lower offer ($211k) is reasonable based on typical stale-listing flexibility.
- 8 sale attempts since 5y ago; this cycle's ask has dropped $15k (6%) from the opening price — seller is motivated, your offer sets the floor, not the list.
Risks & watch-outs
- Watch-outs: property tax is 3.1% of price.
- Climate carrying-cost: severe wind risk, 80% chance of damaging wind over 30y; moderate wildfire risk; extreme-heat days projected 6→18/yr by 2055 (HVAC capex compounding) — expect insurance premiums to compound above CPI over the hold.
Questions for the listing agent
- What do current leases actually rent for vs. the listed asking? Can we see a recent rent roll and the last 12 months of T-12 income?
- It's been on market 154 days. Have you received any prior offers? Is the seller open to a 34% concession, seller financing, or rate buy-down credit?
- Property tax is high relative to price — has the assessment been appealed recently, and will the sale trigger a re-assessment?
- What does the HOA fee cover, when was the last increase, and are there any pending special assessments or reserve-fund shortfalls?
- Why hasn't it sold? Are there any deal-killer items the seller is aware of (foundation, flood, title, zoning, code violations)?
- Is there a deadline driving the sale (1031 exchange, divorce, estate, relocation)? That informs how much negotiation room exists.
- Crime grade is F in this area — have there been break-ins, vandalism, or insurance claims at this property in the last 3 years? What carrier currently insures it and at what premium?
- The area grade is low — what's the realistic commute time and amenity access for the typical tenant pool here? Any planned neighborhood developments (good or bad) we should know about?
- What's the average days-on-market for RENTAL listings here right now (not sales)? A rising rental-DOM trend means longer vacancies and softer asking-rent achievability than the comps imply.
- What's the recent tenant-quality profile in this submarket — average credit score on applications, eviction rate, late-payment / NSF rate, and stable-employment percentage? A property-management company in the area should have these aggregated.
- How much new for-sale + rental construction is in the pipeline within 1–3 miles? Heavy new supply typically softens prices + rents 12–24 months out; constrained supply supports both.
Investment metrics
- 1% rule
- 0.82% ✗
- Cap rate
- 3.96%
- Cash-on-cash
- -8.35%
- DSCR
- 0.63
- GRM
- 10.2
CMA / ARV
- ARV (on-the-fly)
- $279,030
- Comps found
- 12
Show comp detail 12 sales within ~0.75 mi
| Address | Dist | Beds/Ba | Sqft | Sold | Price | $/sf | Match |
|---|---|---|---|---|---|---|---|
| 10323 Liberty Grv | 0.18mi | 4/2.5 | 2,111 (-1%) | 1mo | $306,255 | $145 | 89 |
| 2306 Crisp Gln | 0.22mi | 4/2.5 | 2,260 (+6%) | 1mo | $319,990 | $142 | 79 |
| 10826 Apple Pie Rd | 0.24mi | 4/2.5 | 1,900 (-11%) | 0mo | $312,851 | $165 | 71 |
| 2222 Dry Moss Way | 0.31mi | 4/2.5 | 2,382 (+12%) | 1mo | $254,999 | $107 | 65 |
| 10710 Marlin Pond | 0.58mi | 4/2.0 | 2,193 (+3%) | 1mo | $252,999 | $115 | 65 |
| 10602 Red Shiner Run | 0.63mi | 4/3.0 | 2,202 (+3%) | 1mo | $266,999 | $121 | 62 |
| 1422 Caceres Spur | 0.66mi | 4/3.0 | 2,288 (+7%) | 1mo | $302,999 | $132 | 54 |
| 10711 Red Shiner Run | 0.59mi | 4/2.5 | 1,885 (-12%) | 1mo | $264,999 | $141 | 52 |
| 10615 Red Shiner Run | 0.60mi | 4/3.0 | 2,370 (+11%) | 1mo | $272,999 | $115 | 51 |
| 10715 Red Shiner Run | 0.59mi | 4/2.0 | 1,850 (-13%) | 1mo | $232,999 | $126 | 48 |
| 10303 Mission Arc | 0.64mi | 3/2.5 (-1) | 1,914 (-10%) | 1mo | $226,000 | $118 | 48 |
| 10315 Bluegill Way | 0.70mi | 3/2.0 (-1) | 1,896 (-11%) | 1mo | $248,999 | $131 | 42 |
Match score weights: distance 35% · size 25% · config 20% · recency 20%. Top-matched comps best support the ARV.
Projected returns pro-forma
10.0% appreciation · 0.83% rent growth · sell at horizon
- IRR
- 17.8%
- Equity multiple
- 2.44×
- Total profit
- $96,952
- Equity at exit
- $216,121
- IRR
- 16.2%
- Equity multiple
- 5.49×
- Total profit
- $301,630
- Equity at exit
- $466,073
Cash invested: $67,172 (down + closing). Projections, not guarantees.
Landlord ↔ Tenant lean methodology
- Overall (STATE)
- 87 Strongly Landlord-Friendly
- State Texas
- 87 Strongly Landlord-Friendly · R+5
- County
- — inherits STATE
- City
- — inherits STATE
ZIP-level market 78224
- Home prices YoY
- 12.4%
- Rents YoY
- 0.8%
- Active inventory
- 276
- Price-to-rent
- 10.2×
Monthly cashflow live
- Estimated rent
- $1,963 high interval (Pro) →
- Mortgage (P&I)
- −$1,258
- Tax from tax record
- −$622 /mo · $7,463/yr
- Insurance
- −$100
- HOA
- −$38
- Vacancy / Maint / Mgmt
- −$412
- Net cashflow
- $-467
Break-even live
Sensitivity live
| Price | -10% $-331 | -5% $-399 | +0% $-467 | +5% $-535 | +10% $-603 |
|---|---|---|---|---|---|
| Rent | -10% $-622 | -5% $-545 | +0% $-467 | +5% $-390 | +10% $-312 |
| Rate | -1.0pp $-346 | -0.5pp $-406 | base $-467 | +0.5pp $-529 | +1.0pp $-593 |
UW: 25.0% down · 7.5% · 30yr · 1.5% tax · 5.0% vac · 8.0% maint · 8.0% mgmt
Financing live
Cash to close
- Down payment
- $59,975
- Closing costs
- $7,197
- Reserves months
- —
- Total cash needed
- —
Loan-product check · same deal, 3 products live
Conventional
25% down · 7.5% · 30yr
- Down + closing
- —
- Monthly P&I
- —
- Monthly cashflow
- —
- DSCR
- —
- Eligible?
- —
Personal DTI + credit; lowest rate.
DSCR
20% down · 8.5% · 30yr
- Down + closing
- —
- Monthly P&I
- —
- Monthly cashflow
- —
- DSCR
- —
- Eligible?
- —
No personal income docs; deal must DSCR.
Hard money
10% down · 12.0% · 12mo
- Down + closing
- —
- Monthly P&I
- —
- Monthly cashflow
- —
- DSCR
- —
- Eligible?
- —
Short-term bridge; refi at stabilization.
Rent comps 40 comps
| Address | Beds | Baths | Sqft | Rent | $/sqft | DOM | Units | Dist |
|---|---|---|---|---|---|---|---|---|
| 2434 Dry Moss Way San Antonio, TX | 4.0 | 2.5 | 2417 | $2,500 | $1.03 | 3d | 1 | 0.08mi |
| 2350 Dry Moss Way San Antonio, TX | 3.0 | 2.5 | 1420 | $1,650 | $1.16 | 45d | 1 | 0.12mi |
| 2343 Applewhite Mdw San Antonio, TX | 4.0 | 2.5 | 1798 | $1,795 | $1.00 | 25d | 1 | 0.19mi |
| 2335 Applewhite Mdw San Antonio, TX | 3.0 | 2.5 | 1529 | $1,550 | $1.01 | 5d | 1 | 0.20mi |
| 2318 Applewhite Mdw San Antonio, TX | 4.0 | 2.5 | 1798 | $1,795 | $1.00 | 25d | 1 | 0.20mi |
| 2350 Redlove Dr San Antonio, TX | 3.0 | 2.5 | 1420 | $1,675 | $1.18 | 25d | 1 | 0.20mi |
| 2330 Redlove Dr San Antonio, TX | 3.0 | 2.5 | 1420 | $1,600 | $1.13 | 5d | 1 | 0.22mi |
| 2307 Applewhite Mdw San Antonio, TX | 4.0 | 2.5 | 1798 | $1,750 | $0.97 | 45d | 1 | 0.23mi |
| 2242 Fishing Trl San Antonio, TX | 4.0 | 2.5 | 1917 | $1,785 | $0.93 | 45d | 1 | 0.29mi |
| 2235 Fishing Trl San Antonio, TX | 4.0 | 2.5 | 1847 | $1,755 | $0.95 | 45d | 1 | 0.31mi |
| 2230 Fishing Trl San Antonio, TX | 4.0 | 2.5 | 1847 | $1,755 | $0.95 | 25d | 1 | 0.32mi |
| 2226 Fishing Trl San Antonio, TX | 3.0 | 2.5 | 1777 | $1,650 | $0.93 | 25d | 1 | 0.33mi |
| 2222 Fishing Trl San Antonio, TX | 4.0 | 2.5 | 1917 | $1,785 | $0.93 | 25d | 1 | 0.34mi |
| 10527 Hunters Pond San Antonio, TX | 4.0 | 2.5 | 1510 | $1,395 | $0.92 | 45d | 1 | 0.35mi |
| 10719 Butterfly Pass San Antonio, TX | 3.0 | 2.5 | 1645 | $1,640 | $1.00 | 45d | 1 | 0.44mi |
| 10723 Butterfly Pass San Antonio, TX | 4.0 | 2.5 | 1687 | $1,675 | $0.99 | 45d | 1 | 0.44mi |
| 10710 Butterfly Pass San Antonio, TX | 4.0 | 2.5 | 1917 | $1,785 | $0.93 | 45d | 1 | 0.46mi |
| 10723 Goose Way San Antonio, TX | 4.0 | 2.5 | 1917 | $1,785 | $0.93 | 45d | 1 | 0.49mi |
| 2115 Bigmouth Rod San Antonio, TX | 4.0 | 2.5 | 1847 | $1,755 | $0.95 | 45d | 1 | 0.49mi |
| 10523 Goose Way San Antonio, TX | 4.0 | 2.5 | 1917 | $1,785 | $0.93 | 45d | 1 | 0.49mi |
| 2111 Bigmouth Rod San Antonio, TX | 4.0 | 2.5 | 1917 | $1,700 | $0.89 | 45d | 1 | 0.49mi |
| 2107 Bigmouth Rod San Antonio, TX | 3.0 | 2.5 | 1777 | $1,675 | $0.94 | 45d | 1 | 0.50mi |
| 10811 Soupe CV San Antonio, TX | 4.0 | 2.5 | 2173 | $1,995 | $0.92 | 4d | 1 | 0.65mi |
| 1347 Neria LOOP San Antonio, TX | 4.0 | 2.5 | 2173 | $1,699 | $0.78 | 45d | 1 | 0.65mi |
| 12305 SW Loop 410 San Antonio, TX | 1.0–4.0 | 1.0–2.0 | 1036 | $1,607 | $1.55 | 17d | 1 | 0.91mi |
| 3263 Rancho Grande San Antonio, TX | 3.0 | 2.0 | 1500 | $1,650 | $1.10 | 25d | 1 | 0.92mi |
| 3322 Rancho Grande San Antonio, TX | 4.0 | 2.5 | 2094 | $1,895 | $0.90 | 12d | 1 | 0.97mi |
| 10119 Jardin Verde San Antonio, TX | 3.0 | 2.5 | 1944 | $1,750 | $0.90 | 45d | 1 | 1.02mi |
| 1451 Neria Loop Unit 3 San Antonio, TX | 4.0 | 3.0 | 1867 | $700 | $0.37 | 13d | 1 | 1.04mi |
| 10823 Bernal Cv San Antonio, TX | 4.0 | 2.0 | 1600 | $2,000 | $1.25 | 3d | 1 | 1.05mi |
| 10807 Bernal Cv San Antonio, TX | 4.0 | 2.0 | 1575 | $1,700 | $1.08 | 17d | 1 | 1.05mi |
| 10611 Vesta Curv San Antonio, TX | 4.0 | 2.0 | 1627 | $1,735 | $1.07 | 5d | 1 | 1.08mi |
| 10414 Espada Pass San Antonio, TX | 3.0 | 2.0 | 1416 | $1,600 | $1.13 | 45d | 1 | 1.10mi |
| 10622 Vesta Curv San Antonio, TX | 4.0 | 2.0 | 1627 | $1,725 | $1.06 | 5d | 1 | 1.10mi |
| 3331 Rosita Way San Antonio, TX | 3.0 | 2.5 | 1848 | $1,800 | $0.97 | 45d | 1 | 1.12mi |
| 3434 Hacienda Way San Antonio, TX | 4.0 | 2.5 | 2141 | $1,900 | $0.89 | 17d | 1 | 1.15mi |
| 3434 Hacienda Way San Antonio, TX | 4.0 | 2.5 | 2141 | $2,000 | $0.93 | 23d | 1 | 1.15mi |
| 10542 Nye Pass San Antonio, TX | 3.0 | 2.0 | 1440 | $1,595 | $1.11 | 45d | 1 | 1.15mi |
| 3411 Avoca Dr San Antonio, TX | 3.0 | 2.0 | 1426 | $1,460 | $1.02 | 5d | 1 | 1.18mi |
| 3411 Avoca Dr San Antonio, TX | 3.0 | 2.0 | 1426 | $1,460 | $1.02 | 19d | 1 | 1.18mi |
HOA detail
- Monthly dues
- $38 · $456/yr
Listing history 33 events
-
2026-05-01status Pending
-
2026-04-25historical Active Option
-
2026-02-23price $239,900
-
2025-11-28$255,000 New
-
2025-06-28historical
-
2025-03-08price $315,000
-
2025-03-06$325,000 New
-
2023-09-18soldstatus Sold 857-char remark
Show marketing remark (857 chars)
Ready Now! Love where you live in Applewhite Meadows in San Antonio, TX! Conveniently located off SH16, with easy access to IH410 & IH35, Applewhite Meadows makes commuting to Toyota, Lackland AFB, Palo Alto College, and Texas A&M University a breeze! The Fulton floor plan is a stunning two-story home with soaring ceilings in the foyer! Complete with 4 bedrooms, 2.5 baths, game room, and 2-car garage. This home has it all, including tray ceilings in the family room for some dramatic flair! The gourmet kitchen is sure to please with an island, 42-inch cabinetry, and granite countertops. Retreat to the first-floor Owner's Suite featuring a boxed-out window, double sinks, a sizable shower, and a walk-in closet. Enjoy the great outdoors with a covered patio! Don't miss your opportunity to call Applewhite Meadows home, schedule a visit today!
-
2023-08-08status Pending 857-char remark
Show marketing remark (857 chars)
Ready Now! Love where you live in Applewhite Meadows in San Antonio, TX! Conveniently located off SH16, with easy access to IH410 & IH35, Applewhite Meadows makes commuting to Toyota, Lackland AFB, Palo Alto College, and Texas A&M University a breeze! The Fulton floor plan is a stunning two-story home with soaring ceilings in the foyer! Complete with 4 bedrooms, 2.5 baths, game room, and 2-car garage. This home has it all, including tray ceilings in the family room for some dramatic flair! The gourmet kitchen is sure to please with an island, 42-inch cabinetry, and granite countertops. Retreat to the first-floor Owner's Suite featuring a boxed-out window, double sinks, a sizable shower, and a walk-in closet. Enjoy the great outdoors with a covered patio! Don't miss your opportunity to call Applewhite Meadows home, schedule a visit today!
-
2023-07-28$269,990 New 857-char remark
Show marketing remark (857 chars)
Ready Now! Love where you live in Applewhite Meadows in San Antonio, TX! Conveniently located off SH16, with easy access to IH410 & IH35, Applewhite Meadows makes commuting to Toyota, Lackland AFB, Palo Alto College, and Texas A&M University a breeze! The Fulton floor plan is a stunning two-story home with soaring ceilings in the foyer! Complete with 4 bedrooms, 2.5 baths, game room, and 2-car garage. This home has it all, including tray ceilings in the family room for some dramatic flair! The gourmet kitchen is sure to please with an island, 42-inch cabinetry, and granite countertops. Retreat to the first-floor Owner's Suite featuring a boxed-out window, double sinks, a sizable shower, and a walk-in closet. Enjoy the great outdoors with a covered patio! Don't miss your opportunity to call Applewhite Meadows home, schedule a visit today!
-
2023-07-28historical
Show marketing remark (857 chars)
Ready Now! Love where you live in Applewhite Meadows in San Antonio, TX! Conveniently located off SH16, with easy access to IH410 & IH35, Applewhite Meadows makes commuting to Toyota, Lackland AFB, Palo Alto College, and Texas A&M University a breeze! The Fulton floor plan is a stunning two-story home with soaring ceilings in the foyer! Complete with 4 bedrooms, 2.5 baths, game room, and 2-car garage. This home has it all, including tray ceilings in the family room for some dramatic flair! The gourmet kitchen is sure to please with an island, 42-inch cabinetry, and granite countertops. Retreat to the first-floor Owner's Suite featuring a boxed-out window, double sinks, a sizable shower, and a walk-in closet. Enjoy the great outdoors with a covered patio! Don't miss your opportunity to call Applewhite Meadows home, schedule a visit today!
-
2023-07-25price $269,990
-
2023-06-21price $299,990
-
2023-05-05price $314,990
-
2023-04-05price $315,401
-
2023-03-24$330,401 New
-
2023-03-24historical
-
2022-11-01price $330,401
-
2022-11-01price $314,990
-
2022-10-27$324,990 New
-
2022-10-27historical
-
2022-09-01price $324,990
-
2022-06-10historical
-
2022-06-10$337,260 New
-
2022-05-24price $337,260
-
2022-05-03price $337,002
-
2022-04-18price $335,002
-
2022-04-09price $332,002
-
2022-04-08status Back on Market
-
2022-02-14historical
-
2022-01-15price $314,483
-
2022-01-05price $312,483
-
2021-11-15$310,164 New
ⓘ Source: listings_history table (triggers on properties + properties_extension) + one-shot
backfill from property_details.listing_events for pre-trigger history.
Tax reassessment forecast TX · Resets to sale price
- Current annual tax
- $7,463 · $622/mo
- Projected year-2 tax
- $7,463 · $622/mo
- Expected delta
- $0/yr ($0/mo · 0.0%)
ⓘ Screening estimate from a state-policy table — verify with the county assessor before closing.
Climate risk First Street
- Flood 1/10 Low FEMA zone X (unshaded) · 0% chance over 30 yrs
- Wildfire 5/10 Major
- Heat 8/10 Severe 6 d/yr ≥109°F today · 18 d/yr by 30 yrs out
- Wind 8/10 Severe 80% chance of damaging wind over 30 yrs
- Air quality 2/10 Low 0 unhealthy d/yr today · 1 by 30 yrs out
Nearby sold comps map
Loading sold comps map…
Walkable amenities ~0.75 mi
Loading nearby amenities…
Taxation est. · year 1
- Rental income
- $23,555
- − Mortgage interest
- −$13,438
- − Property taxes
- −$7,463
- − Insurance
- −$1,200
- − Repairs & maintenance
- −$1,884
- − Management
- −$1,884
- − HOA
- −$456
- − Depreciation
- −$6,979
- Taxable loss
- −$9,750
- Est. tax savings @ 24.0%
- +$2,340
- After-tax cash flow
- $-3,267/yr
For passive investors: Depreciation is non-cash, so a rental often shows a tax loss while cash-flowing — sheltering income. Rental losses are passive: they offset passive income freely, and up to $25,000/yr can offset ordinary (W-2) income if you actively participate and your MAGI is under $100k (phasing out to $0 by $150k); unused losses carry forward. On sale, claimed depreciation is recaptured at up to 25%, and gains may owe capital-gains tax (a 1031 exchange can defer both). Figures are a year-1 estimate at your 24.0% rate — not tax advice; consult a CPA.
Schools (NCES district)
- District
- Southwest ISD
- NCES district ID
- 4840950
- Math proficiency
- 21% ▼ -21.00%
- Reading proficiency
- 31% ▼ -5.00%
- Median HH income
- $43,362
- Composite
- 22.22/100
- National rank
- #8153
- State rank
- #701 of 826 in TX
Livability — San Antonio
- Score
- 80/100
- State rank
- #31
- US rank
- #1616
Category grades
Schools grade is shown separately in the Schools card above.
Census & demographics
- Census place
- San Antonio, TX
- County
- Bexar County · 1,990,555 people
- City population
- 1,806,925
- Metro
- San Antonio-New Braunfels, TX
- Population (ZIP)
- 22,232
- Household income
- $59,891
- Rent vs Own
- Severe rent burden
- 721.0
Population outlook (Bexar County) Hauer SSP2
- Today (2025)
- 2,336,851 people
- By 2030
- 2,560,728 · +9.6%
- By 2040
- 3,020,569 · +29.3%
- By 2050
- 3,493,522 · +49.5%
- By 2075
- 4,668,459 · +99.8%
- By 2100
- 5,533,242 · +136.8%
Race, ethnicity, and origin ACS 2023
- Neighborhood character
- Predominantly Hispanic (90%)
- Race & ethnicity
- Hispanic / Latino 90% Two or more races 24% White 6% Native American 2% Asian 2%
- Hispanic origin (detail)
- Mexican 75%
- Common ancestry
- Italian 1%
- Foreign-born
- 18% · Canada, Vietnam, China
- Languages at home
- 44% English-only · Spanish 55% Chinese 1%
Political lean MEDSL · Bexar
- 2024 margin
- Lean D (+9.8) · D 54.3% · R 44.6% · Other 1.1%
- 2008→2024 swing
- +4.2pp toward D · 2008: 5.6pp · 2024: 9.8pp
- All cycles
- 2024: D+9.8 2020: D+18.2 2016: D+13.5 2012: D+4.6 2008: D+5.6
Not yet ingested
- Civics
- —
Market trends
- HPI YoY
- ▲ 29.95%
- Current HPI
- 272.0709
- Rent YoY
- ▲ 0.83%
- Metro
- San Antonio-New Braunfels, TX
- State GDP YoY
- ▲ 3.95%
- F500 in state
- 110
Industry mix (Fortune 500 HQ in TX)
| Industry | F500 HQs | Revenue |
|---|---|---|
| Energy | 16 | $1,198B |
|
||
| Technology | 5 | $198B |
|
||
| Engineering / Construction | 4 | $72B |
|
||
| Energy Services | 3 | $60B |
|
||
| Utilities | 3 | $41B |
|
||
| Healthcare | 2 | $330B |
|
||
Price history
-22.7% since first listed33 events — show timeline
- 2026-05-01 Pending — LERA
- 2026-04-25 Contingent — LERA
- 2026-02-23 Price Changed $239,900 LERA
- 2025-11-28 Listed $255,000 LERA
- 2025-06-28 Listing Removed — LERA
- 2025-03-08 Price Changed $315,000 LERA
- 2025-03-06 Listed $325,000 LERA
- 2023-09-18 Sold (MLS) — LERA
- 2023-08-08 Pending — LERA
- 2023-07-28 Listing Removed — LERA
- 2023-07-28 Listed $269,990 LERA
- 2023-07-25 Price Changed $269,990 LERA
- 2023-06-21 Price Changed $299,990 LERA
- 2023-05-05 Price Changed $314,990 LERA
- 2023-04-05 Price Changed $315,401 LERA
- 2023-03-24 Listing Removed — LERA
- 2023-03-24 Listed $330,401 LERA
- 2022-11-01 Price Changed $314,990 LERA
- 2022-11-01 Price Changed $330,401 LERA
- 2022-10-27 Listing Removed — LERA
- 2022-10-27 Listed $324,990 LERA
- 2022-09-01 Price Changed $324,990 LERA
- 2022-06-10 Listing Removed — LERA
- 2022-06-10 Listed $337,260 LERA
- 2022-05-24 Price Changed $337,260 LERA
- 2022-05-03 Price Changed $337,002 LERA
- 2022-04-18 Price Changed $335,002 LERA
- 2022-04-09 Price Changed $332,002 LERA
- 2022-04-08 Relisted — LERA
- 2022-02-14 Listing Removed — LERA
- 2022-01-15 Price Changed $314,483 LERA
- 2022-01-05 Price Changed $312,483 LERA
- 2021-11-15 Listed $310,164 LERA
Property tax history
+44.9%/yrLatest (2025): $7,463 · +11.0% YoY. Source: county tax records.
Cash-flow waterfall
monthlySold comps — $/sqft
last 12 mo · ≤1 miLoading sold comps…