 Duplex
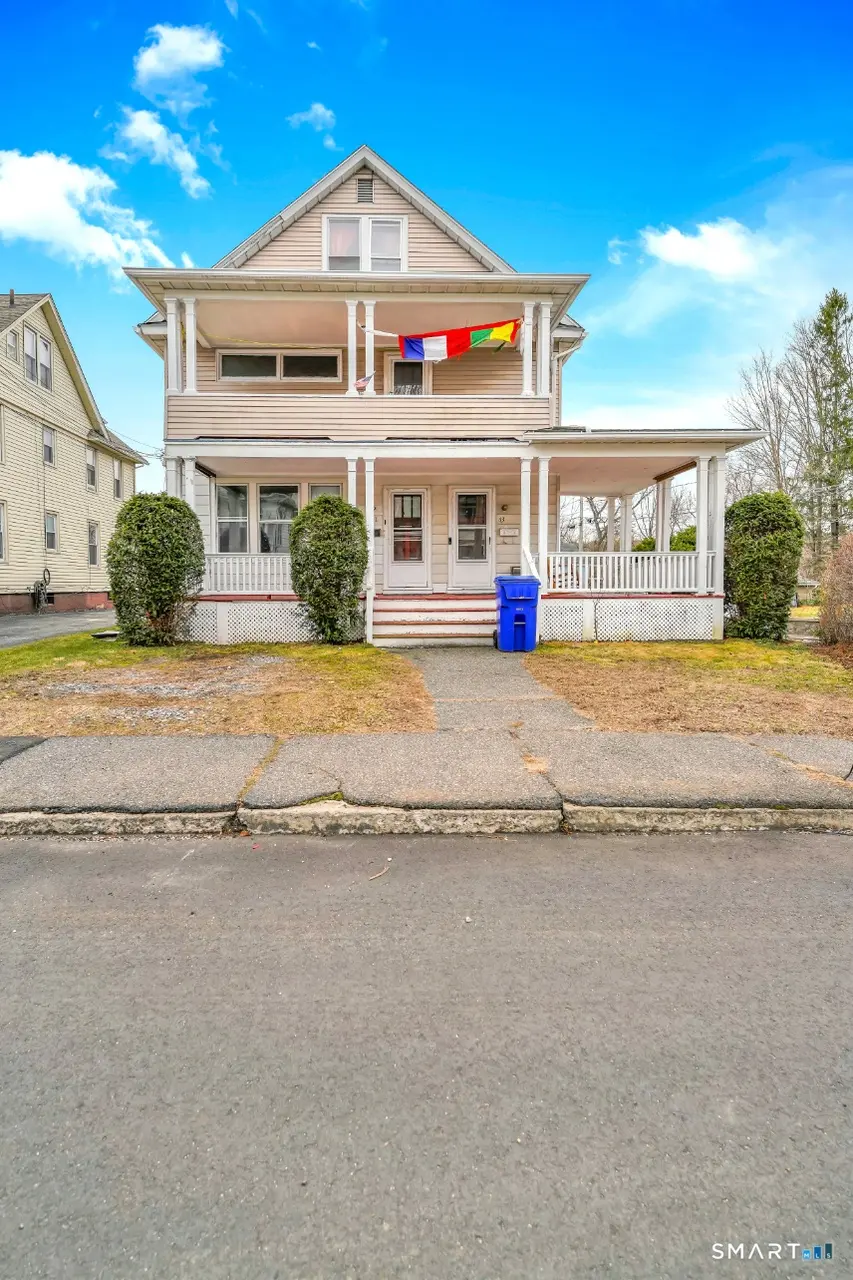
43 Evans St · Torrington, CT
Flood risk 1/10 · Minimal
- FEMA flood zone
- X
- Chance of flooding over 30 yrs
- 0.0%
- Est. flood insurance / yr
- $473 – $860
Fire risk 3/10 · Minor
- Est. fire insurance / yr
- $829 – $1,539
Heat risk 4/10 · Minor
- Hot days now (above 93°F)
- 8 days/yr
- Hot days in 30 yrs
- 18 days/yr
Wind risk 5/10 · Moderate
- Chance of severe wind over 30 yrs
- 26.0%
Air-quality risk 2/10 · Minimal
- Unhealthy air days now
- 1 days/yr
- Unhealthy air days in 30 yrs
- 1 days/yr
Risk factors via First Street. Map © Google.
Why this score? — see what drove the C- grade
The composite is a weighted blend of 9 inputs, each scored 0–100. Each bar is that input's sub-score; the figure is the points it added to the 100-point composite (weight × sub-score).
- Cash flow +22.6/30.0
- DSCR +7.2/10.0
- 1% rule +5.6/10.0
- Rent growth +4.0/5.0
- Livability +3.8/5.0
- Schools +2.7/10.0
- ARV discount +2.6/15.0
- Condition / age +2.5/5.0
- Appreciation +0.0/10.0
$379,000
🖨 Deal sheet 📄 Offer letter ✓ Due diligence
Multi-family units
County records classify this as Multi-Family (2-4 Unit). Listing-text estimate: 2 units. confirmed
Listing remarks MLS
Great investment or owner-occupant opportunity in Torrington! This well-maintained two-family property at 43 Evans Street offers spacious units with functional layouts, providing flexibility for rental income or multi-generational living. Each unit features generous living areas, ample natural light, and comfortable-sized bedrooms. Separate utilities add convenience and ease for both owner and tenants. The property also includes off-street parking and a manageable yard. Conveniently located near shopping, dining, schools, and major routes. Don't miss your chance to own this versatile income-producing property!
Key facts
- Ample natural light
- Two-family property
- Functional layouts
Tags
Neighborhood map
What this means for you Summary
Snapshot
- This is a 2 × 4-bed/1.0-bath units multifamily listed at $379k.
Deal economics
- At list price, monthly cash flow is $643 ($8k/yr) — positive. Per door: $321/mo.
- The deal already cash-flows at list — no discount required.
- Meets the 1% rule at list price ($4k rent vs $379k).
- Recommended offer: $368k (3.0% below list) — sets the bar for market timing.
- Cap rate 8.3% vs local median 3.9% in Torrington — top-decile yield for the area; either an underpriced asset or a hidden risk that comps aren't pricing in. Stress-test before assuming the spread holds.
Location & tenants
- Location reads 76/100 on livability (#53 in CT, #3,449 nationally) — a middle-class / working-renter tenant base. Strengths: crime A+, cost of living A+, housing A+; Watch: schools D, commute F.
- Torrington School District (town): math 22% / reading 39% proficiency, ranked #125 of 153 in CT (top 82%) — families likely to look elsewhere, expect single-tenant / working-renter base with shorter leases.
- Market conditions: Rents rising fast (+5.9%/yr); 188 active listings in the ZIP; 154 units permitted in Northwest Hills Planning Region in 2024 (6 in 5+ unit buildings).
- At $4,019/mo this rent would consume 68% of the median local household income ($71k/yr) (locally 1401% of renters already pay >50% of income on rent) — very limited rent-growth headroom before tenants either downsize or default.
Forward outlook
- Local home prices are declining (-3.0%/yr); year-one equity from $3k of loan paydown is wiped out by about $11k of value loss. Plan a longer hold.
- At projected returns (-3.0% appreciation + 5.9% rent growth), your $106k cash investment doubles in ~10 years — after that, you're playing with house money.
Negotiation context
- It's been on market 33 days — a 3% lower offer ($368k) is reasonable based on typical stale-listing flexibility.
Risks & watch-outs
- Watch-outs: built in 1900 — expect roof / HVAC / electrical / plumbing capex.
- Climate carrying-cost: moderate wind risk, 26% chance of damaging wind over 30y — expect insurance premiums to compound above CPI over the hold.
Questions for the listing agent
- It's been on market 33 days. Have you received any prior offers? Is the seller open to a 3% concession, seller financing, or rate buy-down credit?
- Can we see the unit-by-unit rent roll, current vacancy, and any below-market leases? What's the average tenancy length?
- What capital expenditures (roof, boiler, parking lot, exteriors) have been made in the last 5 years, and what's planned in the next 2?
- Built in 1900 — when were the roof, HVAC, electrical panel, plumbing, and water heater last replaced?
- Is there a deadline driving the sale (1031 exchange, divorce, estate, relocation)? That informs how much negotiation room exists.
- Schools are D-rated, which usually means shorter tenancies and higher turnover. Who's the typical renter profile here, and what's been the actual vacancy rate?
- What's the average days-on-market for RENTAL listings here right now (not sales)? A rising rental-DOM trend means longer vacancies and softer asking-rent achievability than the comps imply.
- What's the recent tenant-quality profile in this submarket — average credit score on applications, eviction rate, late-payment / NSF rate, and stable-employment percentage? A property-management company in the area should have these aggregated.
- How much new apartment / multifamily construction is in the pipeline within 1–3 miles? Heavy new supply (>2% of stock underway) typically softens rents 12–24 months out; light construction supports rent growth.
Investment metrics
- 1% rule
- 1.06% ✓
- Cap rate
- 8.33%
- Cash-on-cash
- 7.27%
- DSCR
- 1.32
- GRM
- 7.9
CMA / ARV
- ARV (median comp)
- $341,766
- List price
- $379,000
- Delta
- 10.89%
- Verdict
- OVERPRICED
- Comps
- 20 within 1.0 mi
Show comp detail 6 sales within ~0.75 mi
| Address | Dist | Beds/Ba | Sqft | Sold | Price | $/sf | Match |
|---|---|---|---|---|---|---|---|
| 91 Riverside Ave | 0.39mi | 7/3.0 (-1) | 2,936 (-2%) | 5mo | $370,000 | $126 | 65 |
| 85 McGuinness St | 0.22mi | 7/3.0 (-1) | 2,843 (-5%) | 12mo | $360,000 | $127 | 63 |
| 76 Woodbine St | 0.24mi | 9/3.0 (+1) | 3,120 (+4%) | 22mo | $355,000 | $114 | 54 |
| 70 Woodbine St | 0.24mi | 9/3.0 (+1) | 3,120 (+4%) | 22mo | $380,000 | $122 | 54 |
| 510 Prospect St | 0.46mi | 8/2.0 | 2,741 (-8%) | 14mo | $370,000 | $135 | 53 |
| 116 High St | 0.65mi | 7/5.0 (-1) | 2,892 (-3%) | 3mo | $390,000 | $135 | 44 |
Match score weights: distance 35% · size 25% · config 20% · recency 20%. Top-matched comps best support the ARV.
Projected returns pro-forma
-3.0% appreciation · 5.89% rent growth · sell at horizon
- IRR
- -2.0%
- Equity multiple
- 0.92×
- Total profit
- $-8,436
- Equity at exit
- $56,510
- IRR
- 10.5%
- Equity multiple
- 1.92×
- Total profit
- $97,767
- Equity at exit
- $32,769
Cash invested: $106,120 (down + closing). Projections, not guarantees.
Landlord ↔ Tenant lean methodology
- Overall (STATE)
- 27 Tenant-Leaning
- State Connecticut
- 27 Tenant-Leaning · D+7
- County
- — inherits STATE
- City
- — inherits STATE
ZIP-level market 06790
- Rents YoY
- 5.9%
- Active inventory
- 188
- Price-to-rent
- 15.7×
Monthly cashflow live
- Estimated rent
- $4,019 high interval (Pro) →
- Mortgage (P&I)
- −$1,988
- Tax from tax record
- −$387 /mo · $4,640/yr
- Insurance
- −$158
- HOA
- −$0
- Vacancy / Maint / Mgmt
- −$844
- Net cashflow
- $643
Break-even live
2-unit breakdown (identical units grouped — click to expand)
| Units | Beds | Baths | Est. rent |
|---|---|---|---|
| 2× units | 4 | 1 | $4,018 |
| #1 | 4 | 1 | $2,009 |
| #2 | 4 | 1 | $2,009 |
| Total (2 units) | $4,019 | ||
UW: 25.0% down · 7.5% · 30yr · 1.5% tax · 5.0% vac · 8.0% maint · 8.0% mgmt
Financing live
Cash to close
- Down payment
- $94,750
- Closing costs
- $11,370
- Reserves months
- —
- Total cash needed
- —
Loan-product check · same deal, 3 products live
Conventional
25% down · 7.5% · 30yr
- Down + closing
- —
- Monthly P&I
- —
- Monthly cashflow
- —
- DSCR
- —
- Eligible?
- —
Personal DTI + credit; lowest rate.
DSCR
20% down · 8.5% · 30yr
- Down + closing
- —
- Monthly P&I
- —
- Monthly cashflow
- —
- DSCR
- —
- Eligible?
- —
No personal income docs; deal must DSCR.
Hard money
10% down · 12.0% · 12mo
- Down + closing
- —
- Monthly P&I
- —
- Monthly cashflow
- —
- DSCR
- —
- Eligible?
- —
Short-term bridge; refi at stabilization.
Listing history 2 events
-
2026-05-04status Under Contract 617-char remark
Show marketing remark (617 chars)
Great investment or owner-occupant opportunity in Torrington! This well-maintained two-family property at 43 Evans Street offers spacious units with functional layouts, providing flexibility for rental income or multi-generational living. Each unit features generous living areas, ample natural light, and comfortable-sized bedrooms. Separate utilities add convenience and ease for both owner and tenants. The property also includes off-street parking and a manageable yard. Conveniently located near shopping, dining, schools, and major routes. Don't miss your chance to own this versatile income-producing property!
-
2026-04-01$379,000 Active 617-char remark
Show marketing remark (617 chars)
Great investment or owner-occupant opportunity in Torrington! This well-maintained two-family property at 43 Evans Street offers spacious units with functional layouts, providing flexibility for rental income or multi-generational living. Each unit features generous living areas, ample natural light, and comfortable-sized bedrooms. Separate utilities add convenience and ease for both owner and tenants. The property also includes off-street parking and a manageable yard. Conveniently located near shopping, dining, schools, and major routes. Don't miss your chance to own this versatile income-producing property!
ⓘ Source: listings_history table (triggers on properties + properties_extension) + one-shot
backfill from property_details.listing_events for pre-trigger history.
Tax reassessment forecast CT · Partial reset (capped growth)
- Current annual tax
- $4,640 · $387/mo
- Projected year-2 tax
- $6,375 · $531/mo
- Expected delta
- +$1,735/yr (+$145/mo · 37.4%)
ⓘ Screening estimate from a state-policy table — verify with the county assessor before closing.
Climate risk First Street
- Flood 1/10 Low FEMA zone X · 0% chance over 30 yrs
- Wildfire 3/10 Moderate
- Heat 4/10 Moderate 8 d/yr ≥93°F today · 18 d/yr by 30 yrs out
- Wind 5/10 Major 26% chance of damaging wind over 30 yrs
- Air quality 2/10 Low 1 unhealthy d/yr today · 1 by 30 yrs out
Nearby sold comps map
Loading sold comps map…
Walkable amenities ~0.75 mi
Loading nearby amenities…
Taxation est. · year 1
- Rental income
- $48,228
- − Mortgage interest
- −$21,230
- − Property taxes
- −$4,640
- − Insurance
- −$1,895
- − Repairs & maintenance
- −$3,858
- − Management
- −$3,858
- − Depreciation
- −$11,025
- Taxable income
- $1,721
- Est. tax owed @ 24.0%
- −$413
- After-tax cash flow
- $7,302/yr
For passive investors: Depreciation is non-cash, so a rental often shows a tax loss while cash-flowing — sheltering income. Rental losses are passive: they offset passive income freely, and up to $25,000/yr can offset ordinary (W-2) income if you actively participate and your MAGI is under $100k (phasing out to $0 by $150k); unused losses carry forward. On sale, claimed depreciation is recaptured at up to 25%, and gains may owe capital-gains tax (a 1031 exchange can defer both). Figures are a year-1 estimate at your 24.0% rate — not tax advice; consult a CPA.
Schools (NCES district)
- District
- Torrington School District
- NCES district ID
- 0904590
- Math proficiency
- 22% ▼ -8.00%
- Reading proficiency
- 39% ▼ -6.00%
- Median HH income
- $53,647
- Composite
- 26.9/100
- National rank
- #7087
- State rank
- #125 of 153 in CT
Livability — Torrington
- Score
- 76/100
- State rank
- #53
- US rank
- #3449
Category grades
Schools grade is shown separately in the Schools card above.
Census & demographics
- Census place
- Torrington, CT
- County
- Litchfield County · 81,203 people
- City population
- 35,566
- Metro
- Torrington, CT
- Population (ZIP)
- 35,566
- Household income
- $70,912
- Rent vs Own
- Severe rent burden
- 1401.0
Population outlook (Northwest Hills County) Hauer SSP2
- By 2040
- 118,998
Race, ethnicity, and origin ACS 2023
- Neighborhood character
- Predominantly White (73%)
- Race & ethnicity
- White 73% Hispanic / Latino 14% Two or more races 8% Black 6% Asian 3%
- Hispanic origin (detail)
- Puerto Rican 5% Dominican 2%
- Common ancestry
- Romanian 8% Lithuanian 5% Slovak 2%
- Foreign-born
- 12% · Canada, South Korea, Jamaica
- Languages at home
- 86% English-only · Spanish 8% Other Indo-European 2% Russian/Polish/Slavic 1%
Political lean MEDSL · Northwest Hills
- 2024 margin
- Toss-up / Even · D 48.6% · R 49.9% · Other 1.6%
- All cycles
- 2024: R+1.3
Not yet ingested
- Civics
- —
Market trends
- HPI YoY
- ▼ -122.78%
- Current HPI
- 208.4818
- Rent YoY
- ▲ 5.89%
- Metro
- Torrington, CT
- State GDP YoY
- ▲ 1.06%
- F500 in state
- 38
Industry mix (Fortune 500 HQ in CT)
| Industry | F500 HQs | Revenue |
|---|---|---|
| Industrial Machinery | 4 | $38B |
|
||
| Insurance | 3 | $71B |
|
||
| Financial Services | 2 | $25B |
|
||
| Transportation / Logistics | 2 | $18B |
|
||
| Healthcare | 1 | $247B |
|
||
| Telecommunications | 1 | $55B |
|
||
Price history
2 events — show timeline
- 2026-05-04 Pending — Smart MLS
- 2026-04-01 Listed $379,000 Smart MLS
Property tax history
+1.5%/yrLatest (2023): $4,640 · +1.8% YoY. Source: county tax records.
Cash-flow waterfall
monthlySold comps — $/sqft
last 12 mo · ≤1 miLoading sold comps…