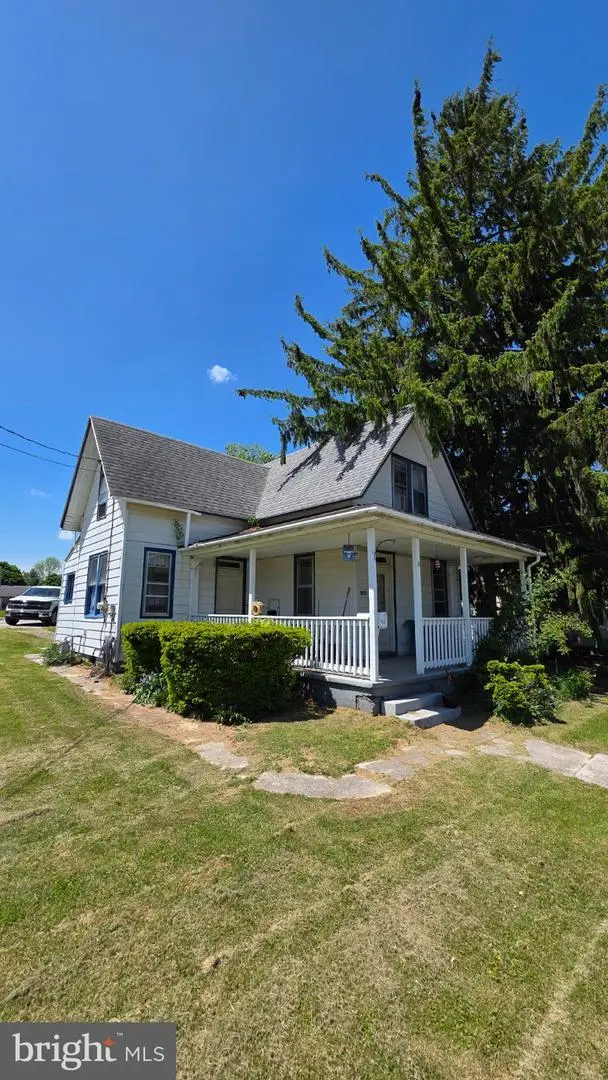
917 Baltimore St · Penn, PA
Flood risk 1/10 · Minimal
- FEMA flood zone
- X (unshaded)
- Chance of flooding over 30 yrs
- 0.0%
- Est. flood insurance / yr
- $473 – $860
Fire risk 1/10 · Minimal
- Est. fire insurance / yr
- $511 – $949
Heat risk 5/10 · Moderate
- Hot days now (above 102°F)
- 7 days/yr
- Hot days in 30 yrs
- 15 days/yr
Wind risk 4/10 · Minor
- Chance of severe wind over 30 yrs
- 10.0%
Air-quality risk 2/10 · Minimal
- Unhealthy air days now
- 1 days/yr
- Unhealthy air days in 30 yrs
- 3 days/yr
Risk factors via First Street. Map © Google.
Why this score? — see what drove the B- grade
The composite is a weighted blend of 9 inputs, each scored 0–100. Each bar is that input's sub-score; the figure is the points it added to the 100-point composite (weight × sub-score).
- Cash flow +25.5/30.0
- ARV discount +15.0/15.0
- DSCR +8.4/10.0
- 1% rule +7.4/10.0
- Schools +4.2/10.0
- Rent growth +3.7/5.0
- Livability +2.8/5.0
- Condition / age +2.5/5.0
- Appreciation +0.0/10.0
$124,995
🖨 Deal sheet 📄 Offer letter ✓ Due diligence
Listing remarks MLS
Short Sale. Buyer pays $6,000 loss mitigation fee. Enter at your own risk. ONE SHOWING WINDOW ONLY, SUNDAY MARCH 1, BETWEEN 1pm and 3pm.
Key facts
- Spacious yard
- Close to shopping
- 7,405 sq ft lot
Tags
Property features AI
Exterior
- Parking: Off-street parking
- Utilities: Public water; Public septic; Hot water supplied by natural gas
- Home design: Detached property; Above-grade finished area (estimated)
- Construction: Vinyl siding; Block foundation; Above-grade structures
- Exterior features: Not in a federal flood zone; No tidal water on the lot
Interior
- Bedrooms: One bedroom on the main level; Two bedrooms on the first upper level
- Bathrooms: One full bathroom (upper level); One half bathroom (main level)
- Heating & cooling: Forced air heating (natural gas); Window cooling units (electric)
- Interior features: Estimated living area; Unfinished basement
Neighborhood map
What this means for you Summary
Snapshot
- This is a 2-bed/1.5-bath single-family listed at $125k.
Deal economics
- At list price, monthly cash flow is $290 ($3k/yr) — positive.
- The deal already cash-flows at list — no discount required.
- Meets the 1% rule at list price ($2k rent vs $125k).
- Recommended offer: $123k (1.5% below list) — sets the bar for market timing.
Location & tenants
- Location reads 56/100 on livability (#1,637 in PA) — a working-class tenant base; expect higher turnover. Strengths: cost of living A+, housing A+; Watch: crime D+, schools F, amenities F.
- South Western SD (suburban): math 37% / reading 56% proficiency, ranked #206 of 539 in PA (top 38%) — families likely to look elsewhere, expect single-tenant / working-renter base with shorter leases.
- Market conditions: Rents rising fast (+4.7%/yr); 386 active listings in the ZIP; 12 comparable units currently listed for rent nearby; rentals at typical pace (median 21d on market — plan ~3-4 weeks tenant-placement turnaround); 42% of comp listings sitting > 30 days — soft ceiling on asking rent; solid renter incomes; 1,328 units permitted in York County in 2024 (338 in 5+ unit buildings).
Forward outlook
- Local home prices are declining (-3.0%/yr); year-one equity from $864 of loan paydown is wiped out by about $4k of value loss. Plan a longer hold.
- At projected returns (-3.0% appreciation + 4.7% rent growth), your $35k cash investment doubles in ~9 years — after that, you're playing with house money.
Negotiation context
- It's been on market 17 days — a 2% lower offer ($123k) is reasonable based on typical stale-listing flexibility.
- 6 sale attempts since 21y ago; this cycle's ask has dropped $10k (7%) from the opening price — seller is motivated, your offer sets the floor, not the list.
- Current owner paid $95k; 32% above their basis — modest negotiation headroom, anchor on the comps not their cost.
Risks & watch-outs
- Watch-outs: built in 1920 — expect roof / HVAC / electrical / plumbing capex.
- Climate carrying-cost: extreme-heat days projected 7→15/yr by 2055 (HVAC capex compounding) — expect insurance premiums to compound above CPI over the hold.
Questions for the listing agent
- Built in 1920 — when were the roof, HVAC, electrical panel, plumbing, and water heater last replaced?
- Is there a deadline driving the sale (1031 exchange, divorce, estate, relocation)? That informs how much negotiation room exists.
- Schools are F-rated, which usually means shorter tenancies and higher turnover. Who's the typical renter profile here, and what's been the actual vacancy rate?
- Crime grade is D in this area — have there been break-ins, vandalism, or insurance claims at this property in the last 3 years? What carrier currently insures it and at what premium?
- What's the average days-on-market for RENTAL listings here right now (not sales)? A rising rental-DOM trend means longer vacancies and softer asking-rent achievability than the comps imply.
- What's the recent tenant-quality profile in this submarket — average credit score on applications, eviction rate, late-payment / NSF rate, and stable-employment percentage? A property-management company in the area should have these aggregated.
- How much new for-sale + rental construction is in the pipeline within 1–3 miles? Heavy new supply typically softens prices + rents 12–24 months out; constrained supply supports both.
Investment metrics
- 1% rule
- 1.24% ✓
- Cap rate
- 9.08%
- Cash-on-cash
- 9.94%
- DSCR
- 1.44
- GRM
- 6.7
CMA / ARV
- ARV (on-the-fly)
- $221,340
- Comps found
- 12
Show comp detail 12 sales within ~0.75 mi
| Address | Dist | Beds/Ba | Sqft | Sold | Price | $/sf | Match |
|---|---|---|---|---|---|---|---|
| 917 Baltimore St | 0.00mi | 3/1.5 (+1) | 1,020 (0%) | 2mo | $95,000 | $93 | 94 |
| 9 Little Knoll Dr | 0.22mi | 3/2.5 (+1) | 1,128 (+11%) | 5mo | $310,000 | $275 | 59 |
| 15 Wilmar Ave | 0.47mi | 2/2.0 | 998 (-2%) | 18mo | $205,000 | $205 | 58 |
| 522 S High St | 0.71mi | 3/1.0 (+1) | 988 (-3%) | 2mo | $244,900 | $248 | 53 |
| 407 Wirt Ave | 0.59mi | 3/1.5 (+1) | 1,092 (+7%) | 10mo | $257,000 | $235 | 47 |
| 402 Wirt Ave | 0.61mi | 2/1.0 | 1,092 (+7%) | 13mo | $170,000 | $156 | 47 |
| 400 Wirt Ave | 0.61mi | 3/1.0 (+1) | 1,124 (+10%) | 7mo | $255,000 | $227 | 41 |
| 100 Lion Dr | 0.69mi | 3/1.0 (+1) | 1,020 (0%) | 24mo | $200,000 | $196 | 41 |
| 9 Lafayette St | 0.73mi | 3/1.0 (+1) | 1,104 (+8%) | 10mo | $239,900 | $217 | 37 |
| 12 Willow Ct | 0.53mi | 3/1.0 (+1) | 941 (-8%) | 22mo | $177,200 | $188 | 37 |
| 541 S Franklin St | 0.74mi | 3/1.0 (+1) | 1,124 (+10%) | 6mo | $220,000 | $196 | 36 |
| 20 Hill St | 0.71mi | 3/1.0 (+1) | 1,140 (+12%) | 14mo | $250,000 | $219 | 28 |
Match score weights: distance 35% · size 25% · config 20% · recency 20%. Top-matched comps best support the ARV.
Projected returns pro-forma
-3.0% appreciation · 4.67% rent growth · sell at horizon
- IRR
- 0.7%
- Equity multiple
- 1.03×
- Total profit
- $923
- Equity at exit
- $18,637
- IRR
- 12.1%
- Equity multiple
- 2.03×
- Total profit
- $36,092
- Equity at exit
- $10,807
Cash invested: $34,999 (down + closing). Projections, not guarantees.
Landlord ↔ Tenant lean methodology
- Overall (STATE)
- 62 Landlord-Friendly
- State Pennsylvania
- 62 Landlord-Friendly · EVEN
- County
- — inherits STATE
- City
- — inherits STATE
ZIP-level market 17331
- Home prices YoY
- -33.8%
- Rents YoY
- 4.7%
- Active inventory
- 386
- Price-to-rent
- 6.7×
Monthly cashflow live
- Estimated rent
- $1,550 high interval (Pro) →
- Mortgage (P&I)
- −$655
- Tax from tax record
- −$227 /mo · $2,724/yr
- Insurance
- −$52
- HOA
- −$0
- Vacancy / Maint / Mgmt
- −$325
- Net cashflow
- $290
Break-even live
UW: 25.0% down · 7.5% · 30yr · 1.5% tax · 5.0% vac · 8.0% maint · 8.0% mgmt
Financing live
Cash to close
- Down payment
- $31,249
- Closing costs
- $3,750
- Reserves months
- —
- Total cash needed
- —
Loan-product check · same deal, 3 products live
Conventional
25% down · 7.5% · 30yr
- Down + closing
- —
- Monthly P&I
- —
- Monthly cashflow
- —
- DSCR
- —
- Eligible?
- —
Personal DTI + credit; lowest rate.
DSCR
20% down · 8.5% · 30yr
- Down + closing
- —
- Monthly P&I
- —
- Monthly cashflow
- —
- DSCR
- —
- Eligible?
- —
No personal income docs; deal must DSCR.
Hard money
10% down · 12.0% · 12mo
- Down + closing
- —
- Monthly P&I
- —
- Monthly cashflow
- —
- DSCR
- —
- Eligible?
- —
Short-term bridge; refi at stabilization.
Rent comps 12 comps
| Address | Beds | Baths | Sqft | Rent | $/sqft | DOM | Units | Dist |
|---|---|---|---|---|---|---|---|---|
| 1234 Baltimore St Unit 4 Hanover, PA | 2.0 | 1.0 | 784 | $475 | $0.61 | 43d | 1 | 0.62mi |
| 101 Pacer Dr Unit K Hanover, PA | 3.0 | 2.5 | 1252 | $1,846 | $1.47 | 43d | 1 | 0.78mi |
| 101 Pacer Dr Unit M Hanover, PA | 3.0 | 2.5 | 1252 | $1,751 | $1.40 | 43d | 1 | 0.78mi |
| 101 Pacer Dr Unit L Hanover, PA | 3.0 | 2.5 | 1252 | $1,901 | $1.52 | 13d | 1 | 0.78mi |
| 807 W Alvin St Unit 835 Hanover, PA | 2.0 | 1.0 | 700 | $1,000 | $1.43 | 20d | 1 | 1.13mi |
| 807 W Alvin St Hanover, PA | 1.0–2.0 | 1.0 | 625 | $1,000 | $1.60 | 13d | 2 | 1.15mi |
| 24 E Middle St Apt A Hanover, PA | 1.0 | 1.0 | 700 | $1,400 | $2.00 | 13d | 1 | 1.29mi |
| 1004 Admiral Ln Apt 301 Hanover, PA | 1.0 | 1.0 | 991 | $1,657 | $1.67 | 20d | 1 | 1.43mi |
| 1006 Admiral Ln Unit 101 Hanover, PA | 1.0 | 1.0 | 847 | $1,545 | $1.82 | 43d | 1 | 1.44mi |
| 1014 Crew St Unit 303 Hanover, PA | 1.0 | 1.0 | 924 | $1,606 | $1.74 | 20d | 1 | 1.46mi |
| 1001 Admiral Ln Unit 108 Hanover, PA | 1.0 | 1.0 | 774 | $1,571 | $2.03 | 20d | 1 | 1.48mi |
| 1003 Admiral Ln Unit 204 Hanover, PA | 2.0 | 2.0 | 1039 | $1,749 | $1.68 | 43d | 1 | 1.48mi |
Listing history 12 events
-
2026-06-16days on market $124,995 Active 17 DOM
-
2026-06-15days on market $124,995 Active 16 DOM
-
2026-06-14days on market $124,995 Active 14 DOM
-
2026-06-13days on market $124,995 Active 13 DOM
-
2026-06-10pricedays on market $124,995 Active 11 DOM
-
2026-06-09days on market $134,995 Active 10 DOM
-
2026-06-08days on market $134,995 Active 9 DOM
-
2026-06-07days on market $134,995 Active 8 DOM
-
2026-06-02days on market $134,995 Active 3 DOM
-
2026-06-01days on market $134,995 Active 2 DOM
-
2026-05-31remarks 572-char remark
-
2026-05-31$134,995 Active 1 DOM
ⓘ Source: listings_history table (triggers on properties + properties_extension) + one-shot
backfill from property_details.listing_events for pre-trigger history.
Tax reassessment forecast PA · Partial reset (capped growth)
- Current annual tax
- $2,724 · $227/mo
- Projected year-2 tax
- $2,724 · $227/mo
- Expected delta
- $0/yr ($0/mo · 0.0%)
ⓘ Screening estimate from a state-policy table — verify with the county assessor before closing.
Climate risk First Street
- Flood 1/10 Low FEMA zone X (unshaded) · 0% chance over 30 yrs
- Wildfire 1/10 Low
- Heat 5/10 Major 7 d/yr ≥102°F today · 15 d/yr by 30 yrs out
- Wind 4/10 Moderate 10% chance of damaging wind over 30 yrs
- Air quality 2/10 Low 1 unhealthy d/yr today · 3 by 30 yrs out
Nearby sold comps map
Loading sold comps map…
Walkable amenities ~0.75 mi
Loading nearby amenities…
Taxation est. · year 1
- Rental income
- $18,599
- − Mortgage interest
- −$7,002
- − Property taxes
- −$2,724
- − Insurance
- −$625
- − Repairs & maintenance
- −$1,488
- − Management
- −$1,488
- − Depreciation
- −$3,636
- Taxable income
- $1,637
- Est. tax owed @ 24.0%
- −$393
- After-tax cash flow
- $3,086/yr
For passive investors: Depreciation is non-cash, so a rental often shows a tax loss while cash-flowing — sheltering income. Rental losses are passive: they offset passive income freely, and up to $25,000/yr can offset ordinary (W-2) income if you actively participate and your MAGI is under $100k (phasing out to $0 by $150k); unused losses carry forward. On sale, claimed depreciation is recaptured at up to 25%, and gains may owe capital-gains tax (a 1031 exchange can defer both). Figures are a year-1 estimate at your 24.0% rate — not tax advice; consult a CPA.
Schools (NCES district)
- District
- South Western SD
- NCES district ID
- 4222470
- Math proficiency
- 37% ▼ -16.00%
- Reading proficiency
- 56% ▼ -11.00%
- Median HH income
- $67,689
- Composite
- 41.5/100
- National rank
- #3456
- State rank
- #206 of 539 in PA
Livability — Penn
- Score
- 56/100
- State rank
- #1637
- US rank
- #22584
Category grades
Schools grade is shown separately in the Schools card above.
Census & demographics
- Census place
- Parkville, PA
- County
- York County · 278,806 people
- Metro
- York-Hanover, PA
- Population (ZIP)
- 56,443
- Household income
- $79,488
- Rent vs Own
- Severe rent burden
- 1076.0
Population outlook (York County) Hauer SSP2
- Today (2025)
- 454,205 people
- By 2030
- 457,407 · +0.7%
- By 2040
- 457,529 · +0.7%
- By 2050
- 448,261 · -1.3%
- By 2075
- 427,388 · -5.9%
- By 2100
- 384,218 · -15.4%
Race, ethnicity, and origin ACS 2023
- Neighborhood character
- Predominantly White (86%)
- Race & ethnicity
- White 86% Hispanic / Latino 7% Two or more races 7% Black 3% Asian 1%
- Hispanic origin (detail)
- Mexican 3% Puerto Rican 2%
- Common ancestry
- Romanian 3% Lithuanian 2% Slovak 2%
- Foreign-born
- 4% · Canada
- Languages at home
- 95% English-only · Spanish 3%
Political lean MEDSL · York
- 2024 margin
- Strong R (+25.3) · D 36.9% · R 62.1%
- 2008→2024 swing
- -11.7pp toward R · 2008: -13.6pp · 2024: -25.3pp
- All cycles
- 2024: R+25.3 2020: R+24.6 2016: R+29.3 2012: R+21.2 2008: R+13.6
Not yet ingested
- Civics
- —
Market trends
- HPI YoY
- ▼ -128.48%
- Current HPI
- 251.8974
- Rent YoY
- ▲ 4.67%
- Metro
- York-Hanover, PA
- State GDP YoY
- ▲ 1.68%
- F500 in state
- 34
Industry mix (Fortune 500 HQ in PA)
| Industry | F500 HQs | Revenue |
|---|---|---|
| Healthcare | 2 | $309B |
|
||
| Insurance | 2 | $27B |
|
||
| Telecommunications / Media | 1 | $124B |
|
||
| Industrial Distribution | 1 | $22B |
|
||
| Financial Services | 1 | $20B |
|
||
| Chemicals / Materials | 1 | $18B |
|
||
Price history
+132.8% since first listed18 events — show timeline
- 2026-05-30 Listed $134,995 BRIGHT MLS
- 2026-05-05 Sold (MLS) $95,000 BRIGHT MLS
- 2026-03-03 Pending — BRIGHT MLS
- 2026-03-03 Price Changed $118,000 BRIGHT MLS
- 2026-02-18 Relisted — BRIGHT MLS
- 2026-02-17 Listing Removed — BRIGHT MLS
- 2026-02-17 Listed $99,900 BRIGHT MLS
- 2026-02-11 Listing Removed — BRIGHT MLS
- 2025-12-10 Price Changed $75,000 BRIGHT MLS
- 2025-12-10 Contingent — BRIGHT MLS
- 2025-10-14 Listed $225,000 BRIGHT MLS
- 2006-07-10 Sold (Public Records) $149,000 Public Records
- 2006-06-21 Sold (MLS) $149,900 BRIGHT MLS
- 2006-03-20 Listed $139,900 BRIGHT MLS
- 2005-09-19 Sold (Public Records) $58,000 Public Records
- 2005-09-16 Sold (MLS) $58,000 BRIGHT MLS
- 2005-09-01 Listing Removed — BRIGHT MLS
- 2005-08-29 Listed $58,000 BRIGHT MLS
Property tax history
+2.6%/yrLatest (2025): $2,724 · +0.0% YoY. Source: county tax records.
Cash-flow waterfall
monthlySold comps — $/sqft
last 12 mo · ≤1 miLoading sold comps…