 🏗️ New Construction
1016 Ira St SW · Atlanta, GA
Flood risk 1/10 · Minimal
- FEMA flood zone
- X (unshaded)
- Chance of flooding over 30 yrs
- 0.0%
- Est. flood insurance / yr
- $507 – $1,088
Fire risk 1/10 · Minimal
- Est. fire insurance / yr
- $963 – $1,789
Heat risk 5/10 · Moderate
- Hot days now (above 104°F)
- 7 days/yr
- Hot days in 30 yrs
- 18 days/yr
Wind risk 5/10 · Moderate
- Chance of severe wind over 30 yrs
- 26.0%
Air-quality risk 4/10 · Minor
- Unhealthy air days now
- 4 days/yr
- Unhealthy air days in 30 yrs
- 6 days/yr
Risk factors via First Street. Map © Google.
Why this score? — see what drove the F grade
The composite is a weighted blend of 9 inputs, each scored 0–100. Each bar is that input's sub-score; the figure is the points it added to the 100-point composite (weight × sub-score).
- ARV discount +7.5/15.0
- Cash flow +7.2/30.0
- Livability +4.2/5.0
- Rent growth +3.2/5.0
- Schools +2.7/10.0
- Condition / age +2.5/5.0
- DSCR +1.3/10.0
- 1% rule +0.8/10.0
- Appreciation +0.0/10.0
$130,000
🖨 Deal sheet 📄 Offer letter ✓ Due diligence
Listing remarks
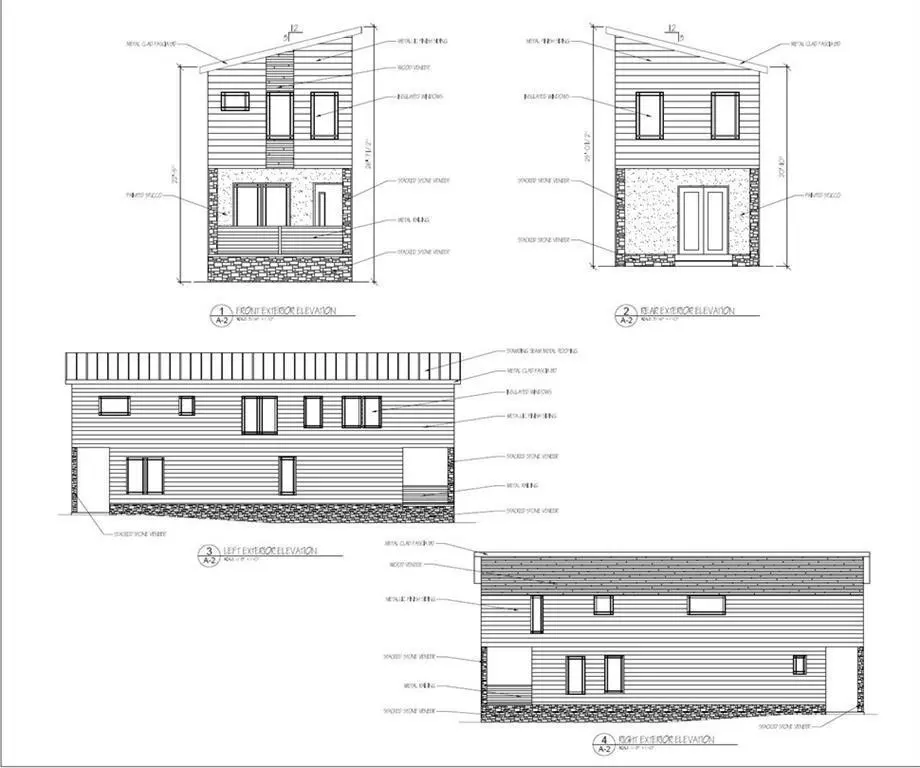
Come build your dream home on this prime Pittsburgh location! LEVEL LOT WITH PLANS! READY TO BUILD! The house that was on that lot was demolished and the lot was cleared and prepared for a new construction. There are plans for a modern 2 story house to be built on that lot. Just bring your contractor and start building. Tons of new development in the area.
Key facts
- Level lot
- 2,500 sq ft lot
- Built 1920
Tags
Property features AI
Exterior
- Parking: Driveway; Open parking available
- Utilities: Public water; Public sewer; Electric: 110 volts; Utilities: Other
- Home design: Two levels; To be built
- Construction: Construction materials: Other; Roof: Other; Foundation: See remarks
- Exterior features: City street frontage; Asphalt road access; Single family vacant lot
Interior
- Kitchen: Appliances: Other; Kitchen features: Other; Dining room features: Other
- Bedrooms: Three upper-level bedrooms
- Flooring: Other
- Bathrooms: Two full bathrooms; One half bathroom (main level)
- Heating & cooling: Heating: Other; Cooling: Other
- Interior features: No shared/common walls; Energy Star Certified Homes
- Laundry & utility: Laundry features: Other
Neighborhood map
What this means for you Summary
Snapshot
- This is a 3-bed/2.5-bath land listed at $130k.
Deal economics
- At list price, monthly cash flow is $-576 ($-7k/yr) — negative.
- The deal already cash-flows at list — no discount required.
- Meets the 1% rule at list price ($2k rent vs $130k).
- Recommended offer: $126k (3.0% below list) — sets the bar for market timing.
- Cap rate 4.6% vs local median 3.1% in Atlanta — top-decile yield for the area; either an underpriced asset or a hidden risk that comps aren't pricing in. Stress-test before assuming the spread holds.
Location & tenants
- Location reads 83/100 on livability (#6 in GA, #919 nationally) — a professional / high-income tenant draw. Strengths: amenities A+, commute A+, housing A+; Watch: cost of living C-.
- Atlanta Public Schools (urban): math 28% / reading 35% proficiency, ranked #80 of 174 in GA (top 46%) — families likely to look elsewhere, expect single-tenant / working-renter base with shorter leases; 71% free/reduced lunch — lower-income household profile, screen leases tightly.
- Zoned schools: Charles L. Gideons Elementary School (math 2% / reading 8%, grade F, #1,160 of 1,228 statewide, top 98%, 343 students, 100% FRL) — zoned schools average 100% FRL vs 71% district-wide (29 pts higher); higher-poverty schools than district average — tighter screening recommended.
- Zoned-school proficiency averages 5% at this address vs 32% district-wide (-26 pts) — the specific schools serving this property underperform the Atlanta Public Schools average; the district grade overstates school quality for this exact location.
- Market conditions: Rents rising (+2.8%/yr); 452 active listings in the ZIP; 40 comparable units currently listed for rent nearby; rentals at typical pace (median 24d on market — plan ~3-4 weeks tenant-placement turnaround); 11,565 units permitted in Fulton County in 2024 (8,159 in 5+ unit buildings).
- At $2,400/mo this rent would consume 54% of the median local household income ($53k/yr) (locally 1676% of renters already pay >50% of income on rent) — very limited rent-growth headroom before tenants either downsize or default.
Forward outlook
- Local home prices are declining (-3.0%/yr); year-one equity from $3k of loan paydown is wiped out by about $12k of value loss. Plan a longer hold.
- Fulton County population projected at +38% by 2050 — long-run rental-demand tailwind backs the buy-and-hold thesis.
Negotiation context
- It's been on market 56 days — a 3% lower offer ($126k) is reasonable based on typical stale-listing flexibility.
- 18 sale attempts since 18y ago with the ask held roughly flat each time — persistent listings suggest the price (not the market) is what's stuck; bring a comps-based counter.
Risks & watch-outs
- Watch-outs: built in 1920 — expect roof / HVAC / electrical / plumbing capex.
- Climate carrying-cost: moderate wind risk, 26% chance of damaging wind over 30y; extreme-heat days projected 7→18/yr by 2055 (HVAC capex compounding) — expect insurance premiums to compound above CPI over the hold.
Questions for the listing agent
- What do current leases actually rent for vs. the listed asking? Can we see a recent rent roll and the last 12 months of T-12 income?
- It's been on market 56 days. Have you received any prior offers? Is the seller open to a 3% concession, seller financing, or rate buy-down credit?
- Built in 1920 — when were the roof, HVAC, electrical panel, plumbing, and water heater last replaced?
- Is there a deadline driving the sale (1031 exchange, divorce, estate, relocation)? That informs how much negotiation room exists.
- The area grade is low — what's the realistic commute time and amenity access for the typical tenant pool here? Any planned neighborhood developments (good or bad) we should know about?
- What's the average days-on-market for RENTAL listings here right now (not sales)? A rising rental-DOM trend means longer vacancies and softer asking-rent achievability than the comps imply.
- What's the recent tenant-quality profile in this submarket — average credit score on applications, eviction rate, late-payment / NSF rate, and stable-employment percentage? A property-management company in the area should have these aggregated.
- How much new for-sale + rental construction is in the pipeline within 1–3 miles? Heavy new supply typically softens prices + rents 12–24 months out; constrained supply supports both.
Investment metrics
- 1% rule
- 0.58% ✗
- Cap rate
- 4.63%
- Cash-on-cash
- -5.96%
- DSCR
- 0.73
- GRM
- 14.4
CMA / ARV
- ARV (median comp)
- $414,418
- List price
- $130,000
- Delta
- -68.63%
- Verdict
- UNDERPRICED
- Comps
- 20 within 1.0 mi
Projected returns pro-forma
-3.0% appreciation · 2.77% rent growth · sell at horizon
- IRR
- -26.8%
- Equity multiple
- 0.10×
- Total profit
- $-104,595
- Equity at exit
- $61,791
- IRR
- -25.3%
- Equity multiple
- -0.22×
- Total profit
- $-141,408
- Equity at exit
- $35,831
Cash invested: $116,037 (down + closing). Projections, not guarantees.
Landlord ↔ Tenant lean methodology
- Overall (STATE)
- 90 Strongly Landlord-Friendly
- State Georgia
- 90 Strongly Landlord-Friendly · R+3
- County
- — inherits STATE
- City
- — inherits STATE
ZIP-level market 30310
- Home prices YoY
- -32.8%
- Rents YoY
- 2.8%
- Active inventory
- 452
- Price-to-rent
- 4.5×
Monthly cashflow live
- Estimated rent
- $2,400 high interval (Pro) →
- Mortgage (P&I)
- −$2,173
- Tax from tax record
- −$126 /mo · $1,515/yr
- Insurance
- −$173
- HOA
- −$0
- Vacancy / Maint / Mgmt
- −$504
- Net cashflow
- $-576
Break-even live
UW: 25.0% down · 7.5% · 30yr · 1.5% tax · 5.0% vac · 8.0% maint · 8.0% mgmt
Financing live
Cash to close
- Down payment
- $103,605
- Closing costs
- $12,433
- Reserves months
- —
- Total cash needed
- —
Loan-product check · same deal, 3 products live
Conventional
25% down · 7.5% · 30yr
- Down + closing
- —
- Monthly P&I
- —
- Monthly cashflow
- —
- DSCR
- —
- Eligible?
- —
Personal DTI + credit; lowest rate.
DSCR
20% down · 8.5% · 30yr
- Down + closing
- —
- Monthly P&I
- —
- Monthly cashflow
- —
- DSCR
- —
- Eligible?
- —
No personal income docs; deal must DSCR.
Hard money
10% down · 12.0% · 12mo
- Down + closing
- —
- Monthly P&I
- —
- Monthly cashflow
- —
- DSCR
- —
- Eligible?
- —
Short-term bridge; refi at stabilization.
Rent comps 40 comps
| Address | Beds | Baths | Sqft | Rent | $/sqft | DOM | Units | Dist |
|---|---|---|---|---|---|---|---|---|
| 1040 Smith St SW Atlanta, GA | 3.0 | 2.5 | 1500 | $1,595 | $1.06 | 24d | 1 | 0.06mi |
| 1048 Garibaldi St SW Atlanta, GA | 2.0 | 2.0 | 1280 | $2,150 | $1.68 | 24d | 1 | 0.07mi |
| 1151 Smith St SW Atlanta, GA | 3.0 | 2.5 | 1728 | $1,100 | $0.64 | 24d | 1 | 0.24mi |
| 1153 Smith St SW Atlanta, GA | 3.0 | 2.5 | 1728 | $2,023 | $1.17 | 12d | 1 | 0.25mi |
| 1141 Moton Ave SW Atlanta, GA | 3.0 | 3.0 | 1584 | $2,800 | $1.77 | 24d | 1 | 0.29mi |
| 1135 Coleman St SW Atlanta, GA | 3.0 | 2.5 | 1353 | $1,795 | $1.33 | 24d | 1 | 0.32mi |
| 504 Dunbar St SW Atlanta, GA | 3.0 | 2.5 | 1728 | $1,625 | $0.94 | 24d | 1 | 0.38mi |
| 1133 Mayland Cir SW Atlanta, GA | 3.0 | 2.0 | 1120 | $3,600 | $3.21 | 24d | 1 | 0.41mi |
| 564 Hope St SW Unit A Atlanta, GA | 4.0 | 2.0 | 1188 | $2,300 | $1.94 | 24d | 1 | 0.43mi |
| 610 Fletcher St SW Atlanta, GA | 3.0 | 2.5 | 1550 | $2,100 | $1.35 | 24d | 1 | 0.45mi |
| 600 Mayland Ave SW Atlanta, GA | 3.0 | 2.0 | 1100 | $2,300 | $2.09 | 24d | 1 | 0.45mi |
| 1063 Metropolitan Pkwy SW Atlanta, GA | 4.0 | 2.0 | 1700 | $1,700 | $1.00 | 24d | 1 | 0.49mi |
| 875 Beryl St SW Atlanta, GA | 3.0 | 2.5 | 2060 | $2,850 | $1.38 | 13d | 1 | 0.51mi |
| 518 Erin Ave SW Atlanta, GA | 2.0 | 1.0 | 1075 | $2,500 | $2.33 | 17d | 1 | 0.58mi |
| 404 Bass St SW Atlanta, GA | 3.0 | 2.0 | 1080 | $1,850 | $1.71 | 16d | 1 | 0.59mi |
| 547 Erin Ave SW Atlanta, GA | 3.0 | 2.0 | 1394 | $2,600 | $1.87 | 24d | 1 | 0.60mi |
| 547 Erin Ave SW Atlanta, GA | 3.0 | 2.0 | 1400 | $5,000 | $3.57 | 1d | 1 | 0.60mi |
| 776 Metropolitan Pkwy SW Atlanta, GA | 2.0–3.0 | 2.0–3.0 | 1212 | $2,410 | $1.99 | 1d | 6 | 0.62mi |
| 706 Catherine St SW Atlanta, GA | 3.0 | 2.0 | 1352 | $2,200 | $1.63 | 7d | 1 | 0.62mi |
| 685 Garibaldi St SW Atlanta, GA | 3.0 | 2.5 | 1868 | $1,900 | $1.02 | 18d | 1 | 0.64mi |
| 72 Ormond St SW Atlanta, GA | 3.0 | 2.0 | 1664 | $3,800 | $2.28 | 24d | 1 | 0.64mi |
| 697 Pryor St SW Unit 697 Atlanta, GA | 3.0 | 5.0 | 2000 | $4,250 | $2.12 | 5d | 1 | 0.68mi |
| 875 Hank Aaron Dr SW Atlanta, GA | 1.0–3.0 | 1.0–2.0 | 916 | $1,688 | $1.84 | 24d | 1 | 0.73mi |
| 444 Shannon Dr SW Atlanta, GA | 3.0 | 2.0 | 1600 | $2,450 | $1.53 | 24d | 1 | 0.73mi |
| 496 Shannon Dr SW Atlanta, GA | 3.0 | 2.0 | 1658 | $2,900 | $1.75 | 1d | 1 | 0.75mi |
| 496 Shannon Dr SW Atlanta, GA | 3.0 | 2.0 | 1658 | $3,250 | $1.96 | 2d | 1 | 0.75mi |
| 976 Dunning St SE Unit A Atlanta, GA | 3.0 | 2.5 | 1598 | $3,150 | $1.97 | 21d | 1 | 0.77mi |
| 1246 Allene Ave SW Atlanta, GA | 2.0 | 1.0–2.0 | 896 | $2,110 | $2.35 | 1d | 23 | 0.77mi |
| 802 Lowndes Ave SW Atlanta, GA | 3.0 | 2.0 | 1872 | $2,550 | $1.36 | 21d | 1 | 0.78mi |
| 1005 Linam Ave SE Atlanta, GA | 4.0 | 3.0 | 1757 | $3,000 | $1.71 | 24d | 1 | 0.78mi |
| 906 Allene Ave SW Atlanta, GA | 3.0 | 2.0 | 1500 | $3,500 | $2.33 | 21d | 1 | 0.81mi |
| 549 Lynnhaven Dr SW Atlanta, GA | 4.0 | 2.0 | 1215 | $2,450 | $2.02 | 24d | 1 | 0.81mi |
| 551 Lynnhaven Dr SW Atlanta, GA | 4.0 | 2.0 | 1597 | $2,450 | $1.53 | 24d | 1 | 0.82mi |
| 490 Lynnhaven Dr SW Atlanta, GA | 3.0 | 2.0 | 1289 | $2,395 | $1.86 | 4d | 1 | 0.82mi |
| 1054 Atlanta, GA | 3.0–4.0 | 2.0 | 1295 | $1,974 | $1.52 | 20d | 2 | 0.82mi |
| 72 Milton Ave SE Atlanta, GA | 2.0 | 1.0–2.0 | 818 | $2,107 | $2.57 | 1d | 24 | 0.83mi |
| 827 Elbert St SW Atlanta, GA | 3.0 | 2.0 | 1300 | $2,900 | $2.23 | 24d | 1 | 0.85mi |
| 992 Fern Ave SE Atlanta, GA | 3.0 | 3.0 | 2000 | $5,000 | $2.50 | 24d | 1 | 0.87mi |
| 51 Little St SE Atlanta, GA | 3.0 | 2.5 | 1478 | $2,995 | $2.03 | 24d | 1 | 0.89mi |
| 720 Hank Aaron Dr SE Atlanta, GA | 2.0 | 1.0–2.0 | 847 | $2,219 | $2.62 | 1d | 24 | 0.92mi |
Listing history 50 events
-
2026-06-18days on market $130,000 Active 56 DOM
-
2026-06-17days on market $130,000 Active 55 DOM
-
2026-06-16days on market $130,000 Active 54 DOM
-
2026-06-15days on market $130,000 Active 53 DOM
-
2026-06-13days on market $130,000 Active 51 DOM
-
2026-06-13days on market $130,000 Active 50 DOM
-
2026-06-09days on market $130,000 Active 47 DOM
-
2026-06-08days on market $130,000 Active 46 DOM
-
2026-06-07days on market $130,000 Active 45 DOM
-
2026-06-04days on market $130,000 Active 42 DOM
-
2026-06-03days on market $130,000 Active 41 DOM
-
2026-06-02days on market $130,000 Active 40 DOM
-
2026-06-01days on market $130,000 Active 39 DOM
-
2026-05-31days on market $130,000 Active 38 DOM
-
2026-04-23$130,000 Active 358-char remark
-
2025-10-11historical
-
2025-10-11historical
-
2025-05-10$120,000 New
-
2025-05-10$120,000 Active
-
2024-10-31historical
-
2024-10-31historical
-
2024-09-19price $140,000
-
2024-08-27price $155,000
-
2024-08-24price $155,000
-
2024-07-30status Back On Market
-
2024-07-24status Under Contract
-
2024-07-05$165,000 Active
-
2024-07-05$165,000 New
-
2023-12-31historical
-
2023-04-29$195,000 New
-
2022-09-13soldstatus $160,000 Sold
-
2022-09-13soldstatus $160,000 Closed
-
2022-09-13soldstatus $160,000
-
2022-08-09status Pending
-
2022-08-09status Under Contract
-
2022-07-22$165,000 New
-
2022-07-21$165,000 Active
-
2021-12-22status Pending
-
2021-12-21soldstatus $125,000 Closed
-
2021-12-21soldstatus $125,000
-
2021-11-13price $150,000
-
2021-11-07price $165,000
-
2021-10-06$180,000 Active
-
2019-01-25soldstatus $73,500
-
2019-01-22soldstatus $73,500 Sold
-
2019-01-22soldstatus $73,500 Sold
-
2019-01-03status Under Contract
-
2019-01-03status Pending Offer Approval
-
2019-01-03status Pending
-
2018-12-20price $73,500
ⓘ Source: listings_history table (triggers on properties + properties_extension) + one-shot
backfill from property_details.listing_events for pre-trigger history.
Tax reassessment forecast GA · Resets to sale price
- Current annual tax
- $1,515 · $126/mo
- Projected year-2 tax
- $1,515 · $126/mo
- Expected delta
- $0/yr ($0/mo · 0.0%)
ⓘ Screening estimate from a state-policy table — verify with the county assessor before closing.
Climate risk First Street
- Flood 1/10 Low FEMA zone X (unshaded) · 0% chance over 30 yrs
- Wildfire 1/10 Low
- Heat 5/10 Major 7 d/yr ≥104°F today · 18 d/yr by 30 yrs out
- Wind 5/10 Major 26% chance of damaging wind over 30 yrs
- Air quality 4/10 Moderate 4 unhealthy d/yr today · 6 by 30 yrs out
Nearby sold comps map
Loading sold comps map…
Walkable amenities ~0.75 mi
Loading nearby amenities…
Taxation est. · year 1
- Rental income
- $28,804
- − Mortgage interest
- −$23,214
- − Property taxes
- −$1,515
- − Insurance
- −$2,072
- − Repairs & maintenance
- −$2,304
- − Management
- −$2,304
- − Depreciation
- −$12,056
- Taxable loss
- −$14,662
- Est. tax savings @ 24.0%
- +$3,519
- After-tax cash flow
- $-3,393/yr
For passive investors: Depreciation is non-cash, so a rental often shows a tax loss while cash-flowing — sheltering income. Rental losses are passive: they offset passive income freely, and up to $25,000/yr can offset ordinary (W-2) income if you actively participate and your MAGI is under $100k (phasing out to $0 by $150k); unused losses carry forward. On sale, claimed depreciation is recaptured at up to 25%, and gains may owe capital-gains tax (a 1031 exchange can defer both). Figures are a year-1 estimate at your 24.0% rate — not tax advice; consult a CPA.
Schools (NCES district)
- District
- Atlanta Public Schools
- NCES district ID
- 1300120
- Math proficiency
- 28% ▼ -6.00%
- Reading proficiency
- 35% ▼ -2.00%
- Median HH income
- $48,306
- Composite
- 27.27/100
- National rank
- #7006
- State rank
- #80 of 174 in GA
Livability — Atlanta
- Score
- 83/100
- State rank
- #6
- US rank
- #919
Category grades
Schools grade is shown separately in the Schools card above.
Census & demographics
- Census place
- Atlanta, GA
- County
- Fulton County · 1,094,430 people
- City population
- 629,525
- Metro
- Atlanta-Sandy Springs-Alpharetta, GA
- Population (ZIP)
- 27,186
- Household income
- $53,037
- Rent vs Own
- Severe rent burden
- 1676.0
Population outlook (Fulton County) Hauer SSP2
- Today (2025)
- 1,203,707 people
- By 2030
- 1,299,706 · +8.0%
- By 2040
- 1,488,256 · +23.6%
- By 2050
- 1,664,580 · +38.3%
- By 2075
- 2,036,072 · +69.2%
- By 2100
- 2,222,402 · +84.6%
Race, ethnicity, and origin ACS 2023
- Neighborhood character
- Predominantly Black (76%)
- Race & ethnicity
- Black 76% White 14% Two or more races 4% Hispanic / Latino 4% Asian 2%
- Common ancestry
- Lithuanian 1% Slovak 1% Serbian 0%
- Foreign-born
- 5% · Canada, South Korea, Vietnam
- Languages at home
- 92% English-only · Spanish 4% French/Haitian/Cajun 1% Other Indo-European 1%
Political lean MEDSL · Fulton
- 2024 margin
- Solid D (+44.9) · D 71.9% · R 27.0% · Other 1.1%
- 2008→2024 swing
- +9.8pp toward D · 2008: 35.0pp · 2024: 44.9pp
- All cycles
- 2024: D+44.9 2020: D+46.4 2016: D+42.1 2012: D+29.6 2008: D+35.0
Not yet ingested
- Civics
- —
Market trends
- HPI YoY
- ▼ -204.00%
- Current HPI
- 418.7297
- Rent YoY
- ▲ 2.77%
- Metro
- Atlanta-Sandy Springs-Alpharetta, GA
- State GDP YoY
- ▲ 2.66%
- F500 in state
- 28
Industry mix (Fortune 500 HQ in GA)
| Industry | F500 HQs | Revenue |
|---|---|---|
| Paper / Packaging | 2 | $29B |
|
||
| Retail | 1 | $160B |
|
||
| Transportation / Logistics | 1 | $91B |
|
||
| Airlines | 1 | $62B |
|
||
| Consumer Goods | 1 | $47B |
|
||
| Utilities | 1 | $25B |
|
||
Price history
+584.2% since first listed55 events — show timeline
- 2026-04-23 Listed $130,000 FMLS
- 2025-10-11 Listing Removed — FMLS
- 2025-10-11 Listing Removed — GAMLS
- 2025-05-10 Listed $120,000 FMLS
- 2025-05-10 Listed $120,000 GAMLS
- 2024-10-31 Listing Removed — GAMLS
- 2024-10-31 Listing Removed — FMLS
- 2024-09-19 Price Changed $140,000 FMLS
- 2024-08-27 Price Changed $155,000 FMLS
- 2024-08-24 Price Changed $155,000 GAMLS
- 2024-07-30 Relisted — GAMLS
- 2024-07-24 Pending — GAMLS
- 2024-07-05 Listed $165,000 GAMLS
- 2024-07-05 Listed $165,000 FMLS
- 2023-12-31 Listing Removed — GAMLS
- 2023-04-29 Listed $195,000 GAMLS
- 2022-09-13 Sold (Public Records) $160,000 Public Records
- 2022-09-13 Sold (MLS) $160,000 FMLS
- 2022-09-13 Sold (MLS) $160,000 GAMLS
- 2022-08-09 Pending — FMLS
- 2022-08-09 Pending — GAMLS
- 2022-07-22 Listed $165,000 GAMLS
- 2022-07-21 Listed $165,000 FMLS
- 2021-12-22 Pending — FMLS
- 2021-12-21 Sold (Public Records) $125,000 Public Records
- 2021-12-21 Sold (MLS) $125,000 FMLS
- 2021-11-13 Price Changed $150,000 FMLS
- 2021-11-07 Price Changed $165,000 FMLS
- 2021-10-06 Listed $180,000 FMLS
- 2019-01-25 Sold (Public Records) $73,500 Public Records
- 2019-01-22 Sold (MLS) $73,500 GAMLS
- 2019-01-22 Sold (MLS) $73,500 FMLS
- 2019-01-03 Pending — GAMLS
- 2019-01-03 Pending — GAMLS
- 2019-01-03 Pending — FMLS
- 2018-12-20 Price Changed $73,500 GAMLS
- 2018-12-19 Price Changed $73,500 FMLS
- 2018-12-07 Listed $75,000 GAMLS
- 2018-12-07 Listed $75,000 FMLS
- 2018-10-01 Sold (MLS) $50,000 GAMLS
- 2018-09-28 Sold (MLS) $50,000 FMLS
- 2018-09-07 Pending — GAMLS
- 2018-09-07 Pending — FMLS
- 2018-08-29 Listed $55,000 GAMLS
- 2018-08-29 Listed $55,000 FMLS
- 2018-06-19 Listing Removed — GAMLS
- 2018-06-14 Relisted — GAMLS
- 2018-05-02 Pending — GAMLS
- 2018-04-26 Listed $50,000 GAMLS
- 2018-01-01 Listing Removed — GAMLS
- 2017-10-16 Listed $40,000 GAMLS
- 2008-09-19 Sold (MLS) $5,000 FMLS
- 2008-02-16 Listed $10,000 FMLS
- 2003-12-30 Sold (Public Records) $145,000 Public Records
- 1995-03-22 Sold (Public Records) $19,000 Public Records
Property tax history
+0.4%/yrLatest (2025): $1,515 · +56.0% YoY. Source: county tax records.
Cash-flow waterfall
monthlySold comps — $/sqft
last 12 mo · ≤1 miLoading sold comps…