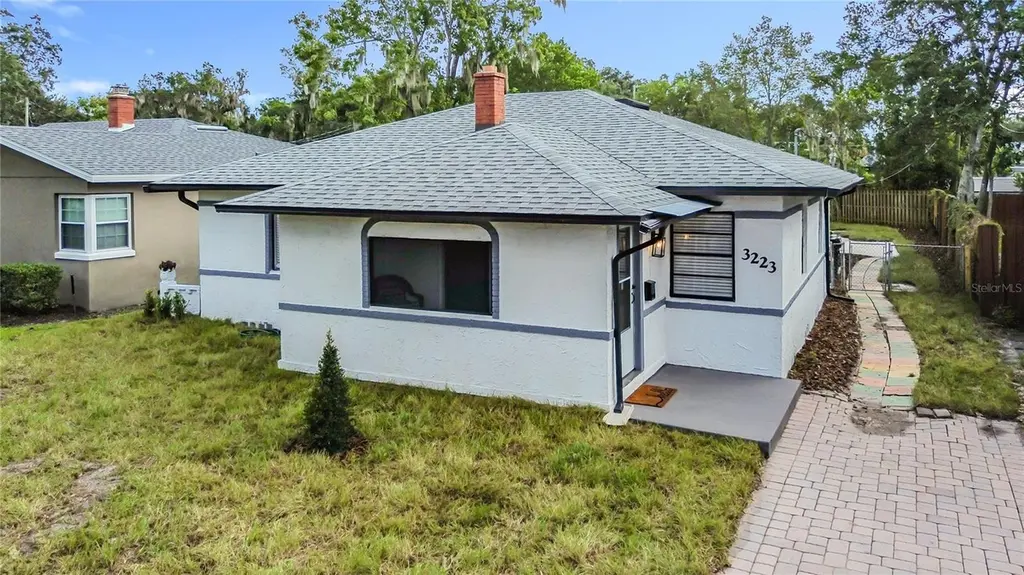
3223 N Orange Ave · Orlando, FL
Flood risk 1/10 · Minimal
- FEMA flood zone
- X (unshaded)
- Chance of flooding over 30 yrs
- 0.0%
- Est. flood insurance / yr
- $507 – $1,088
Fire risk 1/10 · Minimal
- Est. fire insurance / yr
- $947 – $1,759
Heat risk 9/10 · Severe
- Hot days now (above 107°F)
- 7 days/yr
- Hot days in 30 yrs
- 23 days/yr
Wind risk 9/10 · Severe
- Chance of severe wind over 30 yrs
- 99.0%
Air-quality risk 2/10 · Minimal
- Unhealthy air days now
- 0 days/yr
- Unhealthy air days in 30 yrs
- 1 days/yr
Risk factors via First Street. Map © Google.
Why this score? — see what drove the D grade
The composite is a weighted blend of 9 inputs, each scored 0–100. Each bar is that input's sub-score; the figure is the points it added to the 100-point composite (weight × sub-score).
- ARV discount +15.0/15.0
- Cash flow +10.2/30.0
- Livability +4.3/5.0
- Schools +4.1/10.0
- Rent growth +3.2/5.0
- DSCR +2.9/10.0
- 1% rule +2.5/10.0
- Condition / age +2.5/5.0
- Appreciation +0.0/10.0
$399,000
🖨 Deal sheet 📄 Offer letter ✓ Due diligence
Listing remarks
Auction Property. List price is the starting auction price only — seller will review Highest & Best offers next Monday 12PM. Don’t miss this incredible opportunity! This property is being offered in an auction-style sale with all offers submitted as “Highest & Best” by next Monday. Whether you’re an investor, first-time buyer, or looking for your next project, this is your chance to secure a great property at a competitive price. Featuring strong potential, desirable location, and endless possibilities, this home is ready for its next owner to make it their own. Buyers are encouraged to complete all inspections and due diligence prior to submitting
Key facts
- Near winter park
- No hoa fees
- 8,324 sq ft lot
Tags
Property features AI
Exterior
- Utilities: Public water; Public sewer; Other utilities
- Home design: Single-family residence; One story; Faces west; Residential property
- Construction: Block construction; Shingle roof; Block foundation; Other foundation
- Exterior features: Exterior lighting; Sidewalk
Interior
- Kitchen: Dishwasher; Microwave; Range; Refrigerator
- Bedrooms: 3 bedrooms
- Flooring: Vinyl flooring
- Bathrooms: 2 full bathrooms
- Heating & cooling: Central heating; Central air conditioning
- Interior features: Ceiling fans; Other interior features
- Laundry & utility: Laundry closet
Neighborhood map
What this means for you Summary
Snapshot
- This is a 2-bed/2.0-bath single-family listed at $399k.
Deal economics
- At list price, monthly cash flow is $-228 ($-3k/yr) — negative.
- To cash-flow at today's rent, offer at most $359k (10.1% below list).
- To meet the 1% rule (rent ≥ 1% of price), the offer needs to be $298k (25.2% below list).
- Recommended offer: $298k (25.2% below list) — sets the bar for 1% rule.
- Cap rate 5.6% vs local median 3.0% in Orlando — top-decile yield for the area; either an underpriced asset or a hidden risk that comps aren't pricing in. Stress-test before assuming the spread holds.
Location & tenants
- Location reads 86/100 on livability (#12 in FL, #360 nationally) — a professional / high-income tenant draw. Strengths: amenities A+, commute A+, housing A+.
- Orange (suburban): math 46% / reading 51% proficiency, ranked #43 of 73 in FL (top 59%) — families likely to look elsewhere, expect single-tenant / working-renter base with shorter leases.
- Market conditions: Rents rising (+2.6%/yr); 180 active listings in the ZIP; 21 comparable units currently listed for rent nearby; rentals at typical pace (median 18d on market — plan ~3-4 weeks tenant-placement turnaround); solid renter incomes; 8,053 units permitted in Orange County in 2024 (3,133 in 5+ unit buildings).
- This rent runs 33% of the median local income ($108k/yr) — at the standard rent-burdened threshold; future hikes will face affordability resistance.
Forward outlook
- Local home prices are declining (-3.0%/yr); year-one equity from $3k of loan paydown is wiped out by about $12k of value loss. Plan a longer hold.
- Orange County population projected at +52% by 2050 — long-run rental-demand tailwind backs the buy-and-hold thesis.
Negotiation context
- It's been on market 47 days — a 3% lower offer ($387k) is reasonable based on typical stale-listing flexibility.
- 8 sale attempts; this cycle's ask has dropped $126k (24%) from the opening price — seller is motivated, your offer sets the floor, not the list.
Risks & watch-outs
- Watch-outs: built in 1949 — expect roof / HVAC / electrical / plumbing capex.
- Climate carrying-cost: severe wind risk, 99% chance of damaging wind over 30y; extreme-heat days projected 7→23/yr by 2055 (HVAC capex compounding) — expect insurance premiums to compound above CPI over the hold.
Questions for the listing agent
- What do current leases actually rent for vs. the listed asking? Can we see a recent rent roll and the last 12 months of T-12 income?
- It's been on market 47 days. Have you received any prior offers? Is the seller open to a 25% concession, seller financing, or rate buy-down credit?
- Built in 1949 — when were the roof, HVAC, electrical panel, plumbing, and water heater last replaced?
- Is there a deadline driving the sale (1031 exchange, divorce, estate, relocation)? That informs how much negotiation room exists.
- Schools are B-rated — typically a magnet for longer-tenancy family renters. What's the average tenant stay here, and is there a school-zone premium baked into asking?
- The area grade is low — what's the realistic commute time and amenity access for the typical tenant pool here? Any planned neighborhood developments (good or bad) we should know about?
- What's the average days-on-market for RENTAL listings here right now (not sales)? A rising rental-DOM trend means longer vacancies and softer asking-rent achievability than the comps imply.
- What's the recent tenant-quality profile in this submarket — average credit score on applications, eviction rate, late-payment / NSF rate, and stable-employment percentage? A property-management company in the area should have these aggregated.
- How much new for-sale + rental construction is in the pipeline within 1–3 miles? Heavy new supply typically softens prices + rents 12–24 months out; constrained supply supports both.
Investment metrics
- 1% rule
- 0.75% ✗
- Cap rate
- 5.61%
- Cash-on-cash
- -2.45%
- DSCR
- 0.89
- GRM
- 11.1
CMA / ARV
- ARV (on-the-fly)
- $711,396
- Comps found
- 5
Show comp detail 5 sales within ~0.75 mi
| Address | Dist | Beds/Ba | Sqft | Sold | Price | $/sf | Match |
|---|---|---|---|---|---|---|---|
| 813 Chichester St | 0.19mi | 2/2.0 | 2,009 (+7%) | 18mo | $673,350 | $335 | 65 |
| 1314 Canterbury Rd | 0.42mi | 2/2.0 | 1,738 (-8%) | 7mo | $810,000 | $466 | 62 |
| 1340 Pelham Rd | 0.39mi | 3/2.0 (+1) | 2,042 (+8%) | 8mo | $771,000 | $378 | 56 |
| 1015 Chichester St | 0.35mi | 3/2.0 (+1) | 1,655 (-12%) | 17mo | $799,500 | $483 | 44 |
| 3215 Helen Ave | 0.67mi | 3/2.0 (+1) | 2,013 (+7%) | 15mo | $750,000 | $373 | 39 |
Match score weights: distance 35% · size 25% · config 20% · recency 20%. Top-matched comps best support the ARV.
Projected returns pro-forma
-3.0% appreciation · 2.64% rent growth · sell at horizon
- IRR
- -20.8%
- Equity multiple
- 0.28×
- Total profit
- $-80,318
- Equity at exit
- $59,492
- IRR
- -14.9%
- Equity multiple
- 0.17×
- Total profit
- $-93,278
- Equity at exit
- $34,498
Cash invested: $111,720 (down + closing). Projections, not guarantees.
Landlord ↔ Tenant lean methodology
- Overall (STATE)
- 87 Strongly Landlord-Friendly
- State Florida
- 87 Strongly Landlord-Friendly · R+3
- County
- — inherits STATE
- City
- — inherits STATE
ZIP-level market 32803
- Rents YoY
- 2.6%
- Active inventory
- 180
- Price-to-rent
- 11.1×
Monthly cashflow live
- Estimated rent
- $2,984 high interval (Pro) →
- Mortgage (P&I)
- −$2,092
- Tax from tax record
- −$327 /mo · $3,924/yr
- Insurance
- −$166
- HOA
- −$0
- Vacancy / Maint / Mgmt
- −$627
- Net cashflow
- $-228
Break-even live
UW: 25.0% down · 7.5% · 30yr · 1.5% tax · 5.0% vac · 8.0% maint · 8.0% mgmt
Financing live
Cash to close
- Down payment
- $99,750
- Closing costs
- $11,970
- Reserves months
- —
- Total cash needed
- —
Loan-product check · same deal, 3 products live
Conventional
25% down · 7.5% · 30yr
- Down + closing
- —
- Monthly P&I
- —
- Monthly cashflow
- —
- DSCR
- —
- Eligible?
- —
Personal DTI + credit; lowest rate.
DSCR
20% down · 8.5% · 30yr
- Down + closing
- —
- Monthly P&I
- —
- Monthly cashflow
- —
- DSCR
- —
- Eligible?
- —
No personal income docs; deal must DSCR.
Hard money
10% down · 12.0% · 12mo
- Down + closing
- —
- Monthly P&I
- —
- Monthly cashflow
- —
- DSCR
- —
- Eligible?
- —
Short-term bridge; refi at stabilization.
Rent comps 21 comps
| Address | Beds | Baths | Sqft | Rent | $/sqft | DOM | Units | Dist |
|---|---|---|---|---|---|---|---|---|
| 1404 Clay St Winter Park, FL | 3.0 | 2.0 | 1440 | $2,800 | $1.94 | 17d | 1 | 0.29mi |
| 2680 N Orange Ave Orlando, FL | 3.0 | 1.0–3.0 | 1054 | $2,983 | $2.83 | 2d | 33 | 0.31mi |
| 2916 Westchester Ave Orlando, FL | 3.0 | 2.0 | 1824 | $4,000 | $2.19 | 23d | 1 | 0.37mi |
| 2650 Dade Ave Orlando, FL | 2.0 | 1.0–2.0 | 942 | $2,659 | $2.82 | 1d | 23 | 0.38mi |
| 1415 Harmon Ave Winter Park, FL | 3.0 | 2.5 | 1700 | $3,060 | $1.80 | 21d | 1 | 0.47mi |
| 1761 Indiana Ave Winter Park, FL | 3.0 | 2.5 | 1598 | $2,795 | $1.75 | 7d | 1 | 0.48mi |
| 225 W King St Orlando, FL | 3.0 | 2.0 | 1276 | $2,429 | $1.90 | 23d | 1 | 0.66mi |
| 3400 Golfview Blvd Unit A Orlando, FL | 3.0 | 2.5 | 1900 | $3,695 | $1.94 | 11d | 1 | 0.97mi |
| 3400 Golfview Blvd Orlando, FL | 3.0 | 2.5 | 1900 | $3,695 | $1.94 | 10d | 1 | 0.97mi |
| 1460 Alden Rd Orlando, FL | 1.0–3.0 | 1.0–3.0 | 1020 | $2,799 | $2.74 | 1d | 39 | 0.99mi |
| 1650 N Mills Ave Orlando, FL | 3.0 | 1.0–2.0 | 974 | $2,584 | $2.65 | 1d | 17 | 1.00mi |
| 438 Lakeview Ave Winter Park, FL | 2.0 | 1.0 | 1250 | $3,200 | $2.56 | 23d | 1 | 1.02mi |
| 1137 S Pennsylvania Ave Winter Park, FL | 3.0 | 2.0 | 1500 | $2,995 | $2.00 | 4d | 1 | 1.09mi |
| 784 S Pennsylvania Ave Winter Park, FL | 3.0 | 2.5 | 1940 | $5,500 | $2.84 | 23d | 1 | 1.21mi |
| 782 S Pennsylvania Ave #1 Winter Park, FL | 3.0 | 2.5 | 2354 | $5,490 | $2.33 | 23d | 1 | 1.21mi |
| 612 Stetson St Orlando, FL | 3.0 | 1.0 | 1400 | $2,599 | $1.86 | 23d | 1 | 1.25mi |
| 1510 Altaloma Ave Unit B Orlando, FL | 1.0 | 1.0 | 1640 | $1,449 | $0.88 | 10d | 1 | 1.27mi |
| 151 N Orlando Ave Winter Park, FL | 2.0–3.0 | 1.0–2.0 | 1134 | $2,500 | $2.20 | 4d | 3 | 1.37mi |
| 151 N Orlando Ave Winter Park, FL | 3.0 | 1.0–2.0 | 1500 | $2,500 | $1.67 | 23d | 2 | 1.37mi |
| 1219 Lake Highland Dr Orlando, FL | 3.0 | 2.0 | 1320 | $2,500 | $1.89 | 23d | 1 | 1.37mi |
| 301 W Comstock Ave Winter Park, FL | 2.0 | 2.5 | 1500 | $6,000 | $4.00 | 23d | 1 | 1.46mi |
Listing history 50 events
-
2026-06-18days on market $399,000 Active 47 DOM
-
2026-06-17days on market $399,000 Active 46 DOM
-
2026-06-16days on market $399,000 Active 45 DOM
-
2026-06-15days on market $399,000 Active 44 DOM
-
2026-06-13days on market $399,000 Active 42 DOM
-
2026-06-13days on market $399,000 Active 41 DOM
-
2026-06-09days on market $399,000 Active 38 DOM
-
2026-06-08remarks 661-char remark
-
2026-06-08pricedays on market $399,000 Active 37 DOM
-
2026-06-07days on market $519,000 Active 36 DOM
-
2026-06-04days on market $519,000 Active 33 DOM
-
2026-06-03days on market $519,000 Active 32 DOM
-
2026-06-02days on market $519,000 Active 31 DOM
-
2026-06-02days on market $519,000 Active 30 DOM
-
2026-05-31days on market $519,000 Active 29 DOM
-
2026-05-15price $519,000
-
2026-05-02$524,900 Active
-
2026-05-01historical
-
2026-04-22price $525,000
-
2026-04-01price $529,999
-
2026-03-11$539,999 Active
-
2026-03-09historical
-
2026-03-04status Active
-
2026-03-03status Pending
-
2026-02-26price $549,000
-
2026-02-18price $565,000
-
2026-02-06price $569,000
-
2026-02-03price $574,900
-
2026-02-03status Active
-
2026-01-30status Pending
-
2026-01-16price $575,000
-
2026-01-04price $589,000
-
2025-12-03price $599,000
-
2025-11-19price $625,000
-
2025-11-12price $629,000
-
2025-11-04price $635,000
-
2025-10-24price $639,000
-
2025-10-17price $645,000
-
2025-10-09$649,990 Active
-
2025-08-25soldstatus $371,000 Closed
-
2025-08-07status Pending
-
2025-08-03price $399,900
-
2025-08-01status Active
-
2025-07-25status Pending
-
2025-07-21price $439,900
-
2025-07-13price $479,900
-
2025-07-11status Active
-
2025-07-01status Pending
-
2025-06-24price $499,990
-
2025-06-13$519,900 Active
ⓘ Source: listings_history table (triggers on properties + properties_extension) + one-shot
backfill from property_details.listing_events for pre-trigger history.
Tax reassessment forecast FL · Resets to sale price
- Current annual tax
- $3,924 · $327/mo
- Projected year-2 tax
- $3,924 · $327/mo
- Expected delta
- $0/yr ($0/mo · -0.0%)
ⓘ Screening estimate from a state-policy table — verify with the county assessor before closing.
Climate risk First Street
- Flood 1/10 Low FEMA zone X (unshaded) · 0% chance over 30 yrs
- Wildfire 1/10 Low
- Heat 9/10 Extreme 7 d/yr ≥107°F today · 23 d/yr by 30 yrs out
- Wind 9/10 Extreme 99% chance of damaging wind over 30 yrs
- Air quality 2/10 Low 0 unhealthy d/yr today · 1 by 30 yrs out
Nearby sold comps map
Loading sold comps map…
Walkable amenities ~0.75 mi
Loading nearby amenities…
Taxation est. · year 1
- Rental income
- $35,812
- − Mortgage interest
- −$22,350
- − Property taxes
- −$3,924
- − Insurance
- −$1,995
- − Repairs & maintenance
- −$2,865
- − Management
- −$2,865
- − Depreciation
- −$11,607
- Taxable loss
- −$9,795
- Est. tax savings @ 24.0%
- +$2,351
- After-tax cash flow
- $-386/yr
For passive investors: Depreciation is non-cash, so a rental often shows a tax loss while cash-flowing — sheltering income. Rental losses are passive: they offset passive income freely, and up to $25,000/yr can offset ordinary (W-2) income if you actively participate and your MAGI is under $100k (phasing out to $0 by $150k); unused losses carry forward. On sale, claimed depreciation is recaptured at up to 25%, and gains may owe capital-gains tax (a 1031 exchange can defer both). Figures are a year-1 estimate at your 24.0% rate — not tax advice; consult a CPA.
Schools (NCES district)
- District
- Orange
- NCES district ID
- 1201440
- Math proficiency
- 46% ▼ -9.00%
- Reading proficiency
- 51% ▼ -2.00%
- Median HH income
- $49,350
- Composite
- 41.47/100
- National rank
- #3461
- State rank
- #43 of 73 in FL
Livability — Orlando
- Score
- 86/100
- State rank
- #12
- US rank
- #360
Category grades
Schools grade is shown separately in the Schools card above.
Census & demographics
- Census place
- Orlando, FL
- County
- Orange County · 1,471,359 people
- City population
- 964,969
- Metro
- Orlando-Kissimmee-Sanford, FL
- Population (ZIP)
- 22,152
- Household income
- $107,592
- Rent vs Own
- Severe rent burden
- 793.0
Population outlook (Orange County) Hauer SSP2
- Today (2025)
- 1,618,226 people
- By 2030
- 1,787,404 · +10.5%
- By 2040
- 2,125,621 · +31.4%
- By 2050
- 2,454,016 · +51.6%
- By 2075
- 3,173,711 · +96.1%
- By 2100
- 3,607,781 · +122.9%
Race, ethnicity, and origin ACS 2023
- Neighborhood character
- Predominantly White (69%)
- Race & ethnicity
- White 69% Hispanic / Latino 17% Two or more races 13% Asian 5% Black 4%
- Hispanic origin (detail)
- Mexican 2% Puerto Rican 7% Cuban 2%
- Common ancestry
- Romanian 3% Slovak 3% Italian 2%
- Foreign-born
- 8% · Canada, Dominican Republic, Vietnam
- Languages at home
- 85% English-only · Spanish 10% Other Indo-European 1% Tagalog/Filipino 1%
Political lean MEDSL · Orange
- 2024 margin
- D (+13.6) · D 56.1% · R 42.5% · Other 1.3%
- 2008→2024 swing
- -5.0pp toward R · 2008: 18.6pp · 2024: 13.6pp
- All cycles
- 2024: D+13.6 2020: D+23.1 2016: D+24.6 2012: D+18.2 2008: D+18.6
Not yet ingested
- Civics
- —
Market trends
- HPI YoY
- ▼ -505.52%
- Current HPI
- 303.0942
- Rent YoY
- ▲ 2.64%
- Metro
- Orlando-Kissimmee-Sanford, FL
- State GDP YoY
- ▲ 3.28%
- F500 in state
- 36
Industry mix (Fortune 500 HQ in FL)
| Industry | F500 HQs | Revenue |
|---|---|---|
| Industrial Technology | 2 | $29B |
|
||
| Insurance | 2 | $17B |
|
||
| Retail | 1 | $60B |
|
||
| Technology Distribution | 1 | $58B |
|
||
| Homebuilding | 1 | $35B |
|
||
| Technology Manufacturing | 1 | $35B |
|
||
Price history
+1630.0% since first listed36 events — show timeline
- 2026-05-15 Price Changed $519,000 Stellar MLS as Distributed by MLS Grid
- 2026-05-02 Listed $524,900 Stellar MLS as Distributed by MLS Grid
- 2026-05-01 Listing Removed — Stellar MLS as Distributed by MLS Grid
- 2026-04-22 Price Changed $525,000 Stellar MLS as Distributed by MLS Grid
- 2026-04-01 Price Changed $529,999 Stellar MLS as Distributed by MLS Grid
- 2026-03-11 Listed $539,999 Stellar MLS as Distributed by MLS Grid
- 2026-03-09 Listing Removed — Stellar MLS as Distributed by MLS Grid
- 2026-03-04 Relisted — Stellar MLS as Distributed by MLS Grid
- 2026-03-03 Pending — Stellar MLS as Distributed by MLS Grid
- 2026-02-26 Price Changed $549,000 Stellar MLS as Distributed by MLS Grid
- 2026-02-18 Price Changed $565,000 Stellar MLS as Distributed by MLS Grid
- 2026-02-06 Price Changed $569,000 Stellar MLS as Distributed by MLS Grid
- 2026-02-03 Price Changed $574,900 Stellar MLS as Distributed by MLS Grid
- 2026-02-03 Relisted — Stellar MLS as Distributed by MLS Grid
- 2026-01-30 Pending — Stellar MLS as Distributed by MLS Grid
- 2026-01-16 Price Changed $575,000 Stellar MLS as Distributed by MLS Grid
- 2026-01-04 Price Changed $589,000 Stellar MLS as Distributed by MLS Grid
- 2025-12-03 Price Changed $599,000 Stellar MLS as Distributed by MLS Grid
- 2025-11-19 Price Changed $625,000 Stellar MLS as Distributed by MLS Grid
- 2025-11-12 Price Changed $629,000 Stellar MLS as Distributed by MLS Grid
- 2025-11-04 Price Changed $635,000 Stellar MLS as Distributed by MLS Grid
- 2025-10-24 Price Changed $639,000 Stellar MLS as Distributed by MLS Grid
- 2025-10-17 Price Changed $645,000 Stellar MLS as Distributed by MLS Grid
- 2025-10-09 Listed $649,990 Stellar MLS as Distributed by MLS Grid
- 2025-08-25 Sold (MLS) $371,000 Stellar MLS as Distributed by MLS Grid
- 2025-08-07 Pending — Stellar MLS as Distributed by MLS Grid
- 2025-08-03 Price Changed $399,900 Stellar MLS as Distributed by MLS Grid
- 2025-08-01 Relisted — Stellar MLS as Distributed by MLS Grid
- 2025-07-25 Pending — Stellar MLS as Distributed by MLS Grid
- 2025-07-21 Price Changed $439,900 Stellar MLS as Distributed by MLS Grid
- 2025-07-13 Price Changed $479,900 Stellar MLS as Distributed by MLS Grid
- 2025-07-11 Relisted — Stellar MLS as Distributed by MLS Grid
- 2025-07-01 Pending — Stellar MLS as Distributed by MLS Grid
- 2025-06-24 Price Changed $499,990 Stellar MLS as Distributed by MLS Grid
- 2025-06-13 Listed $519,900 Stellar MLS as Distributed by MLS Grid
- 1976-06-01 Sold (Public Records) $30,000 Public Records
Property tax history
+5.2%/yrLatest (2025): $3,924 · +4.4% YoY. Source: county tax records.
Cash-flow waterfall
monthlySold comps — $/sqft
last 12 mo · ≤1 miLoading sold comps…