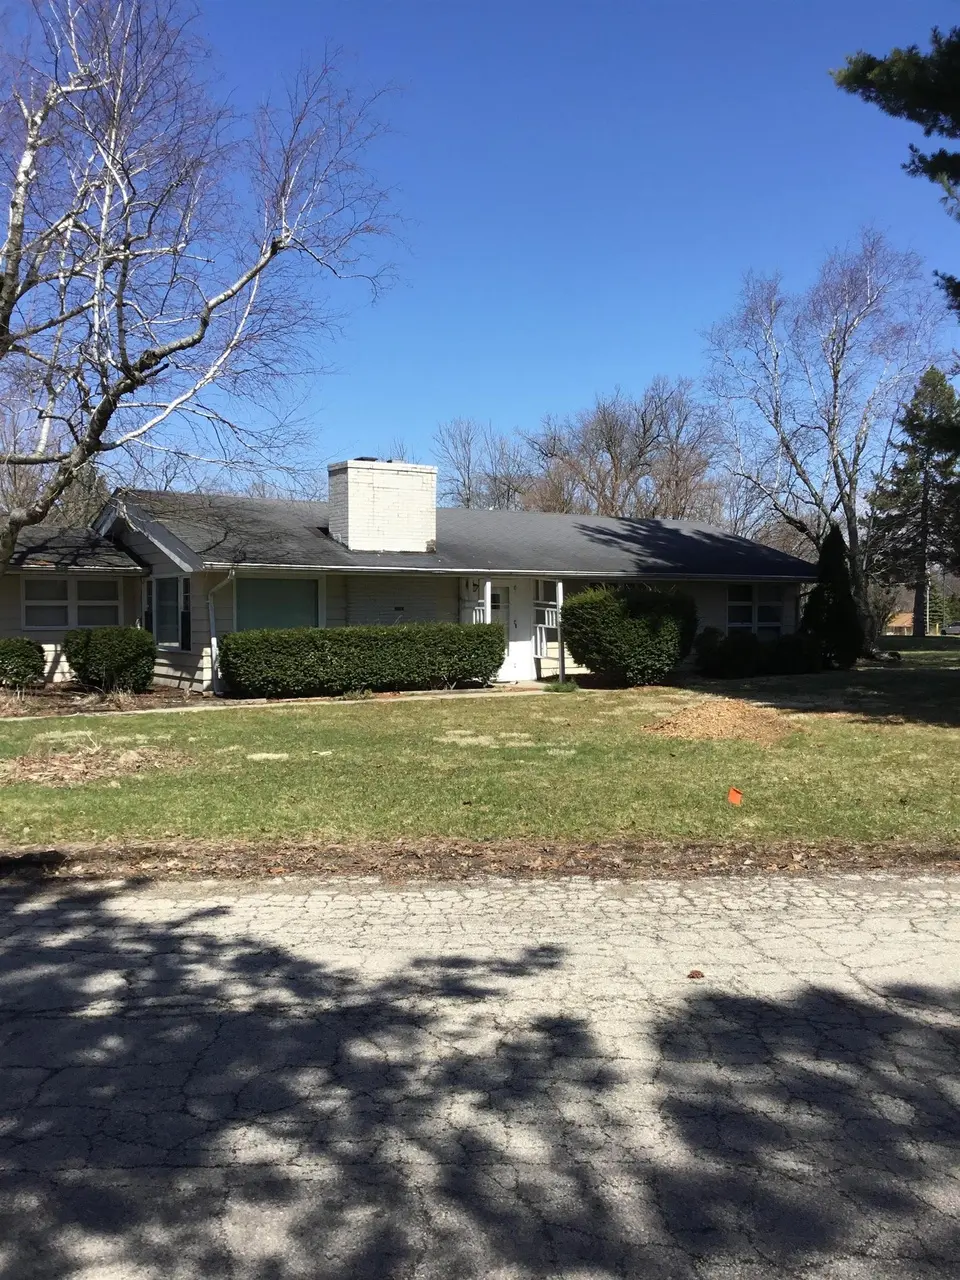
2040 Hillside Dr · Rockford, IL
Flood risk 1/10 · Minimal
- FEMA flood zone
- X (unshaded)
- Chance of flooding over 30 yrs
- 0.0%
- Est. flood insurance / yr
- $507 – $1,088
Fire risk 1/10 · Minimal
- Est. fire insurance / yr
- $804 – $1,492
Heat risk 2/10 · Minimal
- Hot days now (above 101°F)
- 7 days/yr
- Hot days in 30 yrs
- 14 days/yr
Wind risk 2/10 · Minimal
- Chance of severe wind over 30 yrs
- —
Air-quality risk 3/10 · Minor
- Unhealthy air days now
- 2 days/yr
- Unhealthy air days in 30 yrs
- 3 days/yr
Risk factors via First Street. Map © Google.
Why this score? — see what drove the D+ grade
The composite is a weighted blend of 9 inputs, each scored 0–100. Each bar is that input's sub-score; the figure is the points it added to the 100-point composite (weight × sub-score).
- Cash flow +21.3/30.0
- DSCR +6.8/10.0
- 1% rule +5.9/10.0
- ARV discount +4.5/15.0
- Rent growth +4.0/5.0
- Livability +3.1/5.0
- Condition / age +2.5/5.0
- Schools +1.2/10.0
- Appreciation +0.0/10.0
$200,000
🖨 Deal sheet 📄 Offer letter ✓ Due diligence
Listing remarks MLS
SBR
Key facts
- 0.52 acre lot
- 2 garage spots
- Built 1955
Neighborhood map
What this means for you Summary
Snapshot
- This is a 3-bed/1.0-bath single-family listed at $200k.
Deal economics
- At list price, monthly cash flow is $291 ($3k/yr) — positive.
- The deal already cash-flows at list — no discount required.
- Meets the 1% rule at list price ($2k rent vs $200k).
- Recommended offer: $197k (1.5% below list) — sets the bar for market timing.
- Cap rate 8.0% vs local median 6.1% in Rockford — top-decile yield for the area; either an underpriced asset or a hidden risk that comps aren't pricing in. Stress-test before assuming the spread holds.
Location & tenants
- Location reads 62/100 on livability (#876 in IL) — a middle-class / working-renter tenant base. Strengths: cost of living A+, housing A+, health & safety A+; Watch: crime F, amenities F, commute F.
- Rockford SD 205 (urban): math 12% / reading 16% proficiency, ranked #533 of 620 in IL (top 86%) — low school quality limits family demand, transient renter base, plan for 1-2y turnover; 73% free/reduced lunch — lower-income household profile, screen leases tightly.
- Zoned schools: Clifford P Carlson Elem School (math 12% / reading 12%, grade F, #1,403 of 2,056 statewide, top 71%, 347 students, 0% FRL); Eisenhower Middle School (math 9% / reading 17%, grade F, #540 of 665 statewide, top 82%, 961 students, 0% FRL); Guilford High School (math 15% / reading 28%, grade F, #345 of 693 statewide, top 50%, 2,071 students, 0% FRL) — zoned schools average 0% FRL vs 73% district-wide (73 pts lower); this property's tenant base skews higher-income than the district average.
- Market conditions: Rents rising fast (+5.9%/yr); 151 active listings in the ZIP; 5 comparable units currently listed for rent nearby; rentals leasing fast (median 13d on market — plan ~1-2 weeks tenant-placement turnaround); 40% of comp listings sitting > 30 days — soft ceiling on asking rent; solid renter incomes; 285 units permitted in Winnebago County in 2024 (0 in 5+ unit buildings).
- This rent runs 33% of the median local income ($79k/yr) — at the standard rent-burdened threshold; future hikes will face affordability resistance.
Forward outlook
- Local home prices are declining (-3.0%/yr); year-one equity from $1k of loan paydown is wiped out by about $6k of value loss. Plan a longer hold.
- Winnebago County population projected at -20% by 2050 — secular population decline; favor cash flow + early exit over multi-decade hold.
- At projected returns (-3.0% appreciation + 5.9% rent growth), your $56k cash investment doubles in ~10 years — after that, you're playing with house money.
Negotiation context
- It's been on market 25 days — a 2% lower offer ($197k) is reasonable based on typical stale-listing flexibility.
- 4 sale attempts since 12y ago with the ask held roughly flat each time — persistent listings suggest the price (not the market) is what's stuck; bring a comps-based counter.
- Current owner paid $115k; list at $200k implies a 74% gain — meaningful room to come down on a strong offer.
Risks & watch-outs
- Watch-outs: built in 1955 — expect roof / HVAC / electrical / plumbing capex.
Questions for the listing agent
- Built in 1955 — when were the roof, HVAC, electrical panel, plumbing, and water heater last replaced?
- Is there a deadline driving the sale (1031 exchange, divorce, estate, relocation)? That informs how much negotiation room exists.
- Schools are F-rated, which usually means shorter tenancies and higher turnover. Who's the typical renter profile here, and what's been the actual vacancy rate?
- Crime grade is F in this area — have there been break-ins, vandalism, or insurance claims at this property in the last 3 years? What carrier currently insures it and at what premium?
- The area grade is low — what's the realistic commute time and amenity access for the typical tenant pool here? Any planned neighborhood developments (good or bad) we should know about?
- What's the average days-on-market for RENTAL listings here right now (not sales)? A rising rental-DOM trend means longer vacancies and softer asking-rent achievability than the comps imply.
- What's the recent tenant-quality profile in this submarket — average credit score on applications, eviction rate, late-payment / NSF rate, and stable-employment percentage? A property-management company in the area should have these aggregated.
- How much new for-sale + rental construction is in the pipeline within 1–3 miles? Heavy new supply typically softens prices + rents 12–24 months out; constrained supply supports both.
Investment metrics
- 1% rule
- 1.09% ✓
- Cap rate
- 8.04%
- Cash-on-cash
- 6.25%
- DSCR
- 1.28
- GRM
- 7.7
CMA / ARV
- ARV (on-the-fly)
- $187,500
- Comps found
- 12
Show comp detail 12 sales within ~0.75 mi
| Address | Dist | Beds/Ba | Sqft | Sold | Price | $/sf | Match |
|---|---|---|---|---|---|---|---|
| 2104 Delcy Dr | 0.47mi | 3/1.5 | 1,456 (-3%) | 2mo | $180,000 | $124 | 70 |
| 2033 Edgebrook Dr | 0.21mi | 3/2.0 | 1,364 (-9%) | 9mo | $224,000 | $164 | 64 |
| 4000 Crestview Dr | 0.38mi | 4/2.0 (+1) | 1,474 (-2%) | 8mo | $196,000 | $133 | 63 |
| 3904 Barrington Rd | 0.60mi | 3/1.0 | 1,495 (-0%) | 11mo | $215,000 | $144 | 62 |
| 3504 Brendenwood Rd | 0.74mi | 3/1.5 | 1,500 (0%) | 3mo | $183,000 | $122 | 61 |
| 2107 Wisteria Rd | 0.44mi | 2/1.0 (-1) | 1,469 (-2%) | 12mo | $169,000 | $115 | 61 |
| 1915 Greenfield Ln | 0.17mi | 3/2.0 | 1,672 (+12%) | 11mo | $201,000 | $120 | 60 |
| 1419 Roncevalles Ave | 0.65mi | 3/1.0 | 1,406 (-6%) | 6mo | $176,000 | $125 | 54 |
| 1419 Stratford Ave | 0.70mi | 3/2.0 | 1,404 (-6%) | 5mo | $170,000 | $121 | 49 |
| 3610 Pinecrest Rd | 0.36mi | 3/2.0 | 1,288 (-14%) | 11mo | $180,000 | $140 | 47 |
| 4604 Mohawk Rd | 0.68mi | 3/2.0 | 1,350 (-10%) | 8mo | $202,500 | $150 | 41 |
| 3111 Highcrest Rd | 0.71mi | 3/2.0 | 1,653 (+10%) | 12mo | $201,500 | $122 | 36 |
Match score weights: distance 35% · size 25% · config 20% · recency 20%. Top-matched comps best support the ARV.
Projected returns pro-forma
-3.0% appreciation · 5.92% rent growth · sell at horizon
- IRR
- -3.3%
- Equity multiple
- 0.87×
- Total profit
- $-7,203
- Equity at exit
- $29,821
- IRR
- 9.5%
- Equity multiple
- 1.83×
- Total profit
- $46,549
- Equity at exit
- $17,292
Cash invested: $56,000 (down + closing). Projections, not guarantees.
Landlord ↔ Tenant lean methodology
- Overall (STATE)
- 43 Moderately Tenant-Leaning
- State Illinois
- 43 Moderately Tenant-Leaning · D+7
- County
- — inherits STATE
- City
- — inherits STATE
ZIP-level market 61107
- Home prices YoY
- -20.1%
- Rents YoY
- 5.9%
- Active inventory
- 151
- Price-to-rent
- 7.7×
Monthly cashflow live
- Estimated rent
- $2,176 high interval (Pro) →
- Mortgage (P&I)
- −$1,049
- Tax from tax record
- −$295 /mo · $3,546/yr
- Insurance
- −$83
- HOA
- −$0
- Vacancy / Maint / Mgmt
- −$457
- Net cashflow
- $291
Break-even live
UW: 25.0% down · 7.5% · 30yr · 1.5% tax · 5.0% vac · 8.0% maint · 8.0% mgmt
Financing live
Cash to close
- Down payment
- $50,000
- Closing costs
- $6,000
- Reserves months
- —
- Total cash needed
- —
Loan-product check · same deal, 3 products live
Conventional
25% down · 7.5% · 30yr
- Down + closing
- —
- Monthly P&I
- —
- Monthly cashflow
- —
- DSCR
- —
- Eligible?
- —
Personal DTI + credit; lowest rate.
DSCR
20% down · 8.5% · 30yr
- Down + closing
- —
- Monthly P&I
- —
- Monthly cashflow
- —
- DSCR
- —
- Eligible?
- —
No personal income docs; deal must DSCR.
Hard money
10% down · 12.0% · 12mo
- Down + closing
- —
- Monthly P&I
- —
- Monthly cashflow
- —
- DSCR
- —
- Eligible?
- —
Short-term bridge; refi at stabilization.
Rent comps 5 comps
| Address | Beds | Baths | Sqft | Rent | $/sqft | DOM | Units | Dist |
|---|---|---|---|---|---|---|---|---|
| 4016 Eaton Dr Unit 1232695P Rockford, IL | 3.0 | 3.0 | 1722 | $4,169 | $2.42 | 13d | 1 | 0.82mi |
| 3273 Kimball Rd Unit 1 Rockford, IL | 2.0 | 1.5 | 1100 | $1,600 | $1.45 | 43d | 1 | 1.23mi |
| 3273 Kimball Rd Rockford, IL | 2.0 | 1.0 | 1100 | $1,600 | $1.45 | 43d | 1 | 1.23mi |
| 4300 Eastridge Dr Unit 1 Rockford, IL | 3.0 | 2.0 | 1500 | $1,575 | $1.05 | 13d | 1 | 1.32mi |
| 4719 Illinois St Loves Park, IL | 3.0 | 1.0 | 1188 | $1,600 | $1.35 | 13d | 1 | 1.36mi |
Listing history 30 events
-
2026-06-19days on market $200,000 Active 25 DOM
-
2026-06-18days on market $200,000 Active 24 DOM
-
2026-06-17days on market $200,000 Active 23 DOM
-
2026-06-16days on market $200,000 Active 22 DOM
-
2026-06-15days on market $200,000 Active 21 DOM
-
2026-06-14days on market $200,000 Active 19 DOM
-
2026-06-13days on market $200,000 Active 18 DOM
-
2026-06-10days on market $200,000 Active 16 DOM
-
2026-06-09days on market $200,000 Active 15 DOM
-
2026-06-08days on market $200,000 Active 14 DOM
-
2026-06-07remarks 109-char remark
-
2026-06-07statusdays on market $200,000 Active 13 DOM
-
2026-04-11status Pending
-
2026-04-01$200,000 Active
-
2022-01-28soldstatus $114,834 3-char remark
Show marketing remark (3 chars)
SBR
-
2022-01-28$114,834 3-char remark
Show marketing remark (3 chars)
SBR
-
2019-01-10soldstatus $177,600
-
2015-03-20soldstatus $47,000 Closed Sale 301-char remark
Show marketing remark (301 chars)
1503 Sq Ft Ranch home with 3 bedrooms and 1 bath on half acre of land. Has an attached 2 car garage. Family room with wood burning brick fireplace. Separate dining and living room. Spacious Kitchen. 1st floor laundry. Fenced back yard with built in seating on deck. Located close to Marsh School Park.
-
2015-03-20soldstatus $47,000
Show marketing remark (301 chars)
1503 Sq Ft Ranch home with 3 bedrooms and 1 bath on half acre of land. Has an attached 2 car garage. Family room with wood burning brick fireplace. Separate dining and living room. Spacious Kitchen. 1st floor laundry. Fenced back yard with built in seating on deck. Located close to Marsh School Park.
-
2015-03-09status Pending 301-char remark
Show marketing remark (301 chars)
1503 Sq Ft Ranch home with 3 bedrooms and 1 bath on half acre of land. Has an attached 2 car garage. Family room with wood burning brick fireplace. Separate dining and living room. Spacious Kitchen. 1st floor laundry. Fenced back yard with built in seating on deck. Located close to Marsh School Park.
-
2015-01-13historical 301-char remark
Show marketing remark (301 chars)
1503 Sq Ft Ranch home with 3 bedrooms and 1 bath on half acre of land. Has an attached 2 car garage. Family room with wood burning brick fireplace. Separate dining and living room. Spacious Kitchen. 1st floor laundry. Fenced back yard with built in seating on deck. Located close to Marsh School Park.
-
2014-12-30price $69,900 301-char remark
Show marketing remark (301 chars)
1503 Sq Ft Ranch home with 3 bedrooms and 1 bath on half acre of land. Has an attached 2 car garage. Family room with wood burning brick fireplace. Separate dining and living room. Spacious Kitchen. 1st floor laundry. Fenced back yard with built in seating on deck. Located close to Marsh School Park.
-
2014-12-09price $79,900 301-char remark
Show marketing remark (301 chars)
1503 Sq Ft Ranch home with 3 bedrooms and 1 bath on half acre of land. Has an attached 2 car garage. Family room with wood burning brick fireplace. Separate dining and living room. Spacious Kitchen. 1st floor laundry. Fenced back yard with built in seating on deck. Located close to Marsh School Park.
-
2014-10-31price $85,000 301-char remark
Show marketing remark (301 chars)
1503 Sq Ft Ranch home with 3 bedrooms and 1 bath on half acre of land. Has an attached 2 car garage. Family room with wood burning brick fireplace. Separate dining and living room. Spacious Kitchen. 1st floor laundry. Fenced back yard with built in seating on deck. Located close to Marsh School Park.
-
2014-10-01price $92,500 301-char remark
Show marketing remark (301 chars)
1503 Sq Ft Ranch home with 3 bedrooms and 1 bath on half acre of land. Has an attached 2 car garage. Family room with wood burning brick fireplace. Separate dining and living room. Spacious Kitchen. 1st floor laundry. Fenced back yard with built in seating on deck. Located close to Marsh School Park.
-
2014-08-26$100,000 New 301-char remark
Show marketing remark (301 chars)
1503 Sq Ft Ranch home with 3 bedrooms and 1 bath on half acre of land. Has an attached 2 car garage. Family room with wood burning brick fireplace. Separate dining and living room. Spacious Kitchen. 1st floor laundry. Fenced back yard with built in seating on deck. Located close to Marsh School Park.
-
2014-08-26$69,900
Show marketing remark (301 chars)
1503 Sq Ft Ranch home with 3 bedrooms and 1 bath on half acre of land. Has an attached 2 car garage. Family room with wood burning brick fireplace. Separate dining and living room. Spacious Kitchen. 1st floor laundry. Fenced back yard with built in seating on deck. Located close to Marsh School Park.
-
2002-01-02soldstatus $90,000
-
1995-03-10soldstatus $84,000
-
1995-03-10soldstatus $84,000
ⓘ Source: listings_history table (triggers on properties + properties_extension) + one-shot
backfill from property_details.listing_events for pre-trigger history.
Tax reassessment forecast IL · Partial reset (capped growth)
- Current annual tax
- $3,546 · $295/mo
- Projected year-2 tax
- $4,043 · $337/mo
- Expected delta
- +$497/yr (+$41/mo · 14.0%)
ⓘ Screening estimate from a state-policy table — verify with the county assessor before closing.
Climate risk First Street
- Flood 1/10 Low FEMA zone X (unshaded) · 0% chance over 30 yrs
- Wildfire 1/10 Low
- Heat 2/10 Low 7 d/yr ≥101°F today · 14 d/yr by 30 yrs out
- Wind 2/10 Low
- Air quality 3/10 Moderate 2 unhealthy d/yr today · 3 by 30 yrs out
Nearby sold comps map
Loading sold comps map…
Walkable amenities ~0.75 mi
Loading nearby amenities…
Taxation est. · year 1
- Rental income
- $26,113
- − Mortgage interest
- −$11,203
- − Property taxes
- −$3,546
- − Insurance
- −$1,000
- − Repairs & maintenance
- −$2,089
- − Management
- −$2,089
- − Depreciation
- −$5,818
- Taxable income
- $368
- Est. tax owed @ 24.0%
- −$88
- After-tax cash flow
- $3,409/yr
For passive investors: Depreciation is non-cash, so a rental often shows a tax loss while cash-flowing — sheltering income. Rental losses are passive: they offset passive income freely, and up to $25,000/yr can offset ordinary (W-2) income if you actively participate and your MAGI is under $100k (phasing out to $0 by $150k); unused losses carry forward. On sale, claimed depreciation is recaptured at up to 25%, and gains may owe capital-gains tax (a 1031 exchange can defer both). Figures are a year-1 estimate at your 24.0% rate — not tax advice; consult a CPA.
Schools (NCES district)
- District
- Rockford SD 205
- NCES district ID
- 1734510
- Math proficiency
- 12% ▼ -2.00%
- Reading proficiency
- 16% ▼ -3.00%
- Median HH income
- $42,533
- Composite
- 12.21/100
- National rank
- #9649
- State rank
- #533 of 620 in IL
Livability — Rockford
- Score
- 62/100
- State rank
- #876
- US rank
- #17035
Category grades
Schools grade is shown separately in the Schools card above.
Census & demographics
- County
- Winnebago County · 147,297 people
- City population
- 147,297
- Metro
- Rockford, IL
- Population (ZIP)
- 30,765
- Household income
- $78,574
- Rent vs Own
- Severe rent burden
- 981.0
Population outlook (Winnebago County) Hauer SSP2
- Today (2025)
- 271,080 people
- By 2030
- 260,684 · -3.8%
- By 2040
- 238,405 · -12.1%
- By 2050
- 216,129 · -20.3%
- By 2075
- 172,882 · -36.2%
- By 2100
- 135,336 · -50.1%
Race, ethnicity, and origin ACS 2023
- Neighborhood character
- Predominantly White (68%)
- Race & ethnicity
- White 68% Hispanic / Latino 15% Black 9% Two or more races 9% Asian 4% Native American 1%
- Hispanic origin (detail)
- Mexican 11% Puerto Rican 1%
- Common ancestry
- Romanian 6% Portuguese 4% Lithuanian 2%
- Foreign-born
- 10% · Canada, China
- Languages at home
- 83% English-only · Spanish 11% Arabic 1% Other Indo-European 1%
Political lean MEDSL · Winnebago
- 2024 margin
- Toss-up / Even · D 49.5% · R 49.0% · Other 1.5%
- 2008→2024 swing
- -12.2pp toward R · 2008: 12.8pp · 2024: 0.6pp
- All cycles
- 2024: D+0.6 2020: D+2.5 2016: R+1.2 2012: D+5.7 2008: D+12.8
Not yet ingested
- Civics
- —
Market trends
- HPI YoY
- ▼ -62.46%
- Current HPI
- 248.8598
- Rent YoY
- ▲ 5.92%
- Metro
- Rockford, IL
- State GDP YoY
- ▲ 1.59%
- F500 in state
- 60
Industry mix (Fortune 500 HQ in IL)
| Industry | F500 HQs | Revenue |
|---|---|---|
| Insurance | 4 | $201B |
|
||
| Consumer Goods | 4 | $87B |
|
||
| Industrial Machinery | 3 | $64B |
|
||
| Healthcare | 2 | $55B |
|
||
| Retail / Pharmacy | 1 | $148B |
|
||
| Agriculture / Food | 1 | $86B |
|
||
Price history
+138.1% since first listed18 events — show timeline
- 2026-04-11 Pending — NWIAR
- 2026-04-01 Listed $200,000 NWIAR
- 2022-01-28 Listed $114,834 NWIAR
- 2022-01-28 Sold (MLS) $114,834 NWIAR
- 2019-01-10 Sold (Public Records) $177,600 Public Records
- 2015-03-20 Sold (MLS) $47,000 MRED as Distributed by MLS Grid
- 2015-03-20 Sold (MLS) $47,000 NWIAR
- 2015-03-09 Pending — MRED as Distributed by MLS Grid
- 2015-01-13 Listing Removed — MRED as Distributed by MLS Grid
- 2014-12-30 Price Changed $69,900 MRED as Distributed by MLS Grid
- 2014-12-09 Price Changed $79,900 MRED as Distributed by MLS Grid
- 2014-10-31 Price Changed $85,000 MRED as Distributed by MLS Grid
- 2014-10-01 Price Changed $92,500 MRED as Distributed by MLS Grid
- 2014-08-26 Listed $100,000 MRED as Distributed by MLS Grid
- 2014-08-26 Listed $69,900 NWIAR
- 2002-01-02 Sold (Public Records) $90,000 Public Records
- 1995-03-10 Sold (Public Records) $84,000 Public Records
- 1995-03-10 Sold (Public Records) $84,000 Public Records
Property tax history
+2.3%/yrLatest (2024): $3,546 · +6.9% YoY. Source: county tax records.
Cash-flow waterfall
monthlySold comps — $/sqft
last 12 mo · ≤1 miLoading sold comps…