15368 Coyote Dr · Urbandale, IA
Flood risk No data
- FEMA flood zone
- —
- Chance of flooding over 30 yrs
- —
- Est. flood insurance / yr
- —
Fire risk No data
- Est. fire insurance / yr
- —
Heat risk No data
- Hot days now (above threshold)
- —
- Hot days in 30 yrs
- —
Wind risk No data
- Chance of severe wind over 30 yrs
- —
Air-quality risk No data
- Unhealthy air days now
- —
- Unhealthy air days in 30 yrs
- —
Risk factors via First Street. Map © Google.
Why this score? — see what drove the D- grade
The composite is a weighted blend of 9 inputs, each scored 0–100. Each bar is that input's sub-score; the figure is the points it added to the 100-point composite (weight × sub-score).
- Cash flow +9.1/30.0
- ARV discount +7.5/15.0
- Schools +7.1/10.0
- Livability +4.5/5.0
- 1% rule +3.9/10.0
- Rent growth +2.7/5.0
- DSCR +2.5/10.0
- Condition / age +2.5/5.0
- Appreciation +0.0/10.0
$227,590
🖨 Deal sheet (PDF) 📄 Offer letter ✓ Due diligence
Listing remarks
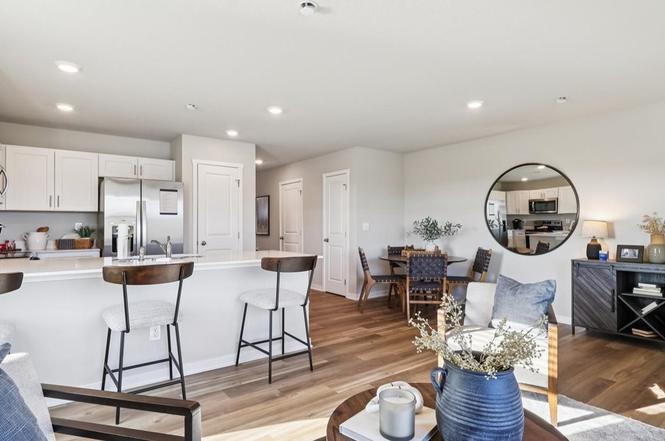
Welcome to the Pearson, a townhome in Magnolia Heights Townhomes - offering 3 bedrooms, 2.5 bathrooms, and 1,418 sq. ft. of thoughtfully designed living space with appliances included. Step into a welcoming foyer that leads into an open-concept main level, perfect for daily living and entertaining. The kitchen features white cabinetry, stainless steel appliances, and a large L-shaped island, ideal for casual dining and gatherings. The kitchen flows into the dining area and great room, where an electric fireplace adds a cozy touch. A half bathroom and access to the 1-car garage complete the main level. Upstairs, retreat to the spacious primary suite with a walk-in closet and private bath wit
Key facts
- Dual vanity sink
- Dedicated pantry
- Cozy fireplace
Tags
Property features AI
Finance
- HOA & community: Homeowners association (Magnolia HOA) with management by Edge Property Management; HOA fee $195 monthly
Exterior
- Parking: Attached 1-car garage
- Utilities: Public water; Public sewer
- Home design: 2-story home; New construction; Built by DR HORTON
- Construction: Vinyl siding; Asphalt shingle roof; Poured slab foundation
- Exterior features: Open patio; Concrete road access
Interior
- Kitchen: Dishwasher; Microwave; Stove; Refrigerator
- Bathrooms: 1 full bathroom; 1 three-quarter bathroom; 1 half bathroom
- Heating & cooling: Central air conditioning; Electric heating; Forced air; Gas heating
- Interior features: Dining area; Eat-in kitchen; Electric fireplace
- Laundry & utility: Washer; Dryer
Neighborhood map
What this means for you Summary
Snapshot
- This is a 3-bed/2.5-bath other listed at $228k.
Deal economics
- At list price, monthly cash flow is $-175 ($-2k/yr) — negative.
- To cash-flow at today's rent, offer at most $202k (11.1% below list).
- To meet the 1% rule (rent ≥ 1% of price), the offer needs to be $202k (11.4% below list).
- Recommended offer: $200k (12.0% below list) — sets the bar for market timing.
- Cap rate 5.4% vs local median 2.4% in Urbandale — top-decile yield for the area; either an underpriced asset or a hidden risk that comps aren't pricing in. Stress-test before assuming the spread holds.
Location & tenants
- Location reads 90/100 on livability (#4 in IA, #69 nationally) — a professional / high-income tenant draw. Strengths: crime A+, amenities A+, employment A+; Watch: commute F.
- Waukee Community School District (suburban): math 80% / reading 79% proficiency, ranked #14 of 289 in IA (top 5%) — strong family-tenant draw, lease renewals of 3-5y typical; only 11% free/reduced lunch — higher-income household profile.
- Zoned schools: Walnut Hills Elementary School (math 91% / reading 81%, grade A+, #26 of 616 statewide, top 4%, 625 students, 9% FRL); Waukee Middle School (math 83% / reading 81%, grade A+, #22 of 246 statewide, top 12%, 1,069 students, 12% FRL); Waukee High School (math 74% / reading 82%, grade A-, #53 of 336 statewide, top 16%, 1,268 students, 24% FRL) — zoned schools at 15% FRL track the district average.
- Market conditions: Rents flat; 329 active listings in the ZIP; 9 comparable units currently listed for rent nearby; rentals lingering (median 46d on market — plan ~5-8 weeks vacancy on turnover, expect pricing pressure); 56% of comp listings sitting > 30 days — soft ceiling on asking rent; high-income renter base; 1,503 units permitted in Dallas County in 2024 (630 in 5+ unit buildings).
Forward outlook
- Local home prices are declining (-3.0%/yr); year-one equity from $2k of loan paydown is wiped out by about $7k of value loss. Plan a longer hold.
- Dallas County population projected at +74% by 2050 — long-run rental-demand tailwind backs the buy-and-hold thesis.
Negotiation context
- It's been on market 314 days — a 12% lower offer ($200k) is reasonable based on typical stale-listing flexibility.
Questions for the listing agent
- What do current leases actually rent for vs. the listed asking? Can we see a recent rent roll and the last 12 months of T-12 income?
- It's been on market 314 days. Have you received any prior offers? Is the seller open to a 12% concession, seller financing, or rate buy-down credit?
- What does the HOA fee cover, when was the last increase, and are there any pending special assessments or reserve-fund shortfalls?
- Why hasn't it sold? Are there any deal-killer items the seller is aware of (foundation, flood, title, zoning, code violations)?
- Is there a deadline driving the sale (1031 exchange, divorce, estate, relocation)? That informs how much negotiation room exists.
- Schools are A-rated — typically a magnet for longer-tenancy family renters. What's the average tenant stay here, and is there a school-zone premium baked into asking?
- The area grade is low — what's the realistic commute time and amenity access for the typical tenant pool here? Any planned neighborhood developments (good or bad) we should know about?
- What's the average days-on-market for RENTAL listings here right now (not sales)? A rising rental-DOM trend means longer vacancies and softer asking-rent achievability than the comps imply.
- What's the recent tenant-quality profile in this submarket — average credit score on applications, eviction rate, late-payment / NSF rate, and stable-employment percentage? A property-management company in the area should have these aggregated.
- How much new for-sale + rental construction is in the pipeline within 1–3 miles? Heavy new supply typically softens prices + rents 12–24 months out; constrained supply supports both.
Investment metrics
- 1% rule
- 0.89% ✗
- Cap rate
- 5.37%
- Cash-on-cash
- -3.29%
- DSCR
- 0.85
- GRM
- 9.4
CMA / ARV
No comps found within radius.
Projected returns pro-forma
-3.0% appreciation · 0.71% rent growth · sell at horizon
- IRR
- -24.7%
- Equity multiple
- 0.18×
- Total profit
- $-52,412
- Equity at exit
- $33,934
- IRR
- -30.2%
- Equity multiple
- -0.21×
- Total profit
- $-77,176
- Equity at exit
- $19,678
Cash invested: $63,725 (down + closing). Projections, not guarantees.
Landlord ↔ Tenant lean methodology
- Overall (STATE)
- 83 Strongly Landlord-Friendly
- State Iowa
- 83 Strongly Landlord-Friendly · R+6
- County
- — inherits STATE
- City
- — inherits STATE
ZIP-level market 50111
- Home prices YoY
- -11.1%
- Rents YoY
- 0.7%
- Active inventory
- 329
- Price-to-rent
- 9.4×
Monthly cashflow live
- Estimated rent
- $2,016 high interval (Pro) →
- Mortgage (P&I)
- −$1,194
- Tax est. 1.5%
- −$284 /mo · $3,414/yr
- Insurance
- −$95
- HOA
- −$195
- Vacancy / Maint / Mgmt
- −$423
- Net cashflow
- $-175
Break-even live
Sensitivity live
| Price | -10% $-18 | -5% $-96 | +0% $-175 | +5% $-254 | +10% $-332 |
|---|---|---|---|---|---|
| Rent | -10% $-334 | -5% $-255 | +0% $-175 | +5% $-95 | +10% $-16 |
| Rate | -1.0pp $-60 | -0.5pp $-117 | base $-175 | +0.5pp $-234 | +1.0pp $-294 |
UW: 25.0% down · 7.5% · 30yr · 1.5% tax · 5.0% vac · 8.0% maint · 8.0% mgmt
Financing live
Cash to close
- Down payment
- $56,898
- Closing costs
- $6,828
- Reserves months
- —
- Total cash needed
- —
Loan-product check · same deal, 3 products live
Conventional
25% down · 7.5% · 30yr
- Down + closing
- —
- Monthly P&I
- —
- Monthly cashflow
- —
- DSCR
- —
- Eligible?
- —
Personal DTI + credit; lowest rate.
DSCR
20% down · 8.5% · 30yr
- Down + closing
- —
- Monthly P&I
- —
- Monthly cashflow
- —
- DSCR
- —
- Eligible?
- —
No personal income docs; deal must DSCR.
Hard money
10% down · 12.0% · 12mo
- Down + closing
- —
- Monthly P&I
- —
- Monthly cashflow
- —
- DSCR
- —
- Eligible?
- —
Short-term bridge; refi at stabilization.
Rent comps 9 comps
| Address | Beds | Baths | Sqft | Rent | $/sqft | DOM | Units | Dist |
|---|---|---|---|---|---|---|---|---|
| 15133 Foxglove Ln Urbandale, IA | 3.0 | 2.5 | 1529 | $2,350 | $1.54 | 16d | 1 | 0.39mi |
| 5437 155th St Urbandale, IA | 3.0–4.0 | 2.5 | 1590 | $1,969 | $1.24 | 16d | 8 | 0.43mi |
| 15118 Deerview Dr Urbandale, IA | 3.0 | 2.5 | 1600 | $2,195 | $1.37 | 45d | 1 | 0.56mi |
| 5506 144th St Urbandale, IA | 3.0 | 2.5 | 1575 | $1,875 | $1.19 | 45d | 1 | 0.61mi |
| 14420 Springbrook Trl Grimes, IA | 3.0 | 2.5 | 1575 | $1,950 | $1.24 | 16d | 1 | 0.96mi |
| 4735 NW 167th St Waukee, IA | 3.0 | 3.0 | 1557 | $2,300 | $1.48 | 45d | 1 | 1.45mi |
| 16605 Oakwood Dr Urbandale, IA | 3.0 | 2.5 | 1572 | $2,350 | $1.49 | 45d | 1 | 1.46mi |
| 4736 167th St Urbandale, IA | 3.0 | 2.5 | 1585 | $2,296 | $1.45 | 16d | 1 | 1.46mi |
| 15221 Alpine Dr Urbandale, IA | 2.0 | 2.0 | 1056 | $1,550 | $1.47 | 45d | 1 | 1.49mi |
HOA detail
- Monthly dues
- $195 · $2,340/yr
- Likely covers
- electric
Listing history 12 events
-
2026-04-20status Pending
-
2026-04-20price $227,590
-
2026-04-09price $226,990
-
2026-03-06price $229,990
-
2026-02-24price $227,990
-
2026-02-12price $224,990
-
2026-02-02price $227,990
-
2025-12-30price $224,990
-
2025-11-25price $229,990
-
2025-11-06price $232,990
-
2025-09-17price $234,990
-
2025-06-10$239,990 Active
ⓘ Source: listings_history table (triggers on properties + properties_extension) + one-shot
backfill from property_details.listing_events for pre-trigger history.
Nearby sold comps map
Loading sold comps map…
Walkable amenities ~0.75 mi
Loading nearby amenities…
Taxation est. · year 1
- Rental income
- $24,196
- − Mortgage interest
- −$12,749
- − Property taxes
- −$3,414
- − Insurance
- −$1,138
- − Repairs & maintenance
- −$1,936
- − Management
- −$1,936
- − HOA
- −$2,340
- − Depreciation
- −$6,621
- Taxable loss
- −$5,936
- Est. tax savings @ 24.0%
- +$1,425
- After-tax cash flow
- $-674/yr
For passive investors: Depreciation is non-cash, so a rental often shows a tax loss while cash-flowing — sheltering income. Rental losses are passive: they offset passive income freely, and up to $25,000/yr can offset ordinary (W-2) income if you actively participate and your MAGI is under $100k (phasing out to $0 by $150k); unused losses carry forward. On sale, claimed depreciation is recaptured at up to 25%, and gains may owe capital-gains tax (a 1031 exchange can defer both). Figures are a year-1 estimate at your 24.0% rate — not tax advice; consult a CPA.
Schools (NCES district)
- District
- Waukee Community School District
- NCES district ID
- 1930510
- Math proficiency
- 80% ▼ -6.00%
- Reading proficiency
- 79% ▼ -5.00%
- Median HH income
- $88,580
- Composite
- 70.94/100
- National rank
- #245
- State rank
- #14 of 289 in IA
Livability — Urbandale
- Score
- 90/100
- State rank
- #4
- US rank
- #69
Category grades
Schools grade is shown separately in the Schools card above.
Census & demographics
- Census place
- Urbandale, IA
- County
- Polk County · 453,298 people
- City population
- 49,196
- Metro
- Des Moines-West Des Moines, IA
- Population (ZIP)
- 16,865
- Household income
- $120,769
- Rent vs Own
- Severe rent burden
- 249.0
Population outlook (Dallas County) Hauer SSP2
- Today (2025)
- 111,904 people
- By 2030
- 127,807 · +14.2%
- By 2040
- 160,576 · +43.5%
- By 2050
- 194,154 · +73.5%
- By 2075
- 271,895 · +143.0%
- By 2100
- 326,525 · +191.8%
Race, ethnicity, and origin ACS 2023
- Neighborhood character
- Predominantly White (85%)
- Race & ethnicity
- White 85% Hispanic / Latino 6% Two or more races 5% Asian 3% Black 2%
- Hispanic origin (detail)
- Mexican 4%
- Common ancestry
- Portuguese 3% Italian 3% Iranian 2%
- Foreign-born
- 6% · China, Canada
- Languages at home
- 92% English-only · Other Asian/Pacific 3% Spanish 2% Other Indo-European 1%
Political lean MEDSL · Dallas
- 2024 margin
- Toss-up / Even · D 46.9% · R 51.7% · Other 1.4%
- 2008→2024 swing
- +0.8pp no change · 2008: -5.5pp · 2024: -4.8pp
- All cycles
- 2024: R+4.8 2020: R+2.0 2016: R+9.6 2012: R+11.8 2008: R+5.5
Not yet ingested
- Civics
- —
Market trends
- HPI YoY
- ▼ -30.93%
- Current HPI
- 249.0614
- Rent YoY
- ▲ 0.71%
- Metro
- Des Moines-West Des Moines, IA
- State GDP YoY
- ▲ 2.48%
- F500 in state
- 4
Industry mix (Fortune 500 HQ in IA)
| Industry | F500 HQs | Revenue |
|---|---|---|
| Financial Services | 1 | $16B |
|
||
| Retail / Convenience | 1 | $15B |
|
||
Price history
-5.2% since first listed12 events — show timeline
- 2026-04-20 Pending — DMMLS
- 2026-04-20 Price Changed $227,590 DMMLS
- 2026-04-09 Price Changed $226,990 DMMLS
- 2026-03-06 Price Changed $229,990 DMMLS
- 2026-02-24 Price Changed $227,990 DMMLS
- 2026-02-12 Price Changed $224,990 DMMLS
- 2026-02-02 Price Changed $227,990 DMMLS
- 2025-12-30 Price Changed $224,990 DMMLS
- 2025-11-25 Price Changed $229,990 DMMLS
- 2025-11-06 Price Changed $232,990 DMMLS
- 2025-09-17 Price Changed $234,990 DMMLS
- 2025-06-10 Listed $239,990 DMMLS
Cash-flow waterfall
monthlySold comps — $/sqft
last 12 mo · ≤1 miLoading sold comps…