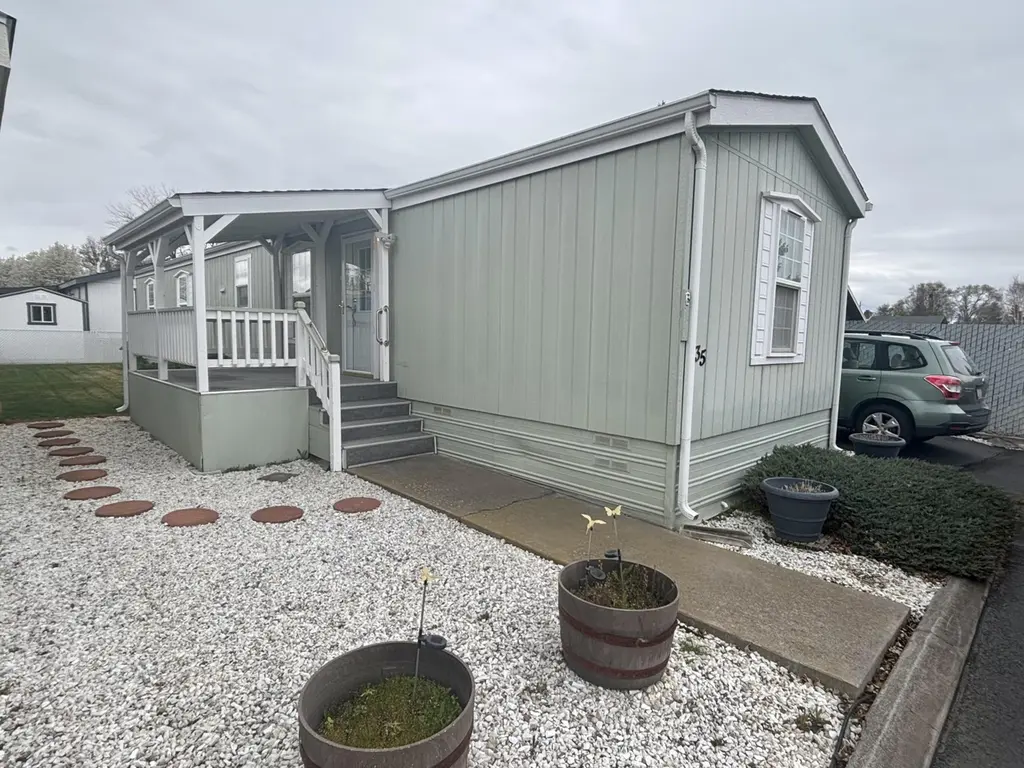
4200 Summers Ln Unit 35 · Altamont, OR
Flood risk 3/10 · Minor
- FEMA flood zone
- X
- Chance of flooding over 30 yrs
- 0.1%
- Est. flood insurance / yr
- $507 – $1,088
Fire risk 5/10 · Moderate
- Est. fire insurance / yr
- $498 – $926
Heat risk 3/10 · Minor
- Hot days now (above 90°F)
- 7 days/yr
- Hot days in 30 yrs
- 17 days/yr
Wind risk 1/10 · Minimal
- Chance of severe wind over 30 yrs
- —
Air-quality risk 10/10 · Severe
- Unhealthy air days now
- 38 days/yr
- Unhealthy air days in 30 yrs
- 39 days/yr
Risk factors via First Street. Map © Google.
Why this score? — see what drove the B grade
The composite is a weighted blend of 9 inputs, each scored 0–100. Each bar is that input's sub-score; the figure is the points it added to the 100-point composite (weight × sub-score).
- Cash flow +26.7/30.0
- ARV discount +14.4/15.0
- 1% rule +10.0/10.0
- DSCR +9.2/10.0
- Rent growth +3.5/5.0
- Livability +3.2/5.0
- Schools +2.5/10.0
- Condition / age +2.5/5.0
- Appreciation +0.0/10.0
$65,000
🖨 Deal sheet 📄 Offer letter ✓ Due diligence
Listing remarks
This charming manufactured home features 2 bedrooms and 2 bathrooms, located in the desirable Alpine Meadows 55+ community. The home offers a spacious primary bedroom and ceiling fan in living room for added comfort. Enjoy a fenced yard, attached carport, and additional storage space. The property is nicely landscaped, creating a welcoming outdoor setting and sprinklers in front and back. The kitchen comes fully equipped with all appliances, including a washer and dryer for added convenience. Centrally located in Klamath Falls, this home provides easy access to shopping, dining, medical facilities, and more. Community amenities include a clubhouse and RV parking for short-term guests.
Key facts
- Attached carport
- Clubhouse
- Rv parking
Tags
Neighborhood map
What this means for you Summary
Snapshot
- This is a 2-bed/2.0-bath manufactured listed at $65k.
Deal economics
- At list price, monthly cash flow is $177 ($2k/yr) — positive.
- The deal already cash-flows at list — no discount required.
- Meets the 1% rule at list price ($1k rent vs $65k).
- Recommended offer: $64k (1.5% below list) — sets the bar for market timing.
- Cap rate 9.6% vs local median 3.7% in Altamont — top-decile yield for the area; either an underpriced asset or a hidden risk that comps aren't pricing in. Stress-test before assuming the spread holds.
Location & tenants
- Location reads 65/100 on livability (#195 in OR) — a middle-class / working-renter tenant base. Strengths: cost of living A+, housing A+; Watch: health & safety C-, employment D, crime F.
- Klamath County SD (rural): math 21% / reading 37% proficiency, ranked #46 of 58 in OR (top 79%) — low school quality limits family demand, transient renter base, plan for 1-2y turnover.
- Zoned schools: Peterson Elementary School (math 37% / reading 32%, grade F, #218 of 412 statewide, top 58%, 606 students, 74% FRL); Mazama High School (math 12% / reading 42%, grade F, #115 of 143 statewide, top 82%, 690 students, 72% FRL).
- Market conditions: Rents rising (+3.8%/yr); 263 active listings in the ZIP; 9 comparable units currently listed for rent nearby; rentals lingering (median 44d on market — plan ~5-8 weeks vacancy on turnover, expect pricing pressure); 100% of comp listings sitting > 30 days — soft ceiling on asking rent; 232 units permitted in Klamath County in 2024 (72 in 5+ unit buildings).
Forward outlook
- Local home prices are declining (-3.0%/yr); year-one equity from $449 of loan paydown is wiped out by about $2k of value loss. Plan a longer hold.
- Klamath County population projected at -12% by 2050 — secular population decline; favor cash flow + early exit over multi-decade hold.
- At projected returns (-3.0% appreciation + 3.8% rent growth), your $18k cash investment doubles in ~9 years — after that, you're playing with house money.
Negotiation context
- It's been on market 18 days — a 2% lower offer ($64k) is reasonable based on typical stale-listing flexibility.
Risks & watch-outs
- Watch-outs: HOA is 35% of rent.
- Climate carrying-cost: moderate wildfire risk — expect insurance premiums to compound above CPI over the hold.
Questions for the listing agent
- What does the HOA fee cover, when was the last increase, and are there any pending special assessments or reserve-fund shortfalls?
- Is there a deadline driving the sale (1031 exchange, divorce, estate, relocation)? That informs how much negotiation room exists.
- Crime grade is F in this area — have there been break-ins, vandalism, or insurance claims at this property in the last 3 years? What carrier currently insures it and at what premium?
- What's the average days-on-market for RENTAL listings here right now (not sales)? A rising rental-DOM trend means longer vacancies and softer asking-rent achievability than the comps imply.
- What's the recent tenant-quality profile in this submarket — average credit score on applications, eviction rate, late-payment / NSF rate, and stable-employment percentage? A property-management company in the area should have these aggregated.
- How much new for-sale + rental construction is in the pipeline within 1–3 miles? Heavy new supply typically softens prices + rents 12–24 months out; constrained supply supports both.
Investment metrics
- 1% rule
- 2.00% ✓
- Cap rate
- 9.56%
- Cash-on-cash
- 11.66%
- DSCR
- 1.52
- GRM
- 4.2
CMA / ARV
- ARV (on-the-fly)
- $76,692
- Comps found
- 9
Show comp detail 9 sales within ~0.75 mi
| Address | Dist | Beds/Ba | Sqft | Sold | Price | $/sf | Match |
|---|---|---|---|---|---|---|---|
| 4200 Summers Ln Unit 35 | 0.00mi | 2/2.0 | 924 (0%) | 1mo | $65,000 | $70 | 99 |
| 3646 Summers Ln #3 | 0.39mi | 2/1.0 | 924 (0%) | 11mo | $77,000 | $83 | 68 |
| 3500 Summers Ln #3 | 0.50mi | 2/1.0 | 900 (-3%) | 7mo | $32,500 | $36 | 63 |
| 4647 Winter Ave #50 | 0.61mi | 3/2.0 (+1) | 900 (-3%) | 4mo | $96,500 | $107 | 59 |
| 3113 Bristol Ave #28 | 0.59mi | 2/2.0 | 924 (0%) | 21mo | $35,000 | $38 | 55 |
| 4647 Winter Ave Spc 82 | 0.63mi | 3/2.0 (+1) | 900 (-3%) | 15mo | $98,000 | $109 | 49 |
| 3415 Crest St #11 | 0.53mi | 2/1.0 | 840 (-9%) | 13mo | $59,250 | $71 | 45 |
| 4647 Winter Ave Spc 88 | 0.63mi | 3/2.0 (+1) | 900 (-3%) | 19mo | $104,900 | $117 | 45 |
| 4647 Winter Ave Spc 15 | 0.63mi | 3/2.0 (+1) | 900 (-3%) | 21mo | $102,900 | $114 | 44 |
Match score weights: distance 35% · size 25% · config 20% · recency 20%. Top-matched comps best support the ARV.
Projected returns pro-forma
-3.0% appreciation · 3.8% rent growth · sell at horizon
- IRR
- 2.9%
- Equity multiple
- 1.11×
- Total profit
- $2,054
- Equity at exit
- $9,692
- IRR
- 13.9%
- Equity multiple
- 2.20×
- Total profit
- $21,776
- Equity at exit
- $5,620
Cash invested: $18,200 (down + closing). Projections, not guarantees.
Landlord ↔ Tenant lean methodology
- Overall (STATE)
- 28 Tenant-Leaning
- State Oregon
- 28 Tenant-Leaning · D+6
- County
- — inherits STATE
- City
- — inherits STATE
ZIP-level market 97603
- Rents YoY
- 3.8%
- Active inventory
- 263
- Price-to-rent
- 4.2×
Monthly cashflow live
- Estimated rent
- $1,300 high interval (Pro) →
- Mortgage (P&I)
- −$341
- Tax from tax record
- −$31 /mo · $376/yr
- Insurance
- −$27
- HOA
- −$451
- Vacancy / Maint / Mgmt
- −$273
- Net cashflow
- $177
Break-even live
UW: 25.0% down · 7.5% · 30yr · 1.5% tax · 5.0% vac · 8.0% maint · 8.0% mgmt
Financing live
Cash to close
- Down payment
- $16,250
- Closing costs
- $1,950
- Reserves months
- —
- Total cash needed
- —
Loan-product check · same deal, 3 products live
Conventional
25% down · 7.5% · 30yr
- Down + closing
- —
- Monthly P&I
- —
- Monthly cashflow
- —
- DSCR
- —
- Eligible?
- —
Personal DTI + credit; lowest rate.
DSCR
20% down · 8.5% · 30yr
- Down + closing
- —
- Monthly P&I
- —
- Monthly cashflow
- —
- DSCR
- —
- Eligible?
- —
No personal income docs; deal must DSCR.
Hard money
10% down · 12.0% · 12mo
- Down + closing
- —
- Monthly P&I
- —
- Monthly cashflow
- —
- DSCR
- —
- Eligible?
- —
Short-term bridge; refi at stabilization.
Rent comps 9 comps
| Address | Beds | Baths | Sqft | Rent | $/sqft | DOM | Units | Dist |
|---|---|---|---|---|---|---|---|---|
| 4831 Darwin Pl Klamath Falls, OR | 3.0 | 1.0 | 1092 | $1,475 | $1.35 | 43d | 1 | 0.33mi |
| 4195 Bristol Ct Klamath Falls, OR | 2.0 | 1.0 | 1080 | $1,350 | $1.25 | 43d | 1 | 0.47mi |
| 3039 Kane St Klamath Falls, OR | 3.0 | 2.0 | 988 | $1,395 | $1.41 | 43d | 1 | 1.14mi |
| 4500 Cannon Ave Unit 87 Klamath Falls, OR | 1.0 | 1.0 | 550 | $925 | $1.68 | 43d | 1 | 1.25mi |
| 4507 Cannon Ave Apt 52 Klamath Falls, OR | 2.0 | 1.0 | 850 | $1,000 | $1.18 | 43d | 1 | 1.28mi |
| 4507 Cannon Ave Unit 42 Klamath Falls, OR | 1.0 | 1.0 | 550 | $925 | $1.68 | 43d | 1 | 1.28mi |
| 4519 Cannon Ave Unit 22 Klamath Falls, OR | 2.0 | 1.0 | 850 | $1,000 | $1.18 | 43d | 1 | 1.28mi |
| 4519 Cannon Ave Apt 2 Klamath Falls, OR | 2.0 | 1.0 | 850 | $1,050 | $1.24 | 43d | 1 | 1.28mi |
| 3311 Madison St Klamath Falls, OR | 1.0 | 1.0 | 700 | $900 | $1.29 | 43d | 1 | 1.36mi |
HOA detail
- Monthly dues
- $451 · $5,412/yr
Listing history 2 events
-
2026-04-20status Pending
-
2026-04-02$65,000 Active
ⓘ Source: listings_history table (triggers on properties + properties_extension) + one-shot
backfill from property_details.listing_events for pre-trigger history.
Tax reassessment forecast OR · Resets to sale price
- Current annual tax
- $376 · $31/mo
- Projected year-2 tax
- $630 · $53/mo
- Expected delta
- +$255/yr (+$21/mo · 67.8%)
ⓘ Screening estimate from a state-policy table — verify with the county assessor before closing.
Climate risk First Street
- Flood 3/10 Moderate FEMA zone X · 10% chance over 30 yrs
- Wildfire 5/10 Major
- Heat 3/10 Moderate 7 d/yr ≥90°F today · 17 d/yr by 30 yrs out
- Wind 1/10 Low
- Air quality 10/10 Extreme 38 unhealthy d/yr today · 39 by 30 yrs out
Nearby sold comps map
Loading sold comps map…
Walkable amenities ~0.75 mi
Loading nearby amenities…
Taxation est. · year 1
- Rental income
- $15,602
- − Mortgage interest
- −$3,641
- − Property taxes
- −$376
- − Insurance
- −$325
- − Repairs & maintenance
- −$1,248
- − Management
- −$1,248
- − HOA
- −$5,412
- − Depreciation
- −$1,891
- Taxable income
- $1,461
- Est. tax owed @ 24.0%
- −$351
- After-tax cash flow
- $1,772/yr
For passive investors: Depreciation is non-cash, so a rental often shows a tax loss while cash-flowing — sheltering income. Rental losses are passive: they offset passive income freely, and up to $25,000/yr can offset ordinary (W-2) income if you actively participate and your MAGI is under $100k (phasing out to $0 by $150k); unused losses carry forward. On sale, claimed depreciation is recaptured at up to 25%, and gains may owe capital-gains tax (a 1031 exchange can defer both). Figures are a year-1 estimate at your 24.0% rate — not tax advice; consult a CPA.
Schools (NCES district)
- District
- Klamath County SD
- NCES district ID
- 4107020
- Math proficiency
- 21% ▼ -17.00%
- Reading proficiency
- 37% ▼ -16.00%
- Median HH income
- $44,906
- Composite
- 24.83/100
- National rank
- #7593
- State rank
- #46 of 58 in OR
Livability — Altamont
- Score
- 65/100
- State rank
- #195
- US rank
- #12638
Category grades
Schools grade is shown separately in the Schools card above.
Census & demographics
- Census place
- Altamont, OR
- County
- Klamath County · 56,186 people
- Metro
- Klamath Falls, OR
- Population (ZIP)
- 33,222
- Household income
- $66,937
- Rent vs Own
- Severe rent burden
- 1147.0
Population outlook (Klamath County) Hauer SSP2
- Today (2025)
- 63,870 people
- By 2030
- 62,279 · -2.5%
- By 2040
- 58,891 · -7.8%
- By 2050
- 56,207 · -12.0%
- By 2075
- 51,239 · -19.8%
- By 2100
- 46,526 · -27.2%
Race, ethnicity, and origin ACS 2023
- Neighborhood character
- Predominantly White (73%)
- Race & ethnicity
- White 73% Hispanic / Latino 15% Two or more races 13% Native American 2%
- Hispanic origin (detail)
- Mexican 13%
- Common ancestry
- Portuguese 5% Italian 4% Lithuanian 3%
- Foreign-born
- 4% · Canada, China
- Languages at home
- 91% English-only · Spanish 7%
Political lean MEDSL · Klamath
- 2024 margin
- Solid R (+41.9) · D 27.9% · R 69.8% · Other 2.4%
- 2008→2024 swing
- -8.8pp toward R · 2008: -33.1pp · 2024: -41.9pp
- All cycles
- 2024: R+41.9 2020: R+40.6 2016: R+44.8 2012: R+38.2 2008: R+33.1
Not yet ingested
- Civics
- —
Market trends
- HPI YoY
- ▼ -122.75%
- Current HPI
- 198.1814
- Rent YoY
- ▲ 3.80%
- Metro
- Klamath Falls, OR
- State GDP YoY
- ▲ 2.05%
- F500 in state
- 2
Industry mix (Fortune 500 HQ in OR)
| Industry | F500 HQs | Revenue |
|---|---|---|
| Consumer Goods | 1 | $51B |
|
||
Price history
2 events — show timeline
- 2026-04-20 Pending — MLSCO
- 2026-04-02 Listed $65,000 MLSCO
Property tax history
+6.7%/yrLatest (2025): $376 · +2.7% YoY. Source: county tax records.
Cash-flow waterfall
monthlySold comps — $/sqft
last 12 mo · ≤1 miLoading sold comps…