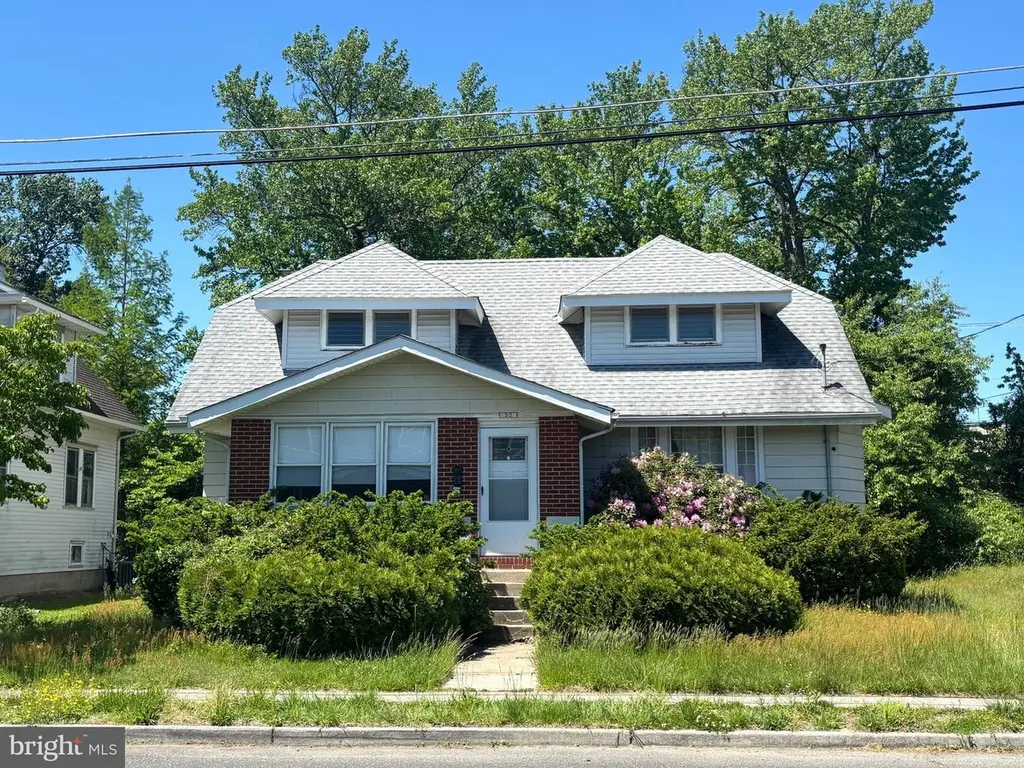
52 Park Blvd · Clementon, NJ
Flood risk 9/10 · Severe
- FEMA flood zone
- A
- Chance of flooding over 30 yrs
- 0.99%
- Est. flood insurance / yr
- $1,009 – $1,996
Fire risk 4/10 · Minor
- Est. fire insurance / yr
- $526 – $976
Heat risk 7/10 · Major
- Hot days now (above 103°F)
- 7 days/yr
- Hot days in 30 yrs
- 15 days/yr
Wind risk 6/10 · Moderate
- Chance of severe wind over 30 yrs
- 60.0%
Air-quality risk 3/10 · Minor
- Unhealthy air days now
- 3 days/yr
- Unhealthy air days in 30 yrs
- 3 days/yr
Risk factors via First Street. Map © Google.
Why this score? — see what drove the B- grade
The composite is a weighted blend of 9 inputs, each scored 0–100. Each bar is that input's sub-score; the figure is the points it added to the 100-point composite (weight × sub-score).
- Cash flow +23.6/30.0
- ARV discount +15.0/15.0
- 1% rule +8.0/10.0
- DSCR +7.6/10.0
- Livability +3.4/5.0
- Rent growth +3.3/5.0
- Condition / age +2.5/5.0
- Schools +2.3/10.0
- Appreciation +0.0/10.0
$190,000
🖨 Deal sheet 📄 Offer letter ✓ Due diligence
Listing remarks
If you are looking for a project, this may be the house for you. Being sold totally "As Is, " this 1925 Cape still retains some of its original charm, including large rooms, wide baseboards, arched doorways, oak flooring, and plaster walls. Front and rear dormers create interesting ceiling lines in the second-floor bedrooms. While the character remains, this home is in need of extensive renovation and is not for the average do-it-yourselfer.
Key facts
- 5,502 sq ft lot
- Built 1925
- Listed 9 days
Property features AI
Exterior
- Parking: Driveway parking
- Utilities: Public water; Public sewer; Electric cooling; Natural gas for heating and hot water
- Home design: Detached single-family home; Two floors
- Construction: Frame construction; Block foundation; Shingle roof; Building not winterized; Major rehab needed
- Exterior features: Lot dimensions approximately 50 x 110; Tidal water: No
Interior
- Kitchen: Kitchen (appliances not specified)
- Bedrooms: Three bedrooms total — one on the main level and two on the upper level
- Flooring: Wood flooring
- Bathrooms: One full bathroom (located on the main level)
- Heating & cooling: Central heating (natural gas); Central air conditioning (electric)
- Interior features: Plaster walls; Full unfinished basement with interior access and rear/outside entrance
- Laundry & utility: Hot water: Natural Gas
Neighborhood map
What this means for you Summary
Snapshot
- This is a 3-bed/1.0-bath single-family listed at $190k.
Deal economics
- At list price, monthly cash flow is $233 ($3k/yr) — positive.
- The deal already cash-flows at list — no discount required.
- Meets the 1% rule at list price ($2k rent vs $190k).
- Cap rate 8.6% vs local median 4.5% in Clementon — top-decile yield for the area; either an underpriced asset or a hidden risk that comps aren't pricing in. Stress-test before assuming the spread holds.
Location & tenants
- Location reads 68/100 on livability (#306 in NJ) — a middle-class / working-renter tenant base. Strengths: housing A-, health & safety B+, cost of living B; Watch: schools D+, amenities F, commute F.
- Clementon Elementary School District (suburban): math 11% / reading 42% proficiency, ranked #383 of 472 in NJ (top 81%) — low school quality limits family demand, transient renter base, plan for 1-2y turnover.
- Market conditions: Rents rising (+3.0%/yr); 237 active listings in the ZIP; 8 comparable units currently listed for rent nearby; rentals leasing fast (median 1d on market — plan ~1-2 weeks tenant-placement turnaround); 1,018 units permitted in Camden County in 2024 (509 in 5+ unit buildings).
- This rent runs 43% of the median local income ($68k/yr) — at the standard rent-burdened threshold; future hikes will face affordability resistance.
Forward outlook
- Local home prices are declining (-3.0%/yr); year-one equity from $1k of loan paydown is wiped out by about $6k of value loss. Plan a longer hold.
- Camden County population projected to shrink 8% by 2050 — rents likely to lag national; underwrite the cash flow, not the appreciation.
Negotiation context
- Only 9 days on market — expect competitive offers; lowballing is unlikely to land.
Risks & watch-outs
- Watch-outs: property tax is 3.3% of price; flood insurance adds $125/mo; built in 1925 — expect roof / HVAC / electrical / plumbing capex.
- Climate carrying-cost: in FEMA flood zone A (mandatory federal flood insurance); major wind risk, 60% chance of damaging wind over 30y; extreme-heat days projected 7→15/yr by 2055 (HVAC capex compounding) — expect insurance premiums to compound above CPI over the hold.
Questions for the listing agent
- Built in 1925 — when were the roof, HVAC, electrical panel, plumbing, and water heater last replaced?
- Property tax is high relative to price — has the assessment been appealed recently, and will the sale trigger a re-assessment?
- What's the actual annual flood-insurance premium (NFIP or private), and is the property in a SFHA with mandatory coverage?
- Is there a deadline driving the sale (1031 exchange, divorce, estate, relocation)? That informs how much negotiation room exists.
- Schools are D-rated, which usually means shorter tenancies and higher turnover. Who's the typical renter profile here, and what's been the actual vacancy rate?
- What's the average days-on-market for RENTAL listings here right now (not sales)? A rising rental-DOM trend means longer vacancies and softer asking-rent achievability than the comps imply.
- What's the recent tenant-quality profile in this submarket — average credit score on applications, eviction rate, late-payment / NSF rate, and stable-employment percentage? A property-management company in the area should have these aggregated.
- How much new for-sale + rental construction is in the pipeline within 1–3 miles? Heavy new supply typically softens prices + rents 12–24 months out; constrained supply supports both.
Investment metrics
- 1% rule
- 1.30% ✓
- Cap rate
- 8.55%
- Cash-on-cash
- 8.07%
- DSCR
- 1.36
- GRM
- 6.4
CMA / ARV
- ARV (on-the-fly)
- $307,517
- Comps found
- 12
Show comp detail 12 sales within ~0.75 mi
| Address | Dist | Beds/Ba | Sqft | Sold | Price | $/sf | Match |
|---|---|---|---|---|---|---|---|
| 29 Lincoln Ave | 0.11mi | 2/1.5 (-1) | 1,665 (+7%) | 2mo | $287,000 | $172 | 75 |
| 38 Lincoln Ave | 0.17mi | 3/2.0 | 1,450 (-7%) | 4mo | $310,000 | $214 | 73 |
| 44 Highland Ave | 0.48mi | 3/1.0 | 1,507 (-4%) | 1mo | $180,000 | $119 | 71 |
| 3 Harding Ave | 0.48mi | 3/— | 1,640 (+5%) | 5mo | $405,063 | $247 | 65 |
| 3 Dunwoody Ln | 0.43mi | 4/2.5 (+1) | 1,596 (+2%) | 0mo | $294,000 | $184 | 65 |
| 10 Wilson Ave | 0.63mi | 3/2.0 | 1,548 (-1%) | 9mo | $340,000 | $220 | 58 |
| 13 Meehan Blvd | 0.28mi | 4/2.0 (+1) | 1,426 (-9%) | 9mo | $370,000 | $259 | 56 |
| 11 Wilson Ave | 0.63mi | 3/2.0 | 1,500 (-4%) | 9mo | $240,000 | $160 | 53 |
| 26 Holly Rd | 0.55mi | 3/2.0 | 1,401 (-10%) | 0mo | $380,000 | $271 | 53 |
| 128 W Elm Ave | 0.67mi | 4/2.0 (+1) | 1,596 (+2%) | 10mo | $315,000 | $197 | 48 |
| 220 Berlin Rd | 0.40mi | 2/2.0 (-1) | 1,360 (-13%) | 10mo | $141,500 | $104 | 43 |
| 316 Wallace Ave | 0.63mi | 3/1.5 | 1,392 (-11%) | 10mo | $205,000 | $147 | 42 |
Match score weights: distance 35% · size 25% · config 20% · recency 20%. Top-matched comps best support the ARV.
Projected returns pro-forma
-3.0% appreciation · 3.02% rent growth · sell at horizon
- IRR
- -8.0%
- Equity multiple
- 0.71×
- Total profit
- $-15,638
- Equity at exit
- $28,330
- IRR
- 1.8%
- Equity multiple
- 1.13×
- Total profit
- $6,821
- Equity at exit
- $16,428
Cash invested: $53,200 (down + closing). Projections, not guarantees.
Landlord ↔ Tenant lean methodology
- Overall (STATE)
- 21 Tenant-Leaning
- State New Jersey
- 21 Tenant-Leaning · D+6
- County
- — inherits STATE
- City
- — inherits STATE
ZIP-level market 08021
- Home prices YoY
- -31.6%
- Rents YoY
- 3.0%
- Active inventory
- 237
- Price-to-rent
- 6.4×
Monthly cashflow live
- Estimated rent
- $2,466 high interval (Pro) →
- Mortgage (P&I)
- −$996
- Tax from tax record
- −$515 /mo · $6,180/yr
- Insurance
- −$79
- Flood insurance flood zone
- −$125 /mo · $1,502/yr
- HOA
- −$0
- Vacancy / Maint / Mgmt
- −$518
- Net cashflow
- $233
Break-even live
UW: 25.0% down · 7.5% · 30yr · 1.5% tax · 5.0% vac · 8.0% maint · 8.0% mgmt
Financing live
Cash to close
- Down payment
- $47,500
- Closing costs
- $5,700
- Reserves months
- —
- Total cash needed
- —
Loan-product check · same deal, 3 products live
Conventional
25% down · 7.5% · 30yr
- Down + closing
- —
- Monthly P&I
- —
- Monthly cashflow
- —
- DSCR
- —
- Eligible?
- —
Personal DTI + credit; lowest rate.
DSCR
20% down · 8.5% · 30yr
- Down + closing
- —
- Monthly P&I
- —
- Monthly cashflow
- —
- DSCR
- —
- Eligible?
- —
No personal income docs; deal must DSCR.
Hard money
10% down · 12.0% · 12mo
- Down + closing
- —
- Monthly P&I
- —
- Monthly cashflow
- —
- DSCR
- —
- Eligible?
- —
Short-term bridge; refi at stabilization.
Rent comps 8 comps
| Address | Beds | Baths | Sqft | Rent | $/sqft | DOM | Units | Dist |
|---|---|---|---|---|---|---|---|---|
| 98 Oak St Clementon, NJ | 1.0–2.0 | 1.0–2.0 | 1027 | $2,040 | $1.99 | 1d | 44 | 0.65mi |
| 16 W Linden Ave Lindenwold, NJ | 4.0 | 1.0 | 1560 | $2,950 | $1.89 | 1d | 1 | 0.83mi |
| 550 Bilper Ave Lindenwold, NJ | 1.0–2.0 | 1.0 | 950 | $1,700 | $1.79 | 24d | 1 | 1.04mi |
| 359 Lake Blvd Lindenwold, NJ | 3.0 | 2.0 | 1196 | $2,900 | $2.42 | 1d | 1 | 1.19mi |
| 136 Colonial Sq Lindenwold, NJ | 3.0 | 1.5 | 1380 | $1,950 | $1.41 | 24d | 1 | 1.20mi |
| 9 Georgetown Rd Lindenwold, NJ | 3.0 | 2.5 | 1268 | $2,600 | $2.05 | 1d | 1 | 1.34mi |
| 222 Berlin Rd N Lindenwold, NJ | 3.0 | 1.5 | 1925 | $3,300 | $1.71 | 1d | 1 | 1.37mi |
| 51 Chiswick Dr Unit 1 Lindenwold, NJ | 3.0 | 2.0 | 1110 | $2,650 | $2.39 | 1d | 1 | 1.38mi |
Listing history 1 events
-
2026-05-18$190,000 Active
ⓘ Source: listings_history table (triggers on properties + properties_extension) + one-shot
backfill from property_details.listing_events for pre-trigger history.
Tax reassessment forecast NJ · Partial reset (capped growth)
- Current annual tax
- $6,180 · $515/mo
- Projected year-2 tax
- $6,180 · $515/mo
- Expected delta
- $0/yr ($0/mo · 0.0%)
ⓘ Screening estimate from a state-policy table — verify with the county assessor before closing.
Climate risk First Street
- Flood 9/10 Extreme FEMA zone A · 99% chance over 30 yrs
- Wildfire 4/10 Moderate
- Heat 7/10 Severe 7 d/yr ≥103°F today · 15 d/yr by 30 yrs out
- Wind 6/10 Major 60% chance of damaging wind over 30 yrs
- Air quality 3/10 Moderate 3 unhealthy d/yr today · 3 by 30 yrs out
Nearby sold comps map
Loading sold comps map…
Walkable amenities ~0.75 mi
Loading nearby amenities…
Taxation est. · year 1
- Rental income
- $29,596
- − Mortgage interest
- −$10,643
- − Property taxes
- −$6,180
- − Insurance
- −$2,452
- − Repairs & maintenance
- −$2,368
- − Management
- −$2,368
- − Depreciation
- −$5,527
- Taxable income
- $58
- Est. tax owed @ 24.0%
- −$14
- After-tax cash flow
- $2,778/yr
For passive investors: Depreciation is non-cash, so a rental often shows a tax loss while cash-flowing — sheltering income. Rental losses are passive: they offset passive income freely, and up to $25,000/yr can offset ordinary (W-2) income if you actively participate and your MAGI is under $100k (phasing out to $0 by $150k); unused losses carry forward. On sale, claimed depreciation is recaptured at up to 25%, and gains may owe capital-gains tax (a 1031 exchange can defer both). Figures are a year-1 estimate at your 24.0% rate — not tax advice; consult a CPA.
Schools (NCES district)
- District
- Clementon Elementary School District
- NCES district ID
- 3403240
- Math proficiency
- 11% ▼ -24.00%
- Reading proficiency
- 42% ▼ -24.00%
- Median HH income
- $47,251
- Composite
- 22.91/100
- National rank
- #7999
- State rank
- #383 of 472 in NJ
Livability — Clementon
- Score
- 68/100
- State rank
- #306
- US rank
- #9433
Category grades
Schools grade is shown separately in the Schools card above.
Census & demographics
- Census place
- Clementon, NJ
- County
- Camden County · 407,624 people
- City population
- 49,060
- Metro
- Philadelphia-Camden-Wilmington, PA-NJ-DE-MD
- Population (ZIP)
- 49,305
- Household income
- $68,044
- Rent vs Own
- Severe rent burden
- 3050.0
Population outlook (Camden County) Hauer SSP2
- Today (2025)
- 507,964 people
- By 2030
- 502,182 · -1.1%
- By 2040
- 485,602 · -4.4%
- By 2050
- 465,630 · -8.3%
- By 2075
- 419,986 · -17.3%
- By 2100
- 369,492 · -27.3%
Race, ethnicity, and origin ACS 2023
- Neighborhood character
- Diverse neighborhood (Simpson 0.69)
- Race & ethnicity
- White 44% Black 27% Hispanic / Latino 20% Two or more races 11% Asian 3%
- Hispanic origin (detail)
- Mexican 4% Puerto Rican 6% Dominican 2%
- Common ancestry
- Romanian 3% Lithuanian 1% Iranian 1%
- Foreign-born
- 12% · Canada, China, Vietnam
- Languages at home
- 81% English-only · Spanish 14% Chinese 1% Tagalog/Filipino 1%
Political lean MEDSL · Camden
- 2024 margin
- Strong D (+27.4) · D 63.0% · R 35.5% · Other 1.5%
- 2008→2024 swing
- -8.8pp toward R · 2008: 36.2pp · 2024: 27.4pp
- All cycles
- 2024: D+27.4 2020: D+33.5 2016: D+32.4 2012: D+36.6 2008: D+36.2
Not yet ingested
- Civics
- —
Market trends
- HPI YoY
- ▼ -156.73%
- Current HPI
- 338.8351
- Rent YoY
- ▲ 3.02%
- Metro
- Philadelphia-Camden-Wilmington, PA-NJ-DE-MD
- State GDP YoY
- ▲ 2.05%
- F500 in state
- 34
Industry mix (Fortune 500 HQ in NJ)
| Industry | F500 HQs | Revenue |
|---|---|---|
| Consumer Goods | 3 | $31B |
|
||
| Pharmaceuticals | 2 | $153B |
|
||
| Technology | 2 | $21B |
|
||
| Insurance | 2 | $20B |
|
||
| Healthcare | 2 | $19B |
|
||
| Financial Services | 1 | $70B |
|
||
Price history
1 event — show timeline
- 2026-05-18 Listed $190,000 BRIGHT MLS
Property tax history
+2.7%/yrLatest (2025): $6,180 · +5.9% YoY. Source: county tax records.
Cash-flow waterfall
monthlySold comps — $/sqft
last 12 mo · ≤1 miLoading sold comps…