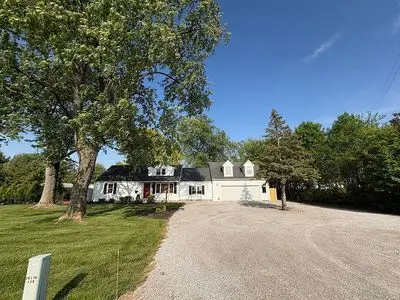
10920 Auburn Rd · Fort Wayne, IN
Flood risk 1/10 · Minimal
- FEMA flood zone
- X (unshaded)
- Chance of flooding over 30 yrs
- 0.0%
- Est. flood insurance / yr
- $507 – $1,088
Fire risk 1/10 · Minimal
- Est. fire insurance / yr
- $717 – $1,331
Heat risk 3/10 · Minor
- Hot days now (above 100°F)
- 7 days/yr
- Hot days in 30 yrs
- 17 days/yr
Wind risk 2/10 · Minimal
- Chance of severe wind over 30 yrs
- —
Air-quality risk 3/10 · Minor
- Unhealthy air days now
- 2 days/yr
- Unhealthy air days in 30 yrs
- 3 days/yr
Risk factors via First Street. Map © Google.
Why this score? — see what drove the D grade
The composite is a weighted blend of 9 inputs, each scored 0–100. Each bar is that input's sub-score; the figure is the points it added to the 100-point composite (weight × sub-score).
- ARV discount +10.4/15.0
- Cash flow +9.7/30.0
- Rent growth +5.0/5.0
- Schools +4.9/10.0
- Livability +4.2/5.0
- DSCR +2.7/10.0
- Condition / age +2.5/5.0
- 1% rule +2.1/10.0
- Appreciation +0.0/10.0
$329,900
🖨 Deal sheet (PDF) 📄 Offer letter ✓ Due diligence
Listing remarks MLS
Present your best offer by 9pm 4/27/18 and seller will decide by 10 am 4/28. No neighborhood restrictions! There is a additional 675 sqft finished space above the 6 car attached heated garage, which is not included in the finished square footage but does have a heating and cooling source. It has a separate access thru the garage and from the exterior. This home has a nice living room with brand new carpet and a sliding door to the outside. Also a long room with hardwood floors lots of natural sunlight that you can use as a dining room or additional living space. The kitchen is between the two rooms and comes with the appliances. Separate utility room that leads out back to a large newer deck. Two bedrooms on the main floor with a full bath in the hall. Then when you walk up stairs you could use it as a large master suite or have a couple options with a lot of storage. Upstairs you will find a sharp full bath with tile surround and tub with custom vanity and new flooring. Large . 61 Acre lot with a partially fenced back yard and the newer swing set does remain. And that garage! This home has city sewer and well water. The sellers are offering a 1 year home Warranty! Northwest Allen County Schools, close to all the hospitals, shopping and even Starbucks! Seller selling it “as is”.
Key facts
- Finished bonus space
- Private entrance
- Built 1954
Tags
Neighborhood map
What this means for you Summary
Snapshot
- This is a 3-bed/2.0-bath single-family listed at $330k.
Deal economics
- At list price, monthly cash flow is $-218 ($-3k/yr) — negative.
- To cash-flow at today's rent, offer at most $291k (11.7% below list).
- To meet the 1% rule (rent ≥ 1% of price), the offer needs to be $234k (29.0% below list).
- Recommended offer: $234k (29.0% below list) — sets the bar for 1% rule.
Location & tenants
- Location reads 84/100 on livability (#6 in IN, #676 nationally) — a professional / high-income tenant draw. Strengths: amenities A+, commute A+, cost of living A+; Watch: crime C-, employment D+.
- Northwest Allen County Schools (rural): math 51% / reading 58% proficiency, ranked #25 of 301 in IN (top 8%) — acceptable for families but not a draw, mixed tenant base, ~2y average lease; only 11% free/reduced lunch — higher-income household profile.
- Zoned schools: Perry Hill Elementary School (math 58% / reading 54%, grade C+, #183 of 994 statewide, top 19%, 544 students, 19% FRL); Maple Creek Middle School (math 41% / reading 60%, grade C, #43 of 330 statewide, top 14%, 957 students, 14% FRL); Carroll High School (math 59% / reading 86%, grade B+, #10 of 369 statewide, top 3%, 2,554 students, 21% FRL).
- Market conditions: Rents rising fast (+10.5%/yr); 224 active listings in the ZIP; 1 comparable units currently listed for rent nearby; high-income renter base; 1,861 units permitted in Allen County in 2024 (576 in 5+ unit buildings).
Forward outlook
- Local home prices are declining (-3.0%/yr); year-one equity from $2k of loan paydown is wiped out by about $10k of value loss. Plan a longer hold.
- Allen County population projected at +10% by 2050 — modest demand growth; plan on rents tracking national, not racing it.
Negotiation context
- It's been on market 34 days — a 3% lower offer ($320k) is reasonable based on typical stale-listing flexibility.
- 2 sale attempts since 8y ago with the ask held roughly flat each time — persistent listings suggest the price (not the market) is what's stuck; bring a comps-based counter.
- Current owner paid $142k; list at $330k implies a 132% gain — meaningful room to come down on a strong offer.
Risks & watch-outs
- Watch-outs: built in 1954 — expect roof / HVAC / electrical / plumbing capex.
Questions for the listing agent
- What do current leases actually rent for vs. the listed asking? Can we see a recent rent roll and the last 12 months of T-12 income?
- It's been on market 34 days. Have you received any prior offers? Is the seller open to a 29% concession, seller financing, or rate buy-down credit?
- Built in 1954 — when were the roof, HVAC, electrical panel, plumbing, and water heater last replaced?
- Is there a deadline driving the sale (1031 exchange, divorce, estate, relocation)? That informs how much negotiation room exists.
- Schools are D-rated, which usually means shorter tenancies and higher turnover. Who's the typical renter profile here, and what's been the actual vacancy rate?
- The area grade is low — what's the realistic commute time and amenity access for the typical tenant pool here? Any planned neighborhood developments (good or bad) we should know about?
- What's the average days-on-market for RENTAL listings here right now (not sales)? A rising rental-DOM trend means longer vacancies and softer asking-rent achievability than the comps imply.
- What's the recent tenant-quality profile in this submarket — average credit score on applications, eviction rate, late-payment / NSF rate, and stable-employment percentage? A property-management company in the area should have these aggregated.
- How much new for-sale + rental construction is in the pipeline within 1–3 miles? Heavy new supply typically softens prices + rents 12–24 months out; constrained supply supports both.
Investment metrics
- 1% rule
- 0.71% ✗
- Cap rate
- 5.50%
- Cash-on-cash
- -2.83%
- DSCR
- 0.87
- GRM
- 11.7
CMA / ARV
- ARV (on-the-fly)
- $352,896
- Comps found
- 12
Show comp detail 12 sales within ~0.75 mi
| Address | Dist | Beds/Ba | Sqft | Sold | Price | $/sf | Match |
|---|---|---|---|---|---|---|---|
| 3031 Wilderness Rd | 0.47mi | 4/2.5 (+1) | 2,684 (-3%) | 10mo | $282,500 | $105 | 58 |
| 2728 Windridge Ct | 0.37mi | 4/2.5 (+1) | 2,546 (-8%) | 10mo | $409,000 | $161 | 55 |
| 10535 Brandywine Dr | 0.48mi | 4/2.5 (+1) | 2,924 (+6%) | 9mo | $360,000 | $123 | 52 |
| 11421 Trails North Dr | 0.74mi | 4/2.5 (+1) | 2,678 (-3%) | 4mo | $349,900 | $131 | 50 |
| 1716 Traders Xing | 0.40mi | 4/2.5 (+1) | 3,120 (+13%) | 3mo | $382,000 | $122 | 50 |
| 1827 Ransom Dr | 0.40mi | 4/3.0 (+1) | 2,508 (-9%) | 11mo | $359,900 | $144 | 48 |
| 1637 Traders Xing | 0.40mi | 4/2.5 (+1) | 2,356 (-14%) | 12mo | $280,000 | $119 | 40 |
| 11730 Champagne Ct | 0.55mi | 4/2.5 (+1) | 3,023 (+10%) | 15mo | $395,000 | $131 | 39 |
| 1940 Windmill Ridge Run | 0.58mi | 3/3.5 | 3,072 (+11%) | 11mo | $715,400 | $233 | 39 |
| 11115 Trails North Dr | 0.65mi | 4/2.5 (+1) | 3,034 (+10%) | 15mo | $385,000 | $127 | 34 |
| 11418 Trails North Dr | 0.71mi | 3/3.0 | 2,410 (-13%) | 13mo | $275,000 | $114 | 31 |
| 1813 Kelleys Lndg | 0.71mi | 4/3.5 (+1) | 3,131 (+14%) | 10mo | $400,000 | $128 | 25 |
Match score weights: distance 35% · size 25% · config 20% · recency 20%. Top-matched comps best support the ARV.
Projected returns pro-forma
-3.0% appreciation · 8.0% rent growth · sell at horizon
- IRR
- -16.1%
- Equity multiple
- 0.40×
- Total profit
- $-55,070
- Equity at exit
- $49,189
- IRR
- -1.3%
- Equity multiple
- 0.89×
- Total profit
- $-9,887
- Equity at exit
- $28,524
Cash invested: $92,372 (down + closing). Projections, not guarantees.
Landlord ↔ Tenant lean methodology
- Overall (STATE)
- 90 Strongly Landlord-Friendly
- State Indiana
- 90 Strongly Landlord-Friendly · R+11
- County
- — inherits STATE
- City
- — inherits STATE
ZIP-level market 46845
- Home prices YoY
- -34.6%
- Rents YoY
- 10.5%
- Active inventory
- 224
- Price-to-rent
- 11.7×
Monthly cashflow live
- Estimated rent
- $2,343 medium interval (Pro) →
- Mortgage (P&I)
- −$1,730
- Tax from tax record
- −$201 /mo · $2,416/yr
- Insurance
- −$137
- HOA
- −$0
- Vacancy / Maint / Mgmt
- −$492
- Net cashflow
- $-218
Break-even live
Sensitivity live
| Price | -10% $-31 | -5% $-125 | +0% $-218 | +5% $-312 | +10% $-405 |
|---|---|---|---|---|---|
| Rent | -10% $-403 | -5% $-311 | +0% $-218 | +5% $-126 | +10% $-33 |
| Rate | -1.0pp $-52 | -0.5pp $-134 | base $-218 | +0.5pp $-304 | +1.0pp $-391 |
UW: 25.0% down · 7.5% · 30yr · 1.5% tax · 5.0% vac · 8.0% maint · 8.0% mgmt
Financing live
Cash to close
- Down payment
- $82,475
- Closing costs
- $9,897
- Reserves months
- —
- Total cash needed
- —
Loan-product check · same deal, 3 products live
Conventional
25% down · 7.5% · 30yr
- Down + closing
- —
- Monthly P&I
- —
- Monthly cashflow
- —
- DSCR
- —
- Eligible?
- —
Personal DTI + credit; lowest rate.
DSCR
20% down · 8.5% · 30yr
- Down + closing
- —
- Monthly P&I
- —
- Monthly cashflow
- —
- DSCR
- —
- Eligible?
- —
No personal income docs; deal must DSCR.
Hard money
10% down · 12.0% · 12mo
- Down + closing
- —
- Monthly P&I
- —
- Monthly cashflow
- —
- DSCR
- —
- Eligible?
- —
Short-term bridge; refi at stabilization.
Rent comps 1 comps
| Address | Beds | Baths | Sqft | Rent | $/sqft | DOM | Units | Dist |
|---|---|---|---|---|---|---|---|---|
| 11111 Kings Xing Fort Wayne, IN | 4.0 | 2.5 | 3700 | $3,600 | $0.97 | 23d | 1 | 0.51mi |
Listing history 19 events
-
2026-06-21days on market $329,900 Active 34 DOM
-
2026-06-18days on market $329,900 Active 31 DOM
-
2026-06-17days on market $329,900 Active 30 DOM
-
2026-06-16days on market $329,900 Active 29 DOM
-
2026-06-15days on market $329,900 Active 28 DOM
-
2026-06-14days on market $329,900 Active 26 DOM
-
2026-06-13days on market $329,900 Active 25 DOM
-
2026-06-10days on market $329,900 Active 23 DOM
-
2026-06-09days on market $329,900 Active 22 DOM
-
2026-06-08days on market $329,900 Active 21 DOM
-
2026-06-07days on market $329,900 Active 20 DOM
-
2026-06-03days on market $329,900 Active 16 DOM
-
2026-06-02days on market $329,900 Active 15 DOM
-
2026-06-01days on market $329,900 Active 14 DOM
-
2026-05-31days on market $329,900 Active 13 DOM
-
2026-05-30days on market $329,900 Active 12 DOM
-
2026-05-19$329,900 Active
-
2018-05-25soldstatus $141,900 1312-char remark
Show marketing remark (1312 chars)
Present your best offer by 9pm 4/27/18 and seller will decide by 10 am 4/28. No neighborhood restrictions! There is a additional 675 sqft finished space above the 6 car attached heated garage, which is not included in the finished square footage but does have a heating and cooling source. It has a separate access thru the garage and from the exterior. This home has a nice living room with brand new carpet and a sliding door to the outside. Also a long room with hardwood floors lots of natural sunlight that you can use as a dining room or additional living space. The kitchen is between the two rooms and comes with the appliances. Separate utility room that leads out back to a large newer deck. Two bedrooms on the main floor with a full bath in the hall. Then when you walk up stairs you could use it as a large master suite or have a couple options with a lot of storage. Upstairs you will find a sharp full bath with tile surround and tub with custom vanity and new flooring. Large . 61 Acre lot with a partially fenced back yard and the newer swing set does remain. And that garage! This home has city sewer and well water. The sellers are offering a 1 year home Warranty! Northwest Allen County Schools, close to all the hospitals, shopping and even Starbucks! Seller selling it “as is”.
-
2018-04-13$139,900 1312-char remark
Show marketing remark (1312 chars)
Present your best offer by 9pm 4/27/18 and seller will decide by 10 am 4/28. No neighborhood restrictions! There is a additional 675 sqft finished space above the 6 car attached heated garage, which is not included in the finished square footage but does have a heating and cooling source. It has a separate access thru the garage and from the exterior. This home has a nice living room with brand new carpet and a sliding door to the outside. Also a long room with hardwood floors lots of natural sunlight that you can use as a dining room or additional living space. The kitchen is between the two rooms and comes with the appliances. Separate utility room that leads out back to a large newer deck. Two bedrooms on the main floor with a full bath in the hall. Then when you walk up stairs you could use it as a large master suite or have a couple options with a lot of storage. Upstairs you will find a sharp full bath with tile surround and tub with custom vanity and new flooring. Large . 61 Acre lot with a partially fenced back yard and the newer swing set does remain. And that garage! This home has city sewer and well water. The sellers are offering a 1 year home Warranty! Northwest Allen County Schools, close to all the hospitals, shopping and even Starbucks! Seller selling it “as is”.
ⓘ Source: listings_history table (triggers on properties + properties_extension) + one-shot
backfill from property_details.listing_events for pre-trigger history.
Tax reassessment forecast IN · Partial reset (capped growth)
- Current annual tax
- $2,416 · $201/mo
- Projected year-2 tax
- $2,610 · $218/mo
- Expected delta
- +$194/yr (+$16/mo · 8.0%)
ⓘ Screening estimate from a state-policy table — verify with the county assessor before closing.
Climate risk First Street
- Flood 1/10 Low FEMA zone X (unshaded) · 0% chance over 30 yrs
- Wildfire 1/10 Low
- Heat 3/10 Moderate 7 d/yr ≥100°F today · 17 d/yr by 30 yrs out
- Wind 2/10 Low
- Air quality 3/10 Moderate 2 unhealthy d/yr today · 3 by 30 yrs out
Nearby sold comps map
Loading sold comps map…
Walkable amenities ~0.75 mi
Loading nearby amenities…
Taxation est. · year 1
- Rental income
- $28,111
- − Mortgage interest
- −$18,480
- − Property taxes
- −$2,416
- − Insurance
- −$1,650
- − Repairs & maintenance
- −$2,249
- − Management
- −$2,249
- − Depreciation
- −$9,597
- Taxable loss
- −$8,529
- Est. tax savings @ 24.0%
- +$2,047
- After-tax cash flow
- $-571/yr
For passive investors: Depreciation is non-cash, so a rental often shows a tax loss while cash-flowing — sheltering income. Rental losses are passive: they offset passive income freely, and up to $25,000/yr can offset ordinary (W-2) income if you actively participate and your MAGI is under $100k (phasing out to $0 by $150k); unused losses carry forward. On sale, claimed depreciation is recaptured at up to 25%, and gains may owe capital-gains tax (a 1031 exchange can defer both). Figures are a year-1 estimate at your 24.0% rate — not tax advice; consult a CPA.
Schools (NCES district)
- District
- Northwest Allen County Schools
- NCES district ID
- 1808250
- Math proficiency
- 51% ▼ -6.00%
- Reading proficiency
- 58% ▼ -5.00%
- Median HH income
- $78,952
- Composite
- 49.26/100
- National rank
- #2027
- State rank
- #25 of 301 in IN
Livability — Fort Wayne
- Score
- 84/100
- State rank
- #6
- US rank
- #676
Category grades
Schools grade is shown separately in the Schools card above.
Census & demographics
- Census place
- Fort Wayne, IN
- County
- Allen County · 326,813 people
- City population
- 326,813
- Metro
- Fort Wayne, IN
- Population (ZIP)
- 29,583
- Household income
- $112,676
- Rent vs Own
- Severe rent burden
- 467.0
Population outlook (Allen County) Hauer SSP2
- Today (2025)
- 394,020 people
- By 2030
- 405,128 · +2.8%
- By 2040
- 423,476 · +7.5%
- By 2050
- 435,137 · +10.4%
- By 2075
- 450,293 · +14.3%
- By 2100
- 424,101 · +7.6%
Race, ethnicity, and origin ACS 2023
- Neighborhood character
- Predominantly White (86%)
- Race & ethnicity
- White 86% Asian 4% Two or more races 4% Hispanic / Latino 3% Black 3%
- Common ancestry
- Italian 4% Romanian 3% Lithuanian 3%
- Foreign-born
- 5% · Vietnam, Canada, China
- Languages at home
- 93% English-only · Spanish 2% Chinese 1% Vietnamese 1%
Political lean MEDSL · Allen
- 2024 margin
- R (+12.5) · D 42.9% · R 55.4% · Other 1.7%
- 2008→2024 swing
- -8.1pp toward R · 2008: -4.3pp · 2024: -12.5pp
- All cycles
- 2024: R+12.5 2020: R+11.2 2016: R+19.6 2012: R+16.8 2008: R+4.3
Not yet ingested
- Civics
- —
Market trends
- HPI YoY
- ▼ -112.27%
- Current HPI
- 212.3516
- Rent YoY
- ▲ 10.47%
- Metro
- Fort Wayne, IN
- State GDP YoY
- ▲ 2.90%
- F500 in state
- 18
Industry mix (Fortune 500 HQ in IN)
| Industry | F500 HQs | Revenue |
|---|---|---|
| Industrial Machinery | 2 | $37B |
|
||
| Healthcare | 1 | $177B |
|
||
| Pharmaceuticals | 1 | $45B |
|
||
| Metals / Steel | 1 | $18B |
|
||
| Agriculture | 1 | $17B |
|
||
| Packaging | 1 | $12B |
|
||
Price history
+135.8% since first listed3 events — show timeline
- 2026-05-19 Listed $329,900 FSBO.com
- 2018-05-25 Sold (MLS) $141,900 IRMLS
- 2018-04-13 Listed $139,900 IRMLS
Property tax history
+3.3%/yrLatest (2024): $2,416 · +3.9% YoY. Source: county tax records.
Cash-flow waterfall
monthlySold comps — $/sqft
last 12 mo · ≤1 miLoading sold comps…