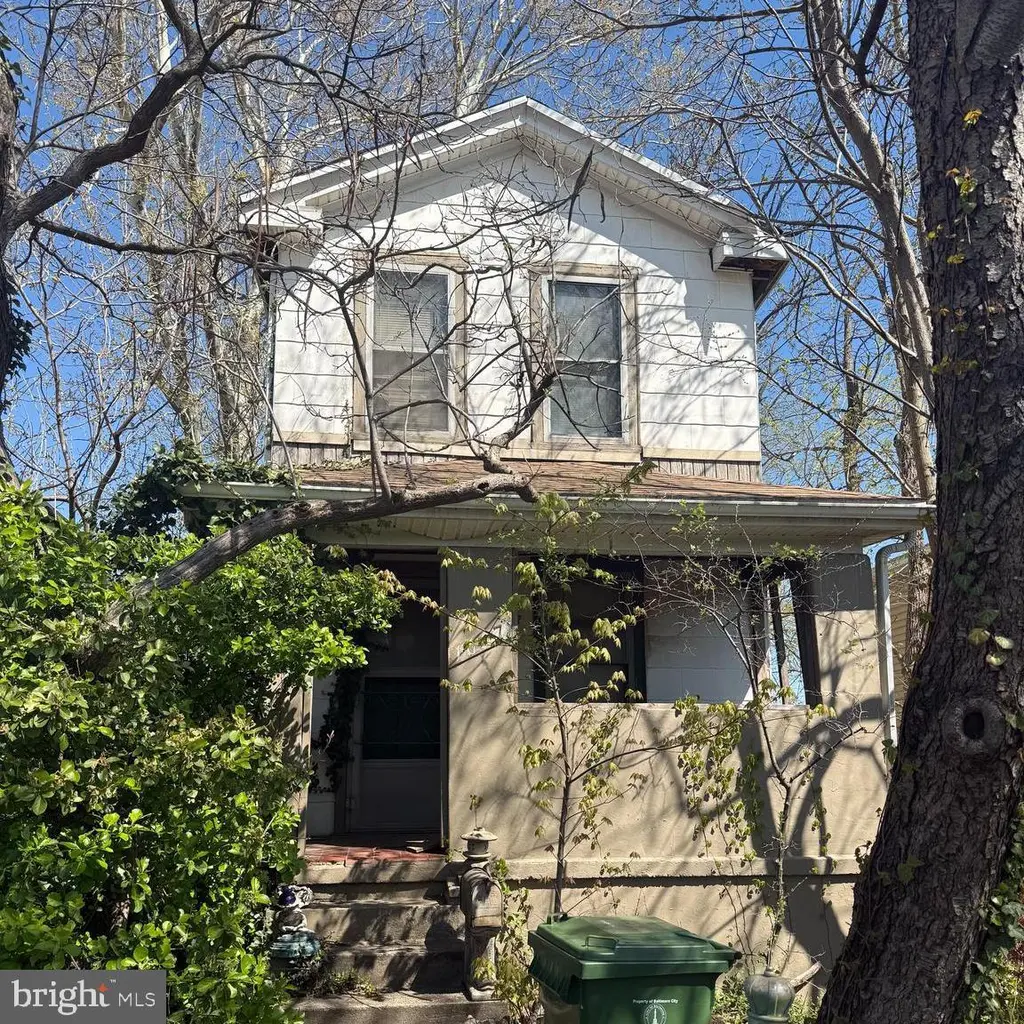
1607 Elrino St · Baltimore, MD
Flood risk 1/10 · Minimal
- FEMA flood zone
- X (unshaded)
- Chance of flooding over 30 yrs
- 0.0%
- Est. flood insurance / yr
- $473 – $860
Fire risk 1/10 · Minimal
- Est. fire insurance / yr
- $755 – $1,403
Heat risk 8/10 · Major
- Hot days now (above 104°F)
- 7 days/yr
- Hot days in 30 yrs
- 15 days/yr
Wind risk 6/10 · Moderate
- Chance of severe wind over 30 yrs
- 27.0%
Air-quality risk 5/10 · Moderate
- Unhealthy air days now
- 6 days/yr
- Unhealthy air days in 30 yrs
- 8 days/yr
Risk factors via First Street. Map © Google.
Why this score? — see what drove the B- grade
The composite is a weighted blend of 9 inputs, each scored 0–100. Each bar is that input's sub-score; the figure is the points it added to the 100-point composite (weight × sub-score).
- Cash flow +30.0/30.0
- 1% rule +10.0/10.0
- DSCR +10.0/10.0
- ARV discount +7.5/15.0
- Livability +3.8/5.0
- Rent growth +2.8/5.0
- Condition / age +2.5/5.0
- Schools +1.0/10.0
- Appreciation +0.0/10.0
$95,000
🖨 Deal sheet 📄 Offer letter ✓ Due diligence
Listing remarks
Investor opportunity! Detached 3-bedroom, 1-bath colonial located on the Baltimore City side of Dundalk. Property requires full renovation and is being sold strictly as-is. Features include an unfinished basement, 4,125 sq ft lot, and strong value-add potential. Cash or hard money financing only. Excellent opportunity for investors, flippers, or builders seeking a project in an area with strong renovated resale activity. Seller prefers a quick close. Buyer responsible for verifying all information and performing their own due diligence.
Key facts
- 4,125 sq ft lot
- Built 1936
- Listed 14 days
Property features AI
Finance
- Other: Ownership: Fee simple; Living area source: Assessor; Year built source: Assessor
Exterior
- Parking: Driveway parking
- Utilities: Public water; Public sewer
- Home design: Detached property; Above-grade finished area of 1,224 (per assessor); Below-grade unfinished area of 612 (per assessor); Located in city limits (Baltimore City)
- Construction: Aluminum siding; Block foundation; Structure type: Detached
- Exterior features: Driveway
Interior
- Bedrooms: Three bedrooms on the upper level
- Bathrooms: One full bathroom
- Interior features: Unfinished basement
Neighborhood map
What this means for you Summary
Snapshot
- This is a 3-bed/1.0-bath single-family listed at $95k.
Deal economics
- At list price, monthly cash flow is $893 ($11k/yr) — positive.
- The deal already cash-flows at list — no discount required.
- Meets the 1% rule at list price ($2k rent vs $95k).
- Recommended offer: $94k (1.5% below list) — sets the bar for market timing.
- Cap rate 17.6% vs local median 6.0% in Baltimore — top-decile yield for the area; either an underpriced asset or a hidden risk that comps aren't pricing in. Stress-test before assuming the spread holds.
Location & tenants
- Location reads 76/100 on livability (#90 in MD, #3,396 nationally) — a middle-class / working-renter tenant base. Strengths: amenities A+, commute A+, housing A+; Watch: schools D, crime F.
- Baltimore City Public Schools (urban): math 7% / reading 16% proficiency, ranked #24 of 24 in MD (top 100%) — low school quality limits family demand, transient renter base, plan for 1-2y turnover; 79% free/reduced lunch — lower-income household profile, screen leases tightly.
- Market conditions: Rents rising (+1.3%/yr); 391 active listings in the ZIP; 40 comparable units currently listed for rent nearby; rentals at typical pace (median 24d on market — plan ~3-4 weeks tenant-placement turnaround); solid renter incomes; 1,273 units permitted in Baltimore city in 2024 (1,104 in 5+ unit buildings).
Forward outlook
- Local home prices are declining (-3.0%/yr); year-one equity from $657 of loan paydown is wiped out by about $3k of value loss. Plan a longer hold.
- Baltimore County population projected to shrink 4% by 2050 — rents likely to lag national; underwrite the cash flow, not the appreciation.
- At projected returns (-3.0% appreciation + 1.3% rent growth), your $27k cash investment doubles in ~4 years — after that, you're playing with house money.
Negotiation context
- It's been on market 15 days — a 2% lower offer ($94k) is reasonable based on typical stale-listing flexibility.
- Current owner paid $32k; list at $95k implies a 202% gain — meaningful room to come down on a strong offer.
Risks & watch-outs
- Watch-outs: built in 1936 — expect roof / HVAC / electrical / plumbing capex.
- Climate carrying-cost: major wind risk, 27% chance of damaging wind over 30y; extreme-heat days projected 7→15/yr by 2055 (HVAC capex compounding) — expect insurance premiums to compound above CPI over the hold.
Questions for the listing agent
- Built in 1936 — when were the roof, HVAC, electrical panel, plumbing, and water heater last replaced?
- Is there a deadline driving the sale (1031 exchange, divorce, estate, relocation)? That informs how much negotiation room exists.
- Schools are D-rated, which usually means shorter tenancies and higher turnover. Who's the typical renter profile here, and what's been the actual vacancy rate?
- Crime grade is F in this area — have there been break-ins, vandalism, or insurance claims at this property in the last 3 years? What carrier currently insures it and at what premium?
- What's the average days-on-market for RENTAL listings here right now (not sales)? A rising rental-DOM trend means longer vacancies and softer asking-rent achievability than the comps imply.
- What's the recent tenant-quality profile in this submarket — average credit score on applications, eviction rate, late-payment / NSF rate, and stable-employment percentage? A property-management company in the area should have these aggregated.
- How much new for-sale + rental construction is in the pipeline within 1–3 miles? Heavy new supply typically softens prices + rents 12–24 months out; constrained supply supports both.
Investment metrics
- 1% rule
- 2.14% ✓
- Cap rate
- 17.57%
- Cash-on-cash
- 40.29%
- DSCR
- 2.79
- GRM
- 3.9
CMA / ARV
- ARV (on-the-fly)
- $232,560
- Comps found
- 9
Show comp detail 9 sales within ~0.75 mi
| Address | Dist | Beds/Ba | Sqft | Sold | Price | $/sf | Match |
|---|---|---|---|---|---|---|---|
| 1604 Charlotte Ave | 0.03mi | 3/2.0 | 1,100 (-10%) | 2mo | $311,000 | $283 | 76 |
| 6209 Danville Ave | 0.09mi | 3/1.0 | 1,050 (-14%) | 3mo | $199,000 | $190 | 70 |
| 6607 Hartwait St | 0.38mi | 3/1.5 | 1,220 (-0%) | 22mo | $180,000 | $148 | 62 |
| 103 Wells Ave | 0.73mi | 3/2.0 | 1,190 (-3%) | 9mo | $220,000 | $185 | 50 |
| 1818 Maxwell Ave | 0.69mi | 3/2.0 | 1,320 (+8%) | 4mo | $275,000 | $208 | 47 |
| 6705 Gary Ave | 0.58mi | 3/1.0 | 1,370 (+12%) | 7mo | $225,000 | $164 | 47 |
| 6625 Hudson St | 0.73mi | 4/2.5 (+1) | 1,140 (-7%) | 1mo | $166,000 | $146 | 43 |
| 6620 Bushey St | 0.74mi | 3/2.0 | 1,392 (+14%) | 6mo | $305,000 | $219 | 33 |
| 6610 Bushey St | 0.70mi | 3/2.0 | 1,376 (+12%) | 17mo | $295,000 | $214 | 28 |
Match score weights: distance 35% · size 25% · config 20% · recency 20%. Top-matched comps best support the ARV.
Projected returns pro-forma
-3.0% appreciation · 1.31% rent growth · sell at horizon
- IRR
- 34.7%
- Equity multiple
- 2.43×
- Total profit
- $38,152
- Equity at exit
- $14,165
- IRR
- 40.6%
- Equity multiple
- 4.51×
- Total profit
- $93,236
- Equity at exit
- $8,214
Cash invested: $26,600 (down + closing). Projections, not guarantees.
Landlord ↔ Tenant lean methodology
- Overall (CITY)
- 12 Strongly Tenant-Friendly
- State Maryland
- 27 Tenant-Leaning · D+14
- County
- — inherits STATE
- City Baltimore
- 12 Strongly Tenant-Friendly · D+58
ZIP-level market 21224
- Rents YoY
- 1.3%
- Active inventory
- 391
- Price-to-rent
- 3.9×
Monthly cashflow live
- Estimated rent
- $2,036 high interval (Pro) →
- Mortgage (P&I)
- −$498
- Tax from tax record
- −$178 /mo · $2,132/yr
- Insurance
- −$40
- HOA
- −$0
- Vacancy / Maint / Mgmt
- −$428
- Net cashflow
- $893
Break-even live
UW: 25.0% down · 7.5% · 30yr · 1.5% tax · 5.0% vac · 8.0% maint · 8.0% mgmt
Financing live
Cash to close
- Down payment
- $23,750
- Closing costs
- $2,850
- Reserves months
- —
- Total cash needed
- —
Loan-product check · same deal, 3 products live
Conventional
25% down · 7.5% · 30yr
- Down + closing
- —
- Monthly P&I
- —
- Monthly cashflow
- —
- DSCR
- —
- Eligible?
- —
Personal DTI + credit; lowest rate.
DSCR
20% down · 8.5% · 30yr
- Down + closing
- —
- Monthly P&I
- —
- Monthly cashflow
- —
- DSCR
- —
- Eligible?
- —
No personal income docs; deal must DSCR.
Hard money
10% down · 12.0% · 12mo
- Down + closing
- —
- Monthly P&I
- —
- Monthly cashflow
- —
- DSCR
- —
- Eligible?
- —
Short-term bridge; refi at stabilization.
Rent comps 40 comps
| Address | Beds | Baths | Sqft | Rent | $/sqft | DOM | Units | Dist |
|---|---|---|---|---|---|---|---|---|
| 1613 Elrino St Baltimore, MD | 2.0 | 1.0 | 700 | $1,350 | $1.93 | 43d | 1 | 0.02mi |
| 1504 Elrino St Baltimore, MD | 2.0 | 2.0 | 1050 | $1,650 | $1.57 | 4d | 1 | 0.16mi |
| 1207 Anglesea St Baltimore, MD | 2.0 | 2.0 | 1162 | $2,150 | $1.85 | 4d | 1 | 0.48mi |
| 6722 Brentwood Ave Unit 2FL Dundalk, MD | 3.0 | 1.0 | 900 | $1,750 | $1.94 | 43d | 1 | 0.65mi |
| 6710 Hudson St Baltimore, MD | 4.0 | 4.0 | 1156 | $3,500 | $3.03 | 24d | 1 | 0.79mi |
| 2125 Cameron Dr Dundalk, MD | 1.0–2.0 | 1.0 | 697 | $1,350 | $1.94 | 43d | 9 | 0.86mi |
| 708 Umbra St Baltimore, MD | 3.0 | 1.5 | 1274 | $2,000 | $1.57 | 17d | 1 | 0.91mi |
| 560 Bayview Blvd Baltimore, MD | 1.0–3.0 | 1.0–3.0 | 1108 | $3,372 | $3.04 | 2d | 25 | 0.93mi |
| 456 Elrino St Unit B Baltimore, MD | 2.0 | 1.0 | 800 | $1,600 | $2.00 | 43d | 1 | 0.95mi |
| 442 Folcroft St Unit A Baltimore, MD | 2.0 | 1.5 | 1071 | $1,600 | $1.49 | 3d | 1 | 0.97mi |
| 434 Folcroft St Unit A Baltimore, MD | 3.0 | 1.5 | 1260 | $1,500 | $1.19 | 43d | 1 | 0.99mi |
| 1533 Leslie Rd Dundalk, MD | 4.0 | 1.0 | 1270 | $2,000 | $1.57 | 43d | 1 | 1.00mi |
| 416 Hornel St Unit 2 Baltimore, MD | 2.0 | 1.0 | 1470 | $1,400 | $0.95 | 24d | 1 | 1.00mi |
| 628 47th St Apt RW2 Baltimore, MD | 2.0 | 1.0 | 750 | $1,200 | $1.60 | 11d | 1 | 1.01mi |
| 630 47th St Unit B Baltimore, MD | 2.0 | 1.0 | 750 | $1,200 | $1.60 | 43d | 1 | 1.01mi |
| 363 Gusryan St Baltimore, MD | 2.0 | 2.0 | 840 | $1,950 | $2.32 | 12d | 1 | 1.05mi |
| 340 Gusryan St Baltimore, MD | 3.0 | 2.0 | 1300 | $2,500 | $1.92 | 43d | 1 | 1.08mi |
| 338 Gusryan St Baltimore, MD | 2.0 | 1.5 | 1218 | $1,700 | $1.40 | 24d | 1 | 1.08mi |
| 334 Kane St Baltimore, MD | 2.0 | 2.0 | 1050 | $1,675 | $1.60 | 24d | 1 | 1.09mi |
| 335 Drew St Unit 1 Baltimore, MD | 2.0 | 1.0 | 1460 | $1,600 | $1.10 | 24d | 1 | 1.09mi |
| 328 Folcroft St Baltimore, MD | 3.0 | 2.0 | 1460 | $2,300 | $1.58 | 24d | 1 | 1.10mi |
| 1955 Walnut Ave Dundalk, MD | 3.0 | 1.0 | 950 | $2,300 | $2.42 | 43d | 1 | 1.11mi |
| 611 Oldham St Baltimore, MD | 2.0 | 1.0 | 1148 | $1,800 | $1.57 | 12d | 1 | 1.12mi |
| 266 Saint Helena Ave Dundalk, MD | 3.0 | 1.0 | 1305 | $1,900 | $1.46 | 12d | 1 | 1.15mi |
| 530 47th St Baltimore, MD | 3.0 | 1.0 | 1424 | $1,750 | $1.23 | 24d | 1 | 1.16mi |
| 6552 Parnell Ave Dundalk, MD | 2.0 | 1.5 | 885 | $1,500 | $1.69 | 17d | 1 | 1.17mi |
| 6905 Bank St Baltimore, MD | 2.0 | 1.5 | 784 | $1,650 | $2.10 | 43d | 1 | 1.17mi |
| 4505 Foster Ave Baltimore, MD | 3.0 | 3.0 | 1376 | $2,650 | $1.93 | 24d | 1 | 1.18mi |
| 3850 Boston St Baltimore, MD | 2.0 | 1.0–2.0 | 854 | $3,378 | $3.96 | 2d | 22 | 1.20mi |
| 6802 Conley St Baltimore, MD | 2.0 | 1.5 | 939 | $1,750 | $1.86 | 22d | 1 | 1.22mi |
| 527 S Lehigh St Baltimore, MD | 3.0 | 2.0 | 1320 | $2,325 | $1.76 | 43d | 1 | 1.23mi |
| 6537 Baltimore Ave Baltimore, MD | 3.0 | 1.0 | 1272 | $1,700 | $1.34 | 2d | 1 | 1.24mi |
| 6545 Baltimore Ave Dundalk, MD | 2.0 | 1.0 | 852 | $1,500 | $1.76 | 43d | 1 | 1.24mi |
| 410 S Newkirk St Baltimore, MD | 2.0 | 1.5 | 1330 | $1,580 | $1.19 | 43d | 1 | 1.27mi |
| 3700 Toone St Baltimore, MD | 1.0–2.0 | 1.0–2.0 | 1093 | $3,218 | $2.94 | 1d | 28 | 1.33mi |
| 12 Leeway Dundalk, MD | 3.0 | 1.0 | 1358 | $1,750 | $1.29 | 43d | 1 | 1.40mi |
| 611 Grundy St Baltimore, MD | 3.0 | 2.0 | 1434 | $2,700 | $1.88 | 24d | 1 | 1.42mi |
| 1200 S Conkling St Baltimore, MD | 1.0–2.0 | 1.0–2.0 | 1085 | $2,933 | $2.70 | 1d | 16 | 1.43mi |
| 7124 Gough St Baltimore, MD | 2.0 | 1.5 | 1096 | $1,700 | $1.55 | 22d | 1 | 1.43mi |
| 502 S Haven St Baltimore, MD | 2.0 | 2.5 | 1440 | $2,400 | $1.67 | 16d | 1 | 1.44mi |
Listing history 10 events
-
2026-06-18days on market $95,000 Active 15 DOM
-
2026-06-17days on market $95,000 Active 14 DOM
-
2026-06-16days on market $95,000 Active 13 DOM
-
2026-06-15days on market $95,000 Active 12 DOM
-
2026-06-13pricedays on market $95,000 Active 10 DOM
-
2026-06-09days on market $115,000 Active 6 DOM
-
2026-06-08days on market $115,000 Active 5 DOM
-
2026-06-07days on market $115,000 Active 4 DOM
-
2026-06-04remarks 542-char remark
-
2026-06-04$115,000 Active 1 DOM
ⓘ Source: listings_history table (triggers on properties + properties_extension) + one-shot
backfill from property_details.listing_events for pre-trigger history.
Tax reassessment forecast MD · Partial reset (capped growth)
- Current annual tax
- $2,132 · $178/mo
- Projected year-2 tax
- $2,132 · $178/mo
- Expected delta
- $0/yr ($0/mo · 0.0%)
ⓘ Screening estimate from a state-policy table — verify with the county assessor before closing.
Climate risk First Street
- Flood 1/10 Low FEMA zone X (unshaded) · 0% chance over 30 yrs
- Wildfire 1/10 Low
- Heat 8/10 Severe 7 d/yr ≥104°F today · 15 d/yr by 30 yrs out
- Wind 6/10 Major 27% chance of damaging wind over 30 yrs
- Air quality 5/10 Major 6 unhealthy d/yr today · 8 by 30 yrs out
Nearby sold comps map
Loading sold comps map…
Walkable amenities ~0.75 mi
Loading nearby amenities…
Taxation est. · year 1
- Rental income
- $24,434
- − Mortgage interest
- −$5,321
- − Property taxes
- −$2,132
- − Insurance
- −$475
- − Repairs & maintenance
- −$1,955
- − Management
- −$1,955
- − Depreciation
- −$2,764
- Taxable income
- $9,833
- Est. tax owed @ 24.0%
- −$2,360
- After-tax cash flow
- $8,358/yr
For passive investors: Depreciation is non-cash, so a rental often shows a tax loss while cash-flowing — sheltering income. Rental losses are passive: they offset passive income freely, and up to $25,000/yr can offset ordinary (W-2) income if you actively participate and your MAGI is under $100k (phasing out to $0 by $150k); unused losses carry forward. On sale, claimed depreciation is recaptured at up to 25%, and gains may owe capital-gains tax (a 1031 exchange can defer both). Figures are a year-1 estimate at your 24.0% rate — not tax advice; consult a CPA.
Schools (NCES district)
- District
- Baltimore City Public Schools
- NCES district ID
- 2400090
- Math proficiency
- 7% ▼ -9.00%
- Reading proficiency
- 16% ▼ -5.00%
- Median HH income
- $42,108
- Composite
- 10.08/100
- National rank
- #9805
- State rank
- #24 of 24 in MD
Livability — Baltimore
- Score
- 76/100
- State rank
- #90
- US rank
- #3396
Category grades
Schools grade is shown separately in the Schools card above.
Census & demographics
- Census place
- Baltimore, MD
- County
- Baltimore City · 558,601 people
- City population
- 588,727
- Metro
- Baltimore-Columbia-Towson, MD
- Population (ZIP)
- 47,465
- Household income
- $89,017
- Rent vs Own
- Severe rent burden
- 1786.0
Population outlook (Baltimore County) Hauer SSP2
- Today (2025)
- 624,249 people
- By 2030
- 621,541 · -0.4%
- By 2040
- 609,756 · -2.3%
- By 2050
- 597,249 · -4.3%
- By 2075
- 552,236 · -11.5%
- By 2100
- 513,934 · -17.7%
Race, ethnicity, and origin ACS 2023
- Neighborhood character
- Diverse neighborhood (Simpson 0.62)
- Race & ethnicity
- White 55% Hispanic / Latino 21% Black 16% Two or more races 7% Asian 4%
- Hispanic origin (detail)
- Mexican 4% Puerto Rican 2% Dominican 1%
- Common ancestry
- Romanian 5% Lithuanian 2% Italian 1%
- Foreign-born
- 17% · Canada, China, Vietnam
- Languages at home
- 76% English-only · Spanish 18% Other Indo-European 2% Russian/Polish/Slavic 1%
Political lean MEDSL · Baltimore
- 2024 margin
- Solid D (+73.0) · D 85.2% · R 12.2% · Other 2.6%
- 2008→2024 swing
- -2.5pp toward R · 2008: 75.5pp · 2024: 73.0pp
- All cycles
- 2024: D+73.0 2020: D+76.6 2016: D+74.6 2012: D+76.4 2008: D+75.5
Not yet ingested
- Civics
- —
Market trends
- HPI YoY
- ▼ -332.23%
- Current HPI
- 241.284
- Rent YoY
- ▲ 1.31%
- Metro
- Baltimore-Columbia-Towson, MD
- State GDP YoY
- ▲ 2.97%
- F500 in state
- 12
Industry mix (Fortune 500 HQ in MD)
| Industry | F500 HQs | Revenue |
|---|---|---|
| Aerospace / Defense | 1 | $71B |
|
||
| Utilities | 1 | $25B |
|
||
| Hotels | 1 | $24B |
|
||
| Consumer Goods | 1 | $7B |
|
||
| Real Estate | 1 | $6B |
|
||
| Chemicals | 1 | $2B |
|
||
Price history
+265.1% since first listed2 events — show timeline
- 2026-06-03 Listed $115,000 BRIGHT MLS
- 1982-01-14 Sold (Public Records) $31,500 Public Records
Property tax history
-0.0%/yrLatest (2025): $2,132 · +4.8% YoY. Source: county tax records.
Cash-flow waterfall
monthlySold comps — $/sqft
last 12 mo · ≤1 miLoading sold comps…