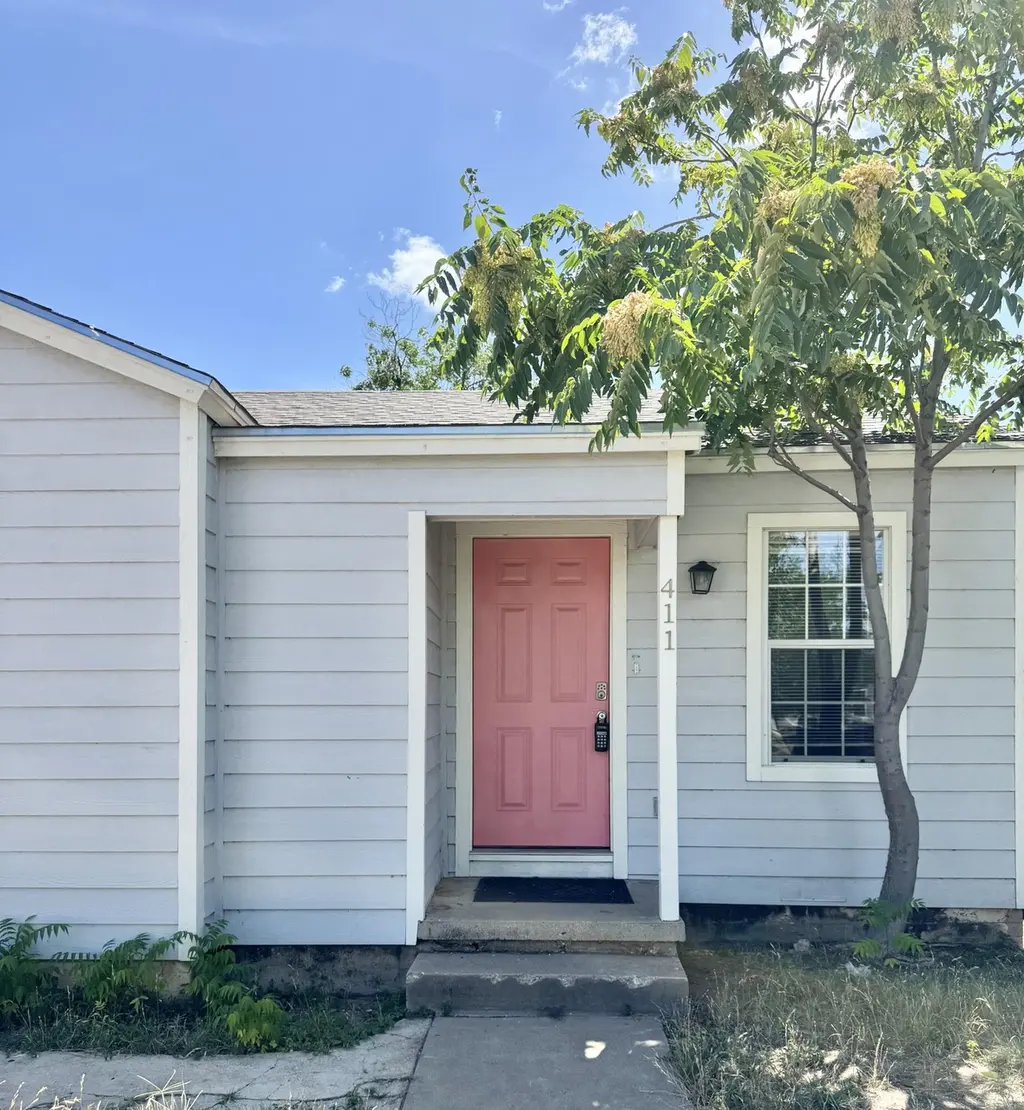
411 S Parkway St · San Angelo, TX
Flood risk 1/10 · Minimal
- FEMA flood zone
- X (unshaded)
- Chance of flooding over 30 yrs
- 0.0%
- Est. flood insurance / yr
- $507 – $1,088
Fire risk 6/10 · Moderate
- Est. fire insurance / yr
- $1,222 – $2,270
Heat risk 7/10 · Major
- Hot days now (above 104°F)
- 7 days/yr
- Hot days in 30 yrs
- 23 days/yr
Wind risk 4/10 · Minor
- Chance of severe wind over 30 yrs
- 12.0%
Air-quality risk 1/10 · Minimal
- Unhealthy air days now
- 0 days/yr
- Unhealthy air days in 30 yrs
- 0 days/yr
Risk factors via First Street. Map © Google.
Why this score? — see what drove the C grade
The composite is a weighted blend of 9 inputs, each scored 0–100. Each bar is that input's sub-score; the figure is the points it added to the 100-point composite (weight × sub-score).
- Cash flow +17.1/30.0
- Appreciation +10.0/10.0
- ARV discount +7.9/15.0
- DSCR +5.3/10.0
- 1% rule +4.9/10.0
- Rent growth +3.9/5.0
- Livability +3.7/5.0
- Schools +2.6/10.0
- Condition / age +2.5/5.0
$115,000
🖨 Deal sheet (PDF) 📄 Offer letter ✓ Due diligence
Listing remarks MLS
INVESTORS ONLY!! Cute starter home or investment property in nice neighborhood. Remodeled in 2005. CH/CA Appr. 2 years old. Has plantation style blinds that convey. Ceramic tile in kitchen and bathroom. Separate Fenced Large Back Yard. Lots of outside Storage.
Key facts
- Spacious yard
- New siding
- Remodeled bathroom
Tags
Neighborhood map
What this means for you Summary
Snapshot
- This is a 2-bed/1.0-bath single-family listed at $115k.
Deal economics
- At list price, monthly cash flow is $80 ($958/yr) — positive.
- The deal already cash-flows at list — no discount required.
- To meet the 1% rule (rent ≥ 1% of price), the offer needs to be $113k (1.4% below list).
- Recommended offer: $113k (1.4% below list) — sets the bar for 1% rule.
Location & tenants
- Location reads 73/100 on livability (#199 in TX) — a middle-class / working-renter tenant base. Strengths: cost of living A+, housing A+, health & safety A+; Watch: employment C-, amenities F, commute F.
- San Angelo ISD (urban): math 27% / reading 33% proficiency, ranked #627 of 826 in TX (top 76%) — families likely to look elsewhere, expect single-tenant / working-renter base with shorter leases.
- Zoned schools: Mcgill El (math 42% / reading 42%, grade F, #1,335 of 4,322 statewide, top 33%, 306 students, 79% FRL); Lone Star Middle (math 28% / reading 32%, grade F, #1,056 of 1,662 statewide, top 65%, 903 students, 63% FRL); Central H S (math 22% / reading 43%, grade F, #1,029 of 1,632 statewide, top 64%, 3,065 students, 48% FRL).
- Market conditions: Rents rising fast (+5.8%/yr); 334 active listings in the ZIP; 7 comparable units currently listed for rent nearby; rentals at typical pace (median 23d on market — plan ~3-4 weeks tenant-placement turnaround); 43% of comp listings sitting > 30 days — soft ceiling on asking rent; 233 units permitted in Tom Green County in 2024 (0 in 5+ unit buildings).
Forward outlook
- In year one you build about $12k of equity ($795 loan paydown + $12k appreciation (10.0% local appreciation)).
- Tom Green County population projected at +35% by 2050 — long-run rental-demand tailwind backs the buy-and-hold thesis.
- At projected returns (10.0% appreciation + 5.8% rent growth), your $32k cash investment doubles in ~3 years — after that, you're playing with house money.
- By year 3, paydown + projected appreciation supports a ~$31k cash-out refi (75% LTV) — recoverable capital for the next deal without selling this one.
Negotiation context
- Only 3 days on market — expect competitive offers; lowballing is unlikely to land.
- 4 sale attempts since 19y ago with the ask held roughly flat each time — persistent listings suggest the price (not the market) is what's stuck; bring a comps-based counter.
- Current owner paid $70k; list at $115k implies a 65% gain — meaningful room to come down on a strong offer.
Risks & watch-outs
- Watch-outs: built in 1959 — expect roof / HVAC / electrical / plumbing capex.
- Climate carrying-cost: major wildfire risk; extreme-heat days projected 7→23/yr by 2055 (HVAC capex compounding) — expect insurance premiums to compound above CPI over the hold.
Questions for the listing agent
- Built in 1959 — when were the roof, HVAC, electrical panel, plumbing, and water heater last replaced?
- Is there a deadline driving the sale (1031 exchange, divorce, estate, relocation)? That informs how much negotiation room exists.
- Schools are F-rated, which usually means shorter tenancies and higher turnover. Who's the typical renter profile here, and what's been the actual vacancy rate?
- What's the average days-on-market for RENTAL listings here right now (not sales)? A rising rental-DOM trend means longer vacancies and softer asking-rent achievability than the comps imply.
- What's the recent tenant-quality profile in this submarket — average credit score on applications, eviction rate, late-payment / NSF rate, and stable-employment percentage? A property-management company in the area should have these aggregated.
- How much new for-sale + rental construction is in the pipeline within 1–3 miles? Heavy new supply typically softens prices + rents 12–24 months out; constrained supply supports both.
Investment metrics
- 1% rule
- 0.99% ✗
- Cap rate
- 7.13%
- Cash-on-cash
- 2.97%
- DSCR
- 1.13
- GRM
- 8.5
CMA / ARV
- ARV (on-the-fly)
- $116,064
- Comps found
- 11
Show comp detail 11 sales within ~0.75 mi
| Address | Dist | Beds/Ba | Sqft | Sold | Price | $/sf | Match |
|---|---|---|---|---|---|---|---|
| 18 N Jackson St | 0.40mi | 2/1.0 | 728 (-2%) | 3mo | $85,000 | $117 | 75 |
| 1822 Martin St | 0.36mi | 2/1.0 | 730 (-2%) | 14mo | $129,700 | $178 | 68 |
| 319 N Howard St | 0.08mi | 2/1.0 | 852 (+14%) | 8mo | $155,000 | $182 | 66 |
| 2326 Guadalupe St | 0.29mi | 2/2.0 | 768 (+3%) | 17mo | $124,900 | $163 | 63 |
| 2526 Chestnut St | 0.50mi | 2/1.0 | 810 (+9%) | 2mo | $115,000 | $142 | 60 |
| 2030 Lindell Ave | 0.73mi | 2/1.0 | 776 (+4%) | 10mo | $87,500 | $113 | 50 |
| 2314 W Concho Ave | 0.64mi | 2/1.0 | 785 (+6%) | 15mo | $85,000 | $108 | 48 |
| 2430 San Antonio St | 0.42mi | 2/1.0 | 843 (+13%) | 13mo | $149,900 | $178 | 47 |
| 802 N Bishop St | 0.63mi | 2/1.0 | 840 (+13%) | 4mo | $94,900 | $113 | 46 |
| 1853 Twohig Ave | 0.55mi | 2/1.0 | 832 (+12%) | 14mo | $129,900 | $156 | 43 |
| 1315 Evans St | 0.67mi | 2/1.0 | 828 (+11%) | 24mo | $147,500 | $178 | 30 |
Match score weights: distance 35% · size 25% · config 20% · recency 20%. Top-matched comps best support the ARV.
Projected returns pro-forma
10.0% appreciation · 5.78% rent growth · sell at horizon
- IRR
- 27.5%
- Equity multiple
- 3.21×
- Total profit
- $71,005
- Equity at exit
- $103,601
- IRR
- 24.8%
- Equity multiple
- 7.60×
- Total profit
- $212,559
- Equity at exit
- $223,420
Cash invested: $32,200 (down + closing). Projections, not guarantees.
Landlord ↔ Tenant lean methodology
- Overall (STATE)
- 87 Strongly Landlord-Friendly
- State Texas
- 87 Strongly Landlord-Friendly · R+5
- County
- — inherits STATE
- City
- — inherits STATE
ZIP-level market 76901
- Home prices YoY
- 6.4%
- Rents YoY
- 5.8%
- Active inventory
- 334
- Price-to-rent
- 8.5×
Monthly cashflow live
- Estimated rent
- $1,134 high interval (Pro) →
- Mortgage (P&I)
- −$603
- Tax from tax record
- −$165 /mo · $1,978/yr
- Insurance
- −$48
- HOA
- −$0
- Vacancy / Maint / Mgmt
- −$238
- Net cashflow
- $80
Break-even live
Sensitivity live
| Price | -10% $145 | -5% $112 | +0% $80 | +5% $47 | +10% $15 |
|---|---|---|---|---|---|
| Rent | -10% $-10 | -5% $35 | +0% $80 | +5% $125 | +10% $169 |
| Rate | -1.0pp $138 | -0.5pp $109 | base $80 | +0.5pp $50 | +1.0pp $20 |
UW: 25.0% down · 7.5% · 30yr · 1.5% tax · 5.0% vac · 8.0% maint · 8.0% mgmt
Financing live
Cash to close
- Down payment
- $28,750
- Closing costs
- $3,450
- Reserves months
- —
- Total cash needed
- —
Loan-product check · same deal, 3 products live
Conventional
25% down · 7.5% · 30yr
- Down + closing
- —
- Monthly P&I
- —
- Monthly cashflow
- —
- DSCR
- —
- Eligible?
- —
Personal DTI + credit; lowest rate.
DSCR
20% down · 8.5% · 30yr
- Down + closing
- —
- Monthly P&I
- —
- Monthly cashflow
- —
- DSCR
- —
- Eligible?
- —
No personal income docs; deal must DSCR.
Hard money
10% down · 12.0% · 12mo
- Down + closing
- —
- Monthly P&I
- —
- Monthly cashflow
- —
- DSCR
- —
- Eligible?
- —
Short-term bridge; refi at stabilization.
Rent comps 7 comps
| Address | Beds | Baths | Sqft | Rent | $/sqft | DOM | Units | Dist |
|---|---|---|---|---|---|---|---|---|
| 121 N Van Buren St Unit A San Angelo, TX | 2.0 | 1.0 | 715 | $1,095 | $1.53 | 23d | 1 | 0.31mi |
| 2065 Live Oak St San Angelo, TX | 2.0 | 1.0 | 720 | $950 | $1.32 | 45d | 1 | 0.67mi |
| 1929 Raney St San Angelo, TX | 1.0–2.0 | 1.0–2.0 | 765 | $1,000 | $1.31 | 23d | 4 | 0.94mi |
| 1818 S Lincoln St San Angelo, TX | 2.0 | 1.0–2.0 | 555 | $1,199 | $2.16 | 23d | 19 | 1.05mi |
| 1818 S Harrison St San Angelo, TX | 1.0 | 1.0 | 500 | $780 | $1.56 | 45d | 1 | 1.10mi |
| 3130 W Beauregard Ave San Angelo, TX | 1.0–2.0 | 1.0 | 690 | $875 | $1.27 | 23d | 1 | 1.17mi |
| 3433 Arden Rd Unit 405 San Angelo, TX | 1.0 | 1.0 | 500 | $850 | $1.70 | 45d | 1 | 1.28mi |
Listing history 13 events
-
2026-04-17status Pending
-
2026-04-14$115,000 Active
-
2025-07-08historical $1,075
-
2025-07-01$1,075
-
2025-07-01historical $1,075
-
2025-06-25$1,075
-
2015-02-17soldstatus
-
2014-07-11soldstatus
-
2011-03-10soldstatus $69,500
-
2007-12-04soldstatus
-
2007-08-15soldstatus 262-char remark
Show marketing remark (262 chars)
INVESTORS ONLY!! Cute starter home or investment property in nice neighborhood. Remodeled in 2005. CH/CA Appr. 2 years old. Has plantation style blinds that convey. Ceramic tile in kitchen and bathroom. Separate Fenced Large Back Yard. Lots of outside Storage.
-
2007-02-01$65,000 262-char remark
Show marketing remark (262 chars)
INVESTORS ONLY!! Cute starter home or investment property in nice neighborhood. Remodeled in 2005. CH/CA Appr. 2 years old. Has plantation style blinds that convey. Ceramic tile in kitchen and bathroom. Separate Fenced Large Back Yard. Lots of outside Storage.
-
2005-05-23soldstatus
ⓘ Source: listings_history table (triggers on properties + properties_extension) + one-shot
backfill from property_details.listing_events for pre-trigger history.
Tax reassessment forecast TX · Resets to sale price
- Current annual tax
- $1,978 · $165/mo
- Projected year-2 tax
- $2,104 · $175/mo
- Expected delta
- +$127/yr (+$11/mo · 6.4%)
ⓘ Screening estimate from a state-policy table — verify with the county assessor before closing.
Climate risk First Street
- Flood 1/10 Low FEMA zone X (unshaded) · 0% chance over 30 yrs
- Wildfire 6/10 Major
- Heat 7/10 Severe 7 d/yr ≥104°F today · 23 d/yr by 30 yrs out
- Wind 4/10 Moderate 12% chance of damaging wind over 30 yrs
- Air quality 1/10 Low 0 unhealthy d/yr today · 0 by 30 yrs out
Nearby sold comps map
Loading sold comps map…
Walkable amenities ~0.75 mi
Loading nearby amenities…
Taxation est. · year 1
- Rental income
- $13,604
- − Mortgage interest
- −$6,442
- − Property taxes
- −$1,978
- − Insurance
- −$575
- − Repairs & maintenance
- −$1,088
- − Management
- −$1,088
- − Depreciation
- −$3,345
- Taxable loss
- −$912
- Est. tax savings @ 24.0%
- +$219
- After-tax cash flow
- $1,177/yr
For passive investors: Depreciation is non-cash, so a rental often shows a tax loss while cash-flowing — sheltering income. Rental losses are passive: they offset passive income freely, and up to $25,000/yr can offset ordinary (W-2) income if you actively participate and your MAGI is under $100k (phasing out to $0 by $150k); unused losses carry forward. On sale, claimed depreciation is recaptured at up to 25%, and gains may owe capital-gains tax (a 1031 exchange can defer both). Figures are a year-1 estimate at your 24.0% rate — not tax advice; consult a CPA.
Schools (NCES district)
- District
- San Angelo ISD
- NCES district ID
- 4838700
- Math proficiency
- 27% ▼ -9.00%
- Reading proficiency
- 33% ▼ -3.00%
- Median HH income
- $43,501
- Composite
- 25.56/100
- National rank
- #7427
- State rank
- #627 of 826 in TX
Livability — San Angelo
- Score
- 73/100
- State rank
- #199
- US rank
- #5030
Category grades
Schools grade is shown separately in the Schools card above.
Census & demographics
- Census place
- San Angelo, TX
- County
- Tom Green County · 113,188 people
- City population
- 81,357
- Metro
- San Angelo, TX
- Population (ZIP)
- 31,831
- Household income
- $69,450
- Rent vs Own
- Severe rent burden
- 1034.0
Population outlook (Tom Green County) Hauer SSP2
- Today (2025)
- 135,110 people
- By 2030
- 144,090 · +6.6%
- By 2040
- 162,561 · +20.3%
- By 2050
- 182,158 · +34.8%
- By 2075
- 232,274 · +71.9%
- By 2100
- 268,218 · +98.5%
Race, ethnicity, and origin ACS 2023
- Neighborhood character
- Majority White (55%)
- Race & ethnicity
- White 55% Hispanic / Latino 41% Two or more races 17% Black 2%
- Hispanic origin (detail)
- Mexican 38%
- Common ancestry
- Lithuanian 3% Slovak 3% Iranian 1%
- Foreign-born
- 5% · Canada
- Languages at home
- 77% English-only · Spanish 21% German/W. Germanic 1%
Political lean MEDSL · Tom Green
- 2024 margin
- Solid R (+48.0) · D 25.5% · R 73.5% · Other 1.0%
- 2008→2024 swing
- -6.3pp toward R · 2008: -41.7pp · 2024: -48.0pp
- All cycles
- 2024: R+48.0 2020: R+44.4 2016: R+47.9 2012: R+47.9 2008: R+41.7
Not yet ingested
- Civics
- —
Market trends
- HPI YoY
- ▲ 47.96%
- Current HPI
- 798.58
- Rent YoY
- ▲ 5.78%
- Metro
- San Angelo, TX
- State GDP YoY
- ▲ 3.95%
- F500 in state
- 110
Industry mix (Fortune 500 HQ in TX)
| Industry | F500 HQs | Revenue |
|---|---|---|
| Energy | 16 | $1,198B |
|
||
| Technology | 5 | $198B |
|
||
| Engineering / Construction | 4 | $72B |
|
||
| Energy Services | 3 | $60B |
|
||
| Utilities | 3 | $41B |
|
||
| Healthcare | 2 | $330B |
|
||
Price history
+76.9% since first listed13 events — show timeline
- 2026-04-17 Pending — SAAR TX
- 2026-04-14 Listed $115,000 SAAR TX
- 2025-07-08 Rental Removed $1,075 TENANTTURNER2
- 2025-07-01 Listed for Rent $1,075 TENANTTURNER2
- 2025-07-01 Rental Removed $1,075 APPFOLIO
- 2025-06-25 Listed for Rent $1,075 APPFOLIO
- 2015-02-17 Sold (Public Records) — Public Records
- 2014-07-11 Sold (Public Records) — Public Records
- 2011-03-10 Sold (Public Records) $69,500 Public Records
- 2007-12-04 Sold (Public Records) — Public Records
- 2007-08-15 Sold (MLS) — SAAR TX
- 2007-02-01 Listed $65,000 SAAR TX
- 2005-05-23 Sold (Public Records) — Public Records
Property tax history
+2.2%/yrLatest (2025): $1,978 · +22.3% YoY. Source: county tax records.
Cash-flow waterfall
monthlySold comps — $/sqft
last 12 mo · ≤1 miLoading sold comps…