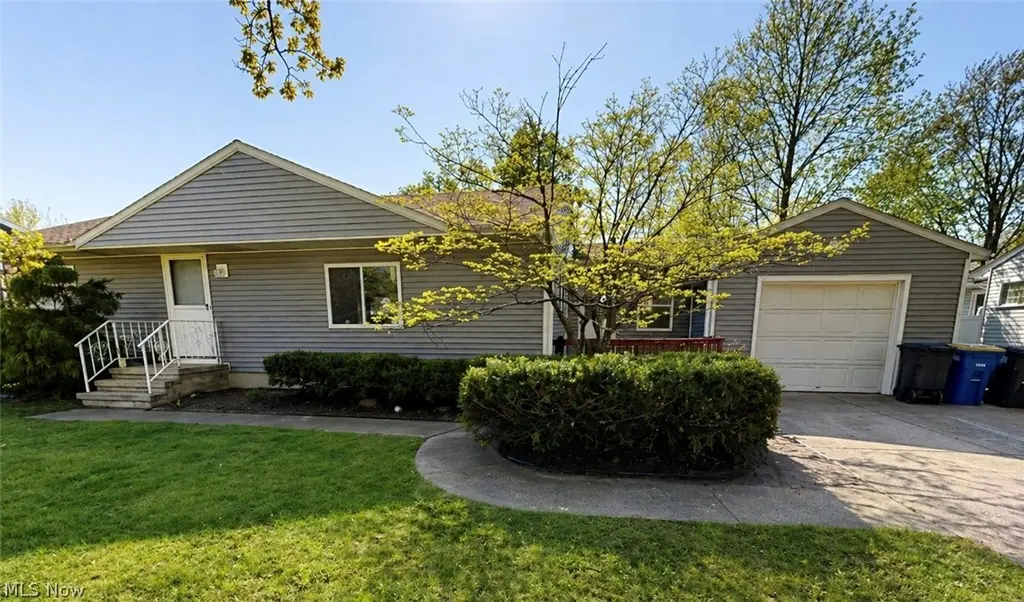
1015 Westshore Dr · Ashtabula, OH
Flood risk 1/10 · Minimal
- FEMA flood zone
- X (unshaded)
- Chance of flooding over 30 yrs
- 0.0%
- Est. flood insurance / yr
- $473 – $860
Fire risk 1/10 · Minimal
- Est. fire insurance / yr
- $713 – $1,323
Heat risk 3/10 · Minor
- Hot days now (above 93°F)
- 7 days/yr
- Hot days in 30 yrs
- 17 days/yr
Wind risk 1/10 · Minimal
- Chance of severe wind over 30 yrs
- —
Air-quality risk 3/10 · Minor
- Unhealthy air days now
- 2 days/yr
- Unhealthy air days in 30 yrs
- 5 days/yr
Risk factors via First Street. Map © Google.
Why this score? — see what drove the B- grade
The composite is a weighted blend of 9 inputs, each scored 0–100. Each bar is that input's sub-score; the figure is the points it added to the 100-point composite (weight × sub-score).
- Cash flow +30.0/30.0
- 1% rule +10.0/10.0
- DSCR +10.0/10.0
- ARV discount +6.5/15.0
- Livability +3.6/5.0
- Rent growth +2.5/5.0
- Condition / age +2.5/5.0
- Schools +2.4/10.0
- Appreciation +0.0/10.0
$174,900
🖨 Deal sheet 📄 Offer letter ✓ Due diligence
Listing remarks MLS
Lovely Ranch In Harbor Area Of Fine Homes. Great Nieghborhood To Raise A Family. Roomy, Possible Recroom In The Basement
Key facts
- New siding
- Remodeled bathroom
- Full basement
Tags
Property features AI
Finance
- Financial info: Annual taxes listed
Exterior
- Parking: Attached garage (1 car)
- Utilities: Public water; Public sewer
- Home design: Single-story home; Vinyl siding; Asphalt/fiberglass roof; Home warranty included; Approximately 1,000 above-grade finished square feet; Lot about 0.24 acres
- Construction: Vinyl siding construction; Asphalt/fiberglass roof
- Exterior features: Full fenced yard
Interior
- Kitchen: Range; Refrigerator
- Bedrooms: Three main-level bedrooms
- Bathrooms: One full bathroom on the main level
- Heating & cooling: Baseboard heating
- Interior features: Updated/remodeled condition; Full basement
- Laundry & utility: Washer; Dryer
Neighborhood map
What this means for you Summary
Snapshot
- This is a 3-bed/1.0-bath single-family listed at $175k.
Deal economics
- At list price, monthly cash flow is $2k ($21k/yr) — positive.
- The deal already cash-flows at list — no discount required.
- Meets the 1% rule at list price ($4k rent vs $175k).
- Cap rate 18.6% vs local median 8.2% in Ashtabula — top-decile yield for the area; either an underpriced asset or a hidden risk that comps aren't pricing in. Stress-test before assuming the spread holds.
Location & tenants
- Location reads 71/100 on livability (#420 in OH) — a middle-class / working-renter tenant base. Strengths: cost of living A+, health & safety A+, housing A; Watch: schools C-, amenities F, commute F.
- Ashtabula Area City (town): math 24% / reading 35% proficiency, ranked #588 of 656 in OH (top 90%) — low school quality limits family demand, transient renter base, plan for 1-2y turnover; 63% free/reduced lunch — lower-income household profile, screen leases tightly.
- Market conditions: 162 active listings in the ZIP; 2 comparable units currently listed for rent nearby; 155 units permitted in Ashtabula County in 2024 (0 in 5+ unit buildings).
- At $3,761/mo this rent would consume 91% of the median local household income ($50k/yr) — very limited rent-growth headroom before tenants either downsize or default.
Forward outlook
- Local home prices are declining (-3.0%/yr); year-one equity from $1k of loan paydown is wiped out by about $5k of value loss. Plan a longer hold.
- Ashtabula County population projected at -22% by 2050 — secular population decline; favor cash flow + early exit over multi-decade hold.
- At projected returns (-3.0% appreciation + 3.0% rent growth), your $49k cash investment doubles in ~3 years — after that, you're playing with house money.
Negotiation context
- Only 2 days on market — expect competitive offers; lowballing is unlikely to land.
- 3 sale attempts since 29y ago with the ask held roughly flat each time — persistent listings suggest the price (not the market) is what's stuck; bring a comps-based counter.
Risks & watch-outs
- Watch-outs: built in 1955 — expect roof / HVAC / electrical / plumbing capex.
Questions for the listing agent
- Built in 1955 — when were the roof, HVAC, electrical panel, plumbing, and water heater last replaced?
- Is there a deadline driving the sale (1031 exchange, divorce, estate, relocation)? That informs how much negotiation room exists.
- What's the average days-on-market for RENTAL listings here right now (not sales)? A rising rental-DOM trend means longer vacancies and softer asking-rent achievability than the comps imply.
- What's the recent tenant-quality profile in this submarket — average credit score on applications, eviction rate, late-payment / NSF rate, and stable-employment percentage? A property-management company in the area should have these aggregated.
- How much new for-sale + rental construction is in the pipeline within 1–3 miles? Heavy new supply typically softens prices + rents 12–24 months out; constrained supply supports both.
Investment metrics
- 1% rule
- 2.15% ✓
- Cap rate
- 18.56%
- Cash-on-cash
- 43.81%
- DSCR
- 2.95
- GRM
- 3.9
CMA / ARV
- ARV (median comp)
- $171,151
- List price
- $174,900
- Delta
- 2.19%
- Verdict
- FAIR
- Comps
- 20 within 1.0 mi
Show comp detail 12 sales within ~0.75 mi
| Address | Dist | Beds/Ba | Sqft | Sold | Price | $/sf | Match |
|---|---|---|---|---|---|---|---|
| 1010 Brown Dr | 0.04mi | 3/1.0 | 1,008 (+1%) | 3mo | $150,000 | $149 | 95 |
| 1030 Meadowlane Dr | 0.10mi | 3/2.0 | 1,056 (+6%) | 7mo | $180,000 | $170 | 76 |
| 809 Norman Ave | 0.42mi | 2/1.0 (-1) | 976 (-2%) | 8mo | $164,000 | $168 | 65 |
| 1715 Pleasantview Ave | 0.59mi | 3/2.0 | 1,040 (+4%) | 3mo | $170,000 | $163 | 60 |
| 2521 W 16th St | 0.52mi | 3/1.0 | 1,056 (+6%) | 9mo | $180,000 | $170 | 59 |
| 710 Myrtle Ave | 0.66mi | 2/1.0 (-1) | 992 (-1%) | 5mo | $105,000 | $106 | 59 |
| 1421 Norwood Dr | 0.35mi | 4/1.0 (+1) | 1,142 (+14%) | 1mo | $160,000 | $140 | 54 |
| 2543 Burlingham Dr | 0.25mi | 3/2.0 | 1,150 (+15%) | 7mo | $170,000 | $148 | 53 |
| 3715 Atlantic Ave | 0.65mi | 2/1.0 (-1) | 948 (-5%) | 4mo | $160,000 | $169 | 52 |
| 2132 W 13th St | 0.58mi | 3/1.5 | 1,110 (+11%) | 9mo | $160,000 | $144 | 45 |
| 612 Thayer Ave | 0.75mi | 3/1.5 | 1,104 (+10%) | 1mo | $158,000 | $143 | 45 |
| 2804 Carpenter Rd | 0.67mi | 2/1.0 (-1) | 1,101 (+10%) | 8mo | $108,000 | $98 | 40 |
Match score weights: distance 35% · size 25% · config 20% · recency 20%. Top-matched comps best support the ARV.
Projected returns pro-forma
-3.0% appreciation · 3.0% rent growth · sell at horizon
- IRR
- 40.7%
- Equity multiple
- 2.75×
- Total profit
- $85,581
- Equity at exit
- $26,078
- IRR
- 47.0%
- Equity multiple
- 5.52×
- Total profit
- $221,329
- Equity at exit
- $15,122
Cash invested: $48,972 (down + closing). Projections, not guarantees.
Landlord ↔ Tenant lean methodology
- Overall (STATE)
- 73 Landlord-Friendly
- State Ohio
- 73 Landlord-Friendly · R+6
- County
- — inherits STATE
- City
- — inherits STATE
ZIP-level market 44004
- Home prices YoY
- -30.5%
- Active inventory
- 162
- Price-to-rent
- 3.9×
Monthly cashflow live
- Estimated rent
- $3,761 medium interval (Pro) →
- Mortgage (P&I)
- −$917
- Tax from tax record
- −$193 /mo · $2,320/yr
- Insurance
- −$73
- HOA
- −$0
- Vacancy / Maint / Mgmt
- −$790
- Net cashflow
- $1,788
Break-even live
UW: 25.0% down · 7.5% · 30yr · 1.5% tax · 5.0% vac · 8.0% maint · 8.0% mgmt
Financing live
Cash to close
- Down payment
- $43,725
- Closing costs
- $5,247
- Reserves months
- —
- Total cash needed
- —
Loan-product check · same deal, 3 products live
Conventional
25% down · 7.5% · 30yr
- Down + closing
- —
- Monthly P&I
- —
- Monthly cashflow
- —
- DSCR
- —
- Eligible?
- —
Personal DTI + credit; lowest rate.
DSCR
20% down · 8.5% · 30yr
- Down + closing
- —
- Monthly P&I
- —
- Monthly cashflow
- —
- DSCR
- —
- Eligible?
- —
No personal income docs; deal must DSCR.
Hard money
10% down · 12.0% · 12mo
- Down + closing
- —
- Monthly P&I
- —
- Monthly cashflow
- —
- DSCR
- —
- Eligible?
- —
Short-term bridge; refi at stabilization.
Rent comps 2 comps
| Address | Beds | Baths | Sqft | Rent | $/sqft | DOM | Units | Dist |
|---|---|---|---|---|---|---|---|---|
| 1036 Union Ave Unit 1496086P Ashtabula, OH | 3.0 | 1.0 | 1496 | $5,341 | $3.57 | 43d | 1 | 0.35mi |
| 1115 Myrtle Ave Ashtabula, OH | 3.0 | 1.5 | 1184 | $1,600 | $1.35 | 43d | 1 | 0.60mi |
Listing history 10 events
-
2026-05-04status Pending 604-char remark
-
2026-05-01$174,900 Active 604-char remark
-
2001-09-28soldstatus $84,700 120-char remark
Show marketing remark (120 chars)
Lovely Ranch In Harbor Area Of Fine Homes. Great Nieghborhood To Raise A Family. Roomy, Possible Recroom In The Basement
-
2001-09-26soldstatus $84,700
-
2001-06-30historical 120-char remark
Show marketing remark (120 chars)
Lovely Ranch In Harbor Area Of Fine Homes. Great Nieghborhood To Raise A Family. Roomy, Possible Recroom In The Basement
-
2000-04-19$86,500 120-char remark
Show marketing remark (120 chars)
Lovely Ranch In Harbor Area Of Fine Homes. Great Nieghborhood To Raise A Family. Roomy, Possible Recroom In The Basement
-
1998-04-01soldstatus $76,400
Show marketing remark (195 chars)
Move In Condition - Dry Basement. Tastefully Decorated Great Neighborhood Close To Schools, Art Center And Kent. Has Bonus Room For Dining Rm - Family Rm Located Off Deck And Kitchen. A Must See!
-
1998-04-01soldstatus $76,400
Show marketing remark (195 chars)
Move In Condition - Dry Basement. Tastefully Decorated Great Neighborhood Close To Schools, Art Center And Kent. Has Bonus Room For Dining Rm - Family Rm Located Off Deck And Kitchen. A Must See!
-
1998-03-01historical
Show marketing remark (195 chars)
Move In Condition - Dry Basement. Tastefully Decorated Great Neighborhood Close To Schools, Art Center And Kent. Has Bonus Room For Dining Rm - Family Rm Located Off Deck And Kitchen. A Must See!
-
1997-05-05$79,999
Show marketing remark (195 chars)
Move In Condition - Dry Basement. Tastefully Decorated Great Neighborhood Close To Schools, Art Center And Kent. Has Bonus Room For Dining Rm - Family Rm Located Off Deck And Kitchen. A Must See!
ⓘ Source: listings_history table (triggers on properties + properties_extension) + one-shot
backfill from property_details.listing_events for pre-trigger history.
Tax reassessment forecast OH · Partial reset (capped growth)
- Current annual tax
- $2,320 · $193/mo
- Projected year-2 tax
- $2,524 · $210/mo
- Expected delta
- +$204/yr (+$17/mo · 8.8%)
ⓘ Screening estimate from a state-policy table — verify with the county assessor before closing.
Climate risk First Street
- Flood 1/10 Low FEMA zone X (unshaded) · 0% chance over 30 yrs
- Wildfire 1/10 Low
- Heat 3/10 Moderate 7 d/yr ≥93°F today · 17 d/yr by 30 yrs out
- Wind 1/10 Low
- Air quality 3/10 Moderate 2 unhealthy d/yr today · 5 by 30 yrs out
Nearby sold comps map
Loading sold comps map…
Walkable amenities ~0.75 mi
Loading nearby amenities…
Taxation est. · year 1
- Rental income
- $45,136
- − Mortgage interest
- −$9,797
- − Property taxes
- −$2,320
- − Insurance
- −$874
- − Repairs & maintenance
- −$3,611
- − Management
- −$3,611
- − Depreciation
- −$5,088
- Taxable income
- $19,834
- Est. tax owed @ 24.0%
- −$4,760
- After-tax cash flow
- $16,696/yr
For passive investors: Depreciation is non-cash, so a rental often shows a tax loss while cash-flowing — sheltering income. Rental losses are passive: they offset passive income freely, and up to $25,000/yr can offset ordinary (W-2) income if you actively participate and your MAGI is under $100k (phasing out to $0 by $150k); unused losses carry forward. On sale, claimed depreciation is recaptured at up to 25%, and gains may owe capital-gains tax (a 1031 exchange can defer both). Figures are a year-1 estimate at your 24.0% rate — not tax advice; consult a CPA.
Schools (NCES district)
- District
- Ashtabula Area City
- NCES district ID
- 3904351
- Math proficiency
- 24% ▼ -27.00%
- Reading proficiency
- 35% ▼ -13.00%
- Median HH income
- $34,812
- Composite
- 24.3/100
- National rank
- #7712
- State rank
- #588 of 656 in OH
Livability — Ashtabula
- Score
- 71/100
- State rank
- #420
- US rank
- #6883
Category grades
Schools grade is shown separately in the Schools card above.
Census & demographics
- Census place
- Ashtabula, OH
- County
- Ashtabula · 97,617 people
- City population
- 31,076
- Metro
- Cleveland, OH
- Population (ZIP)
- 31,076
- Household income
- $49,507
- Rent vs Own
- Severe rent burden
- 14.1
Population outlook (Ashtabula County) Hauer SSP2
- Today (2025)
- 92,950 people
- By 2030
- 89,146 · -4.1%
- By 2040
- 80,715 · -13.2%
- By 2050
- 72,270 · -22.2%
- By 2075
- 55,780 · -40.0%
- By 2100
- 40,928 · -56.0%
Race, ethnicity, and origin ACS 2023
- Neighborhood character
- Predominantly White (79%)
- Race & ethnicity
- White 79% Hispanic / Latino 9% Two or more races 7% Black 6%
- Hispanic origin (detail)
- Mexican 3% Puerto Rican 5%
- Common ancestry
- Romanian 4% Iranian 2% Slovak 1%
- Foreign-born
- 3% · Canada
- Languages at home
- 94% English-only · Spanish 4%
Political lean MEDSL · Ashtabula
- 2024 margin
- Strong R (+28.4) · D 35.4% · R 63.8%
- 2008→2024 swing
- -41.9pp toward R · 2008: 13.5pp · 2024: -28.4pp
- All cycles
- 2024: R+28.4 2020: R+23.5 2016: R+19.0 2012: D+12.1 2008: D+13.5
Not yet ingested
- Civics
- —
Market trends
- HPI YoY
- ▼ -114.51%
- Current HPI
- 260.7146
- Rent YoY
- —
- Metro
- —
- State GDP YoY
- ▲ 1.98%
- F500 in state
- 48
Industry mix (Fortune 500 HQ in OH)
| Industry | F500 HQs | Revenue |
|---|---|---|
| Insurance | 3 | $145B |
|
||
| Industrial Machinery | 3 | $49B |
|
||
| Financial Services | 3 | $24B |
|
||
| Consumer Goods | 2 | $93B |
|
||
| Aerospace / Defense | 2 | $47B |
|
||
| Utilities | 2 | $33B |
|
||
Price history
+106.3% since first listed11 events — show timeline
- 2026-06-12 Sold (MLS) $165,000 MLSNOW
- 2026-05-04 Pending — MLSNOW
- 2026-05-01 Listed $174,900 MLSNOW
- 2001-09-28 Sold (MLS) $84,700 MLSNOW
- 2001-09-26 Sold (Public Records) $84,700 Public Records
- 2001-06-30 Listing Removed — MLSNOW
- 2000-04-19 Listed $86,500 MLSNOW
- 1998-04-01 Sold (Public Records) $76,400 Public Records
- 1998-04-01 Sold (MLS) $76,400 MLSNOW
- 1998-03-01 Listing Removed — MLSNOW
- 1997-05-05 Listed $79,999 MLSNOW
Property tax history
+5.8%/yrLatest (2025): $2,320 · +40.8% YoY. Source: county tax records.
Cash-flow waterfall
monthlySold comps — $/sqft
last 12 mo · ≤1 miLoading sold comps…