1304 Butler · Leesville, LA
Flood risk 1/10 · Minimal
- FEMA flood zone
- X (unshaded)
- Chance of flooding over 30 yrs
- 0.0%
- Est. flood insurance / yr
- $507 – $1,088
Fire risk 2/10 · Minimal
- Est. fire insurance / yr
- $1,269 – $2,357
Heat risk 8/10 · Major
- Hot days now (above 110°F)
- 7 days/yr
- Hot days in 30 yrs
- 20 days/yr
Wind risk 8/10 · Major
- Chance of severe wind over 30 yrs
- 99.0%
Air-quality risk 1/10 · Minimal
- Unhealthy air days now
- 0 days/yr
- Unhealthy air days in 30 yrs
- 0 days/yr
Risk factors via First Street. Map © Google.
Why this score? — see what drove the B- grade
The composite is a weighted blend of 9 inputs, each scored 0–100. Each bar is that input's sub-score; the figure is the points it added to the 100-point composite (weight × sub-score).
- Cash flow +26.2/30.0
- ARV discount +9.5/15.0
- DSCR +8.9/10.0
- 1% rule +6.0/10.0
- Rent growth +4.9/5.0
- Livability +3.7/5.0
- Schools +3.6/10.0
- Condition / age +2.5/5.0
- Appreciation +0.0/10.0
$110,000
🖨 Deal sheet 📄 Offer letter ✓ Due diligence
Listing remarks
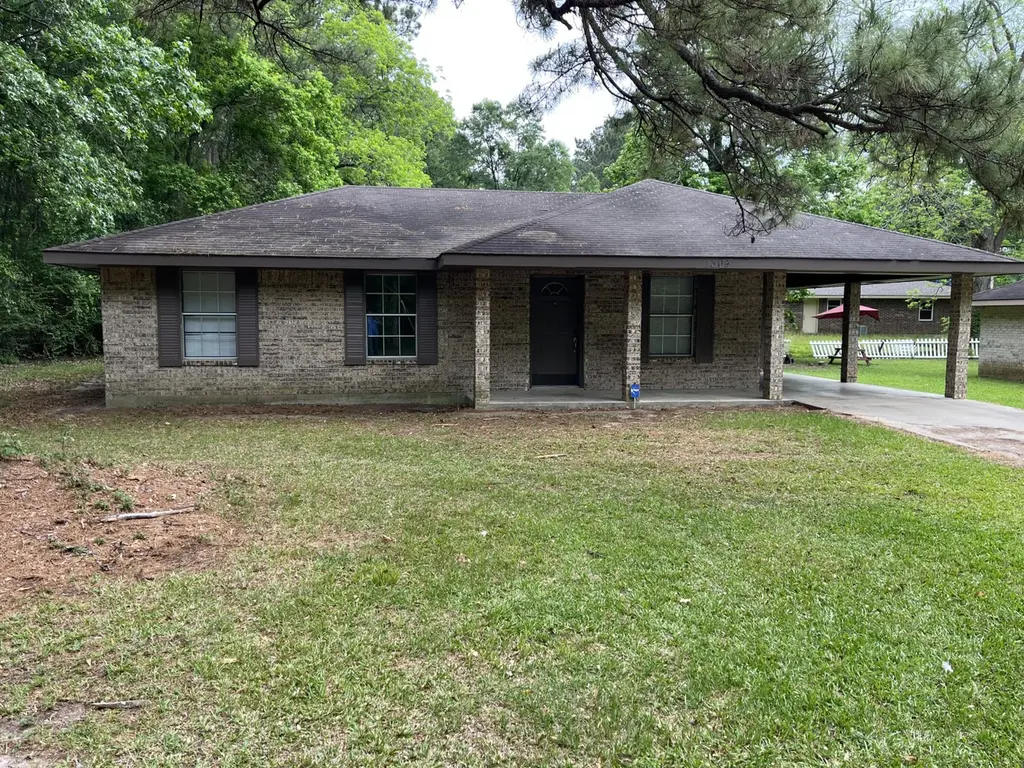
ARE YOU A FIRST TIME HOME BUYER OR LOOKING TO INCREASE YOUR RENTAL PORTFOLIO? Stop, turn around and take a look at this one. This 3 bedroom, 1 bath brick home is nestled behind Vernon Elementary School. It sits on . 15 of an acre so the yard is easy to maintain. Previous rental income was $825.00 per month. Come take a look and you decide. CALL YOUR REALTOR TODAY FOR YOUR PRIVATE SHOWING.
Key facts
- Brick home
- 6,534 sq ft lot
- Listed 55 days
Tags
Property features AI
Exterior
- Utilities: Public water; Public sewer
- Home design: Single-family residence; One story; Residential zoning
- Construction: Brick construction
- Exterior features: Composition roof
Interior
- Kitchen: Refrigerator; Electric range
- Flooring: Carpet; Vinyl
- Bathrooms: 1 full bathroom
- Heating & cooling: Central heating; Central air; Ceiling fan(s)
- Interior features: Refrigerator; Electric range
Neighborhood map
What this means for you Summary
Snapshot
- This is a 3-bed/1.0-bath single-family listed at $110k.
Deal economics
- At list price, monthly cash flow is $281 ($3k/yr) — positive.
- The deal already cash-flows at list — no discount required.
- Meets the 1% rule at list price ($1k rent vs $110k).
- Recommended offer: $107k (3.0% below list) — sets the bar for market timing.
- Cap rate 9.4% vs local median 7.3% in Leesville — meaningfully above typical; check what's discounted (condition, days-on-market, listing class) to confirm the premium yield is real.
Location & tenants
- Location reads 73/100 on livability (#30 in LA) — a middle-class / working-renter tenant base. Strengths: cost of living A+, health & safety A+, housing A; Watch: crime F, amenities F, commute F.
- Vernon Parish (rural): math 35% / reading 51% proficiency, ranked #18 of 98 in LA (top 18%) — families likely to look elsewhere, expect single-tenant / working-renter base with shorter leases.
- Market conditions: Rents rising fast (+9.6%/yr); 210 active listings in the ZIP; 6 comparable units currently listed for rent nearby; rentals lingering (median 44d on market — plan ~5-8 weeks vacancy on turnover, expect pricing pressure); 100% of comp listings sitting > 30 days — soft ceiling on asking rent; 26 units permitted in Vernon Parish in 2024 (0 in 5+ unit buildings).
Forward outlook
- Local home prices are declining (-3.0%/yr); year-one equity from $761 of loan paydown is wiped out by about $3k of value loss. Plan a longer hold.
- Vernon County population projected at -25% by 2050 — secular population decline; favor cash flow + early exit over multi-decade hold.
- At projected returns (-3.0% appreciation + 8.0% rent growth), your $31k cash investment doubles in ~8 years — after that, you're playing with house money.
Negotiation context
- It's been on market 56 days — a 3% lower offer ($107k) is reasonable based on typical stale-listing flexibility.
Risks & watch-outs
- Climate carrying-cost: severe wind risk, 99% chance of damaging wind over 30y; extreme-heat days projected 7→20/yr by 2055 (HVAC capex compounding) — expect insurance premiums to compound above CPI over the hold.
Questions for the listing agent
- It's been on market 56 days. Have you received any prior offers? Is the seller open to a 3% concession, seller financing, or rate buy-down credit?
- Is there a deadline driving the sale (1031 exchange, divorce, estate, relocation)? That informs how much negotiation room exists.
- Schools are B-rated — typically a magnet for longer-tenancy family renters. What's the average tenant stay here, and is there a school-zone premium baked into asking?
- Crime grade is F in this area — have there been break-ins, vandalism, or insurance claims at this property in the last 3 years? What carrier currently insures it and at what premium?
- What's the average days-on-market for RENTAL listings here right now (not sales)? A rising rental-DOM trend means longer vacancies and softer asking-rent achievability than the comps imply.
- What's the recent tenant-quality profile in this submarket — average credit score on applications, eviction rate, late-payment / NSF rate, and stable-employment percentage? A property-management company in the area should have these aggregated.
- How much new for-sale + rental construction is in the pipeline within 1–3 miles? Heavy new supply typically softens prices + rents 12–24 months out; constrained supply supports both.
Investment metrics
- 1% rule
- 1.10% ✓
- Cap rate
- 9.35%
- Cash-on-cash
- 10.93%
- DSCR
- 1.49
- GRM
- 7.6
CMA / ARV
- ARV (median comp)
- $115,235
- List price
- $110,000
- Delta
- -4.54%
- Verdict
- FAIR
- Comps
- 20 within 1.0 mi
Show comp detail 3 sales within ~0.75 mi
| Address | Dist | Beds/Ba | Sqft | Sold | Price | $/sf | Match |
|---|---|---|---|---|---|---|---|
| 1 Katherine Loop | 0.10mi | 3/2.0 | 1,160 (+10%) | 18mo | $120,500 | $104 | 61 |
| 15 Kurthwood Rd | 0.52mi | 3/1.0 | 1,082 (+2%) | 17mo | $104,900 | $97 | 58 |
| 308 Belview Rd | 0.61mi | 2/1.5 (-1) | 1,155 (+9%) | 23mo | $145,000 | $126 | 30 |
Match score weights: distance 35% · size 25% · config 20% · recency 20%. Top-matched comps best support the ARV.
Projected returns pro-forma
-3.0% appreciation · 8.0% rent growth · sell at horizon
- IRR
- 5.1%
- Equity multiple
- 1.21×
- Total profit
- $6,381
- Equity at exit
- $16,401
- IRR
- 18.4%
- Equity multiple
- 2.86×
- Total profit
- $57,434
- Equity at exit
- $9,511
Cash invested: $30,800 (down + closing). Projections, not guarantees.
Landlord ↔ Tenant lean methodology
- Overall (STATE)
- 90 Strongly Landlord-Friendly
- State Louisiana
- 90 Strongly Landlord-Friendly · R+12
- County
- — inherits STATE
- City
- — inherits STATE
ZIP-level market 71446
- Home prices YoY
- -32.1%
- Rents YoY
- 9.6%
- Active inventory
- 210
- Price-to-rent
- 7.6×
Monthly cashflow live
- Estimated rent
- $1,206 high interval (Pro) →
- Mortgage (P&I)
- −$577
- Tax from tax record
- −$50 /mo · $598/yr
- Insurance
- −$46
- HOA
- −$0
- Vacancy / Maint / Mgmt
- −$253
- Net cashflow
- $281
Break-even live
UW: 25.0% down · 7.5% · 30yr · 1.5% tax · 5.0% vac · 8.0% maint · 8.0% mgmt
Financing live
Cash to close
- Down payment
- $27,500
- Closing costs
- $3,300
- Reserves months
- —
- Total cash needed
- —
Loan-product check · same deal, 3 products live
Conventional
25% down · 7.5% · 30yr
- Down + closing
- —
- Monthly P&I
- —
- Monthly cashflow
- —
- DSCR
- —
- Eligible?
- —
Personal DTI + credit; lowest rate.
DSCR
20% down · 8.5% · 30yr
- Down + closing
- —
- Monthly P&I
- —
- Monthly cashflow
- —
- DSCR
- —
- Eligible?
- —
No personal income docs; deal must DSCR.
Hard money
10% down · 12.0% · 12mo
- Down + closing
- —
- Monthly P&I
- —
- Monthly cashflow
- —
- DSCR
- —
- Eligible?
- —
Short-term bridge; refi at stabilization.
Rent comps 6 comps
| Address | Beds | Baths | Sqft | Rent | $/sqft | DOM | Units | Dist |
|---|---|---|---|---|---|---|---|---|
| 10 Katherine Loop Leesville, LA | 3.0 | 2.0 | 1106 | $1,100 | $0.99 | 43d | 1 | 0.20mi |
| 207 Belview Rd Leesville, LA | 3.0 | 1.5 | 1300 | $1,200 | $0.92 | 43d | 1 | 0.54mi |
| 305 W Maggie St Apt 3 Leesville, LA | 2.0 | 1.5 | 840 | $600 | $0.71 | 43d | 1 | 0.85mi |
| 347 Watson Rd Unit 20 Leesville, LA | 3.0 | 1.0 | 1160 | $595 | $0.51 | 43d | 1 | 0.86mi |
| 347 Watson Rd Unit 12 Leesville, LA | 2.0 | 1.0 | 1160 | $575 | $0.50 | 43d | 1 | 0.86mi |
| 306 W Harriet St Apt 6 Leesville, LA | 2.0 | 1.5 | 840 | $650 | $0.77 | 43d | 1 | 0.87mi |
Listing history 17 events
-
2026-06-19days on market $110,000 Active 56 DOM
-
2026-06-18days on market $110,000 Active 55 DOM
-
2026-06-17days on market $110,000 Active 54 DOM
-
2026-06-16days on market $110,000 Active 53 DOM
-
2026-06-15days on market $110,000 Active 52 DOM
-
2026-06-14days on market $110,000 Active 50 DOM
-
2026-06-12days on market $110,000 Active 49 DOM
-
2026-06-09days on market $110,000 Active 46 DOM
-
2026-06-08days on market $110,000 Active 45 DOM
-
2026-06-07days on market $110,000 Active 44 DOM
-
2026-06-07days on market $110,000 Active 43 DOM
-
2026-06-04days on market $110,000 Active 40 DOM
-
2026-06-02days on market $110,000 Active 39 DOM
-
2026-06-01days on market $110,000 Active 38 DOM
-
2026-05-31days on market $110,000 Active 37 DOM
-
2026-05-31days on market $110,000 Active 36 DOM
-
2026-04-24$110,000 Active 392-char remark
ⓘ Source: listings_history table (triggers on properties + properties_extension) + one-shot
backfill from property_details.listing_events for pre-trigger history.
Tax reassessment forecast LA · Resets to sale price
- Current annual tax
- $598 · $50/mo
- Projected year-2 tax
- $605 · $50/mo
- Expected delta
- +$7/yr (+$1/mo · 1.2%)
ⓘ Screening estimate from a state-policy table — verify with the county assessor before closing.
Climate risk First Street
- Flood 1/10 Low FEMA zone X (unshaded) · 0% chance over 30 yrs
- Wildfire 2/10 Low
- Heat 8/10 Severe 7 d/yr ≥110°F today · 20 d/yr by 30 yrs out
- Wind 8/10 Severe 99% chance of damaging wind over 30 yrs
- Air quality 1/10 Low 0 unhealthy d/yr today · 0 by 30 yrs out
Nearby sold comps map
Loading sold comps map…
Walkable amenities ~0.75 mi
Loading nearby amenities…
Taxation est. · year 1
- Rental income
- $14,476
- − Mortgage interest
- −$6,162
- − Property taxes
- −$598
- − Insurance
- −$550
- − Repairs & maintenance
- −$1,158
- − Management
- −$1,158
- − Depreciation
- −$3,200
- Taxable income
- $1,651
- Est. tax owed @ 24.0%
- −$396
- After-tax cash flow
- $2,970/yr
For passive investors: Depreciation is non-cash, so a rental often shows a tax loss while cash-flowing — sheltering income. Rental losses are passive: they offset passive income freely, and up to $25,000/yr can offset ordinary (W-2) income if you actively participate and your MAGI is under $100k (phasing out to $0 by $150k); unused losses carry forward. On sale, claimed depreciation is recaptured at up to 25%, and gains may owe capital-gains tax (a 1031 exchange can defer both). Figures are a year-1 estimate at your 24.0% rate — not tax advice; consult a CPA.
Schools (NCES district)
- District
- Vernon Parish
- NCES district ID
- 2201830
- Math proficiency
- 35% ▼ -42.00%
- Reading proficiency
- 51% ▼ -32.00%
- Median HH income
- $44,822
- Composite
- 36.42/100
- National rank
- #4674
- State rank
- #18 of 98 in LA
Livability — Leesville
- Score
- 73/100
- State rank
- #30
- US rank
- #5046
Category grades
Schools grade is shown separately in the Schools card above.
Census & demographics
- Census place
- Leesville, LA
- County
- Vernon Parish · 21,275 people
- City population
- 21,275
- Metro
- Fort Polk South, LA
- Population (ZIP)
- 21,275
- Household income
- $55,925
- Rent vs Own
- Severe rent burden
- 659.0
Population outlook (Vernon County) Hauer SSP2
- Today (2025)
- 45,401 people
- By 2030
- 43,015 · -5.3%
- By 2040
- 38,171 · -15.9%
- By 2050
- 34,087 · -24.9%
- By 2075
- 28,267 · -37.7%
- By 2100
- 25,486 · -43.9%
Race, ethnicity, and origin ACS 2023
- Neighborhood character
- Predominantly White (72%)
- Race & ethnicity
- White 72% Black 16% Hispanic / Latino 6% Two or more races 5% Asian 2% Native American 1%
- Hispanic origin (detail)
- Mexican 3% Puerto Rican 1%
- Common ancestry
- Lithuanian 3% Slovak 1% Romanian 1%
- Foreign-born
- 3% · Canada, South Korea, Vietnam
- Languages at home
- 94% English-only · Spanish 3% French/Haitian/Cajun 1%
Political lean MEDSL · Vernon
- 2024 margin
- Solid R (+67.9) · D 15.6% · R 83.4% · Other 1.0%
- 2008→2024 swing
- -14.5pp toward R · 2008: -53.4pp · 2024: -67.9pp
- All cycles
- 2024: R+67.9 2020: R+64.9 2016: R+65.0 2012: R+57.5 2008: R+53.4
Not yet ingested
- Civics
- —
Market trends
- HPI YoY
- ▼ -61.06%
- Current HPI
- 128.8849
- Rent YoY
- ▲ 9.60%
- Metro
- Fort Polk South, LA
- State GDP YoY
- ▲ 3.29%
- F500 in state
- 10
Industry mix (Fortune 500 HQ in LA)
| Industry | F500 HQs | Revenue |
|---|---|---|
| Telecommunications | 2 | $23B |
|
||
| Utilities | 1 | $12B |
|
||
| Wholesale / Distribution | 1 | $5B |
|
||
| Advertising | 1 | $2B |
|
||
Price history
1 event — show timeline
- 2026-04-24 Listed $110,000 GFPAR
Property tax history
+0.7%/yrLatest (2025): $598 · -0.8% YoY. Source: county tax records.
Cash-flow waterfall
monthlySold comps — $/sqft
last 12 mo · ≤1 miLoading sold comps…