 🏷️ Likely Rental
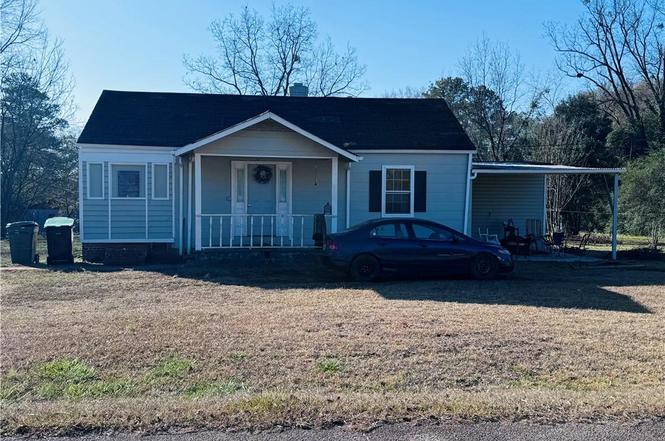
209 Denham St · Hannahs Mill, GA
Flood risk 1/10 · Minimal
- FEMA flood zone
- X (unshaded)
- Chance of flooding over 30 yrs
- 0.0%
- Est. flood insurance / yr
- $507 – $1,088
Fire risk 4/10 · Minor
- Est. fire insurance / yr
- $963 – $1,789
Heat risk 7/10 · Major
- Hot days now (above 108°F)
- 7 days/yr
- Hot days in 30 yrs
- 18 days/yr
Wind risk 6/10 · Moderate
- Chance of severe wind over 30 yrs
- 58.0%
Air-quality risk 3/10 · Minor
- Unhealthy air days now
- 2 days/yr
- Unhealthy air days in 30 yrs
- 3 days/yr
Risk factors via First Street. Map © Google.
Why this score? — see what drove the B grade
The composite is a weighted blend of 9 inputs, each scored 0–100. Each bar is that input's sub-score; the figure is the points it added to the 100-point composite (weight × sub-score).
- Cash flow +28.1/30.0
- ARV discount +15.0/15.0
- DSCR +10.0/10.0
- 1% rule +7.0/10.0
- Livability +3.1/5.0
- Rent growth +2.5/5.0
- Condition / age +2.5/5.0
- Schools +2.1/10.0
- Appreciation +0.0/10.0
$115,000
🖨 Deal sheet (PDF) 📄 Offer letter ✓ Due diligence
Listing remarks
Great Investment property * * 5 Bedrooms/3 Baths * * Tenant in place and would like to continue to stay * * Current tenant would like to continue leasing from new owner * * minor TLC. Closed to shopping Center and an hour from Atlanta Airport. SOLD IN 'AS-IS' CONDITION.
Key facts
- 0.86 acre lot
- Parking
- Built 1952
Property features AI
Exterior
- Parking: Carport (1 space); Driveway parking; Open parking available
- Utilities: Public water; Public sewer; Cable available; Electricity available; Natural gas available; Phone available; Underground utilities; Water available; Sewer available
- Home design: One-level home; Frame construction; Resale condition; Slab foundation; Composition/shingle roof
- Construction: Frame construction; Slab foundation; Composition and shingle roof
- Exterior features: Private yard; Enclosed patio/porch
Interior
- Kitchen: Cabinets; Laminate counters; Electric oven; Other kitchen features
- Bedrooms: Five main-level bedrooms; Additional bedroom features: Other
- Flooring: Hardwood flooring; Laminate flooring
- Bathrooms: Three full bathrooms; Master bathroom with tub/shower combo; All three bathrooms on the main level
- Heating & cooling: Wall unit heating; Wall unit cooling
- Interior features: Other interior features; No common walls
- Laundry & utility: Dedicated laundry room
Neighborhood map
What this means for you Summary
Snapshot
- This is a 3-bed/1.5-bath single-family listed at $115k.
Deal economics
- At list price, monthly cash flow is $361 ($4k/yr) — positive.
- The deal already cash-flows at list — no discount required.
- Meets the 1% rule at list price ($1k rent vs $115k).
- Recommended offer: $108k (6.0% below list) — sets the bar for market timing.
- Cap rate 10.1% vs local median 3.4% in Hannahs Mill — top-decile yield for the area; either an underpriced asset or a hidden risk that comps aren't pricing in. Stress-test before assuming the spread holds.
Location & tenants
- Location reads 62/100 on livability (#307 in GA) — a middle-class / working-renter tenant base. Strengths: cost of living A+, housing A+, crime A-; Watch: employment D+, amenities F, commute F.
- Thomaston-Upson County (rural): math 26% / reading 26% proficiency, ranked #123 of 174 in GA (top 71%) — low school quality limits family demand, transient renter base, plan for 1-2y turnover; 60% free/reduced lunch — lower-income household profile, screen leases tightly.
- Zoned schools: Upson-Lee Primary School (1,049 students, 95% FRL); Upson-Lee Middle School (math 22% / reading 32%, grade F, #271 of 470 statewide, top 60%, 927 students, 83% FRL); Upson-Lee High School (math 18% / reading 17%, grade F, #264 of 424 statewide, top 63%, 1,178 students, 70% FRL) — zoned schools average 83% FRL vs 60% district-wide (23 pts higher); higher-poverty schools than district average — tighter screening recommended.
- Market conditions: 199 active listings in the ZIP; 111 units permitted in Upson County in 2024 (0 in 5+ unit buildings).
Forward outlook
- Local home prices are declining (-3.0%/yr); year-one equity from $795 of loan paydown is wiped out by about $3k of value loss. Plan a longer hold.
- Upson County population projected at -27% by 2050 — secular population decline; favor cash flow + early exit over multi-decade hold.
- At projected returns (-3.0% appreciation + 3.0% rent growth), your $32k cash investment doubles in ~9 years — after that, you're playing with house money.
Negotiation context
- It's been on market 76 days — a 6% lower offer ($108k) is reasonable based on typical stale-listing flexibility.
- 6 sale attempts since 3y ago with the ask held roughly flat each time — persistent listings suggest the price (not the market) is what's stuck; bring a comps-based counter.
Risks & watch-outs
- Watch-outs: built in 1952 — expect roof / HVAC / electrical / plumbing capex.
- Climate carrying-cost: major wind risk, 58% chance of damaging wind over 30y; extreme-heat days projected 7→18/yr by 2055 (HVAC capex compounding) — expect insurance premiums to compound above CPI over the hold.
Questions for the listing agent
- It's been on market 76 days. Have you received any prior offers? Is the seller open to a 6% concession, seller financing, or rate buy-down credit?
- Built in 1952 — when were the roof, HVAC, electrical panel, plumbing, and water heater last replaced?
- Why hasn't it sold? Are there any deal-killer items the seller is aware of (foundation, flood, title, zoning, code violations)?
- Is there a deadline driving the sale (1031 exchange, divorce, estate, relocation)? That informs how much negotiation room exists.
- Schools are F-rated, which usually means shorter tenancies and higher turnover. Who's the typical renter profile here, and what's been the actual vacancy rate?
- What's the average days-on-market for RENTAL listings here right now (not sales)? A rising rental-DOM trend means longer vacancies and softer asking-rent achievability than the comps imply.
- What's the recent tenant-quality profile in this submarket — average credit score on applications, eviction rate, late-payment / NSF rate, and stable-employment percentage? A property-management company in the area should have these aggregated.
- How much new for-sale + rental construction is in the pipeline within 1–3 miles? Heavy new supply typically softens prices + rents 12–24 months out; constrained supply supports both.
Investment metrics
- 1% rule
- 1.20% ✓
- Cap rate
- 10.06%
- Cash-on-cash
- 13.46%
- DSCR
- 1.60
- GRM
- 6.9
CMA / ARV
- ARV (on-the-fly)
- $203,760
- Comps found
- 8
Show comp detail 8 sales within ~0.75 mi
| Address | Dist | Beds/Ba | Sqft | Sold | Price | $/sf | Match |
|---|---|---|---|---|---|---|---|
| 116 Salbar St | 0.26mi | 3/1.5 | 1,125 (-1%) | 6mo | $190,000 | $169 | 82 |
| 318 North St | 0.24mi | 2/1.0 (-1) | 1,080 (-5%) | 3mo | $31,000 | $29 | 72 |
| 107 Salbar St | 0.31mi | 3/1.5 | 1,075 (-5%) | 7mo | $213,000 | $198 | 72 |
| 105 Tanglewood Dr | 0.29mi | 3/1.0 | 1,040 (-8%) | 14mo | $207,000 | $199 | 59 |
| 401 Denham St | 0.27mi | 4/2.0 (+1) | 1,200 (+6%) | 15mo | $80,000 | $67 | 58 |
| 123 Marlon St | 0.36mi | 3/2.0 | 1,247 (+10%) | 17mo | $223,900 | $180 | 50 |
| 313 North St | 0.24mi | 3/2.0 | 968 (-14%) | 20mo | $170,000 | $176 | 46 |
| 108 Marlon St | 0.38mi | 3/1.5 | 972 (-14%) | 18mo | $205,000 | $211 | 44 |
Match score weights: distance 35% · size 25% · config 20% · recency 20%. Top-matched comps best support the ARV.
Projected returns pro-forma
-3.0% appreciation · 3.0% rent growth · sell at horizon
- IRR
- 3.5%
- Equity multiple
- 1.14×
- Total profit
- $4,351
- Equity at exit
- $17,147
- IRR
- 13.0%
- Equity multiple
- 2.04×
- Total profit
- $33,338
- Equity at exit
- $9,943
Cash invested: $32,200 (down + closing). Projections, not guarantees.
Landlord ↔ Tenant lean methodology
- Overall (STATE)
- 90 Strongly Landlord-Friendly
- State Georgia
- 90 Strongly Landlord-Friendly · R+3
- County
- — inherits STATE
- City
- — inherits STATE
ZIP-level market 30286
- Home prices YoY
- -14.7%
- Active inventory
- 199
- Price-to-rent
- 6.9×
Monthly cashflow live
- Estimated rent
- $1,384 medium interval (Pro) →
- Mortgage (P&I)
- −$603
- Tax from tax record
- −$81 /mo · $973/yr
- Insurance
- −$48
- HOA
- −$0
- Vacancy / Maint / Mgmt
- −$291
- Net cashflow
- $361
Break-even live
Sensitivity live
| Price | -10% $426 | -5% $394 | +0% $361 | +5% $329 | +10% $296 |
|---|---|---|---|---|---|
| Rent | -10% $252 | -5% $307 | +0% $361 | +5% $416 | +10% $470 |
| Rate | -1.0pp $419 | -0.5pp $390 | base $361 | +0.5pp $331 | +1.0pp $301 |
UW: 25.0% down · 7.5% · 30yr · 1.5% tax · 5.0% vac · 8.0% maint · 8.0% mgmt
Financing live
Cash to close
- Down payment
- $28,750
- Closing costs
- $3,450
- Reserves months
- —
- Total cash needed
- —
Loan-product check · same deal, 3 products live
Conventional
25% down · 7.5% · 30yr
- Down + closing
- —
- Monthly P&I
- —
- Monthly cashflow
- —
- DSCR
- —
- Eligible?
- —
Personal DTI + credit; lowest rate.
DSCR
20% down · 8.5% · 30yr
- Down + closing
- —
- Monthly P&I
- —
- Monthly cashflow
- —
- DSCR
- —
- Eligible?
- —
No personal income docs; deal must DSCR.
Hard money
10% down · 12.0% · 12mo
- Down + closing
- —
- Monthly P&I
- —
- Monthly cashflow
- —
- DSCR
- —
- Eligible?
- —
Short-term bridge; refi at stabilization.
Listing history 28 events
-
2026-06-21days on market $115,000 Active 76 DOM
-
2026-06-18days on market $115,000 Active 74 DOM
-
2026-06-17days on market $115,000 Active 73 DOM
-
2026-06-16days on market $115,000 Active 72 DOM
-
2026-06-15days on market $115,000 Active 71 DOM
-
2026-06-13days on market $115,000 Active 69 DOM
-
2026-06-12days on market $115,000 Active 68 DOM
-
2026-06-09days on market $115,000 Active 65 DOM
-
2026-06-08days on market $115,000 Active 64 DOM
-
2026-06-07days on market $115,000 Active 63 DOM
-
2026-06-07days on market $115,000 Active 62 DOM
-
2026-06-04days on market $115,000 Active 59 DOM
-
2026-06-02days on market $115,000 Active 58 DOM
-
2026-06-01days on market $115,000 Active 57 DOM
-
2026-05-31days on market $115,000 Active 56 DOM
-
2026-05-31days on market $115,000 Active 55 DOM
-
2026-04-05status Active
-
2026-03-06$115,000 Active
-
2025-02-28historical
-
2024-11-04$249,000 Active
-
2024-10-31historical
-
2024-07-01$129,000 Active
-
2024-06-30historical
-
2024-04-01$135,000 Active
-
2024-03-31historical
-
2024-02-21price $145,000
-
2024-02-13price $149,000
-
2023-12-27$154,900 Active
ⓘ Source: listings_history table (triggers on properties + properties_extension) + one-shot
backfill from property_details.listing_events for pre-trigger history.
Tax reassessment forecast GA · Resets to sale price
- Current annual tax
- $973 · $81/mo
- Projected year-2 tax
- $1,058 · $88/mo
- Expected delta
- +$85/yr (+$7/mo · 8.7%)
ⓘ Screening estimate from a state-policy table — verify with the county assessor before closing.
Climate risk First Street
- Flood 1/10 Low FEMA zone X (unshaded) · 0% chance over 30 yrs
- Wildfire 4/10 Moderate
- Heat 7/10 Severe 7 d/yr ≥108°F today · 18 d/yr by 30 yrs out
- Wind 6/10 Major 58% chance of damaging wind over 30 yrs
- Air quality 3/10 Moderate 2 unhealthy d/yr today · 3 by 30 yrs out
Nearby sold comps map
Loading sold comps map…
Walkable amenities ~0.75 mi
Loading nearby amenities…
Taxation est. · year 1
- Rental income
- $16,606
- − Mortgage interest
- −$6,442
- − Property taxes
- −$973
- − Insurance
- −$575
- − Repairs & maintenance
- −$1,328
- − Management
- −$1,328
- − Depreciation
- −$3,345
- Taxable income
- $2,614
- Est. tax owed @ 24.0%
- −$627
- After-tax cash flow
- $3,707/yr
For passive investors: Depreciation is non-cash, so a rental often shows a tax loss while cash-flowing — sheltering income. Rental losses are passive: they offset passive income freely, and up to $25,000/yr can offset ordinary (W-2) income if you actively participate and your MAGI is under $100k (phasing out to $0 by $150k); unused losses carry forward. On sale, claimed depreciation is recaptured at up to 25%, and gains may owe capital-gains tax (a 1031 exchange can defer both). Figures are a year-1 estimate at your 24.0% rate — not tax advice; consult a CPA.
Schools (NCES district)
- District
- Thomaston-Upson County
- NCES district ID
- 1305280
- Math proficiency
- 26% ▼ -14.00%
- Reading proficiency
- 26% ▼ -6.00%
- Median HH income
- $34,757
- Composite
- 21.44/100
- National rank
- #8338
- State rank
- #123 of 174 in GA
Livability — Hannahs Mill
- Score
- 62/100
- State rank
- #307
- US rank
- #16712
Category grades
Schools grade is shown separately in the Schools card above.
Census & demographics
- Census place
- Hannahs Mill, GA
- Population (ZIP)
- 24,616
Population outlook (Upson County) Hauer SSP2
- Today (2025)
- 24,396 people
- By 2030
- 23,158 · -5.1%
- By 2040
- 20,522 · -15.9%
- By 2050
- 17,828 · -26.9%
- By 2075
- 12,216 · -49.9%
- By 2100
- 7,779 · -68.1%
Race, ethnicity, and origin ACS 2023
- Neighborhood character
- Predominantly White (65%)
- Race & ethnicity
- White 65% Black 27% Two or more races 4% Hispanic / Latino 3%
- Common ancestry
- Italian 1% Slovak 1% Serbian 1%
- Foreign-born
- 2% · Canada
- Languages at home
- 98% English-only · Spanish 1%
Political lean MEDSL · Upson
- 2024 margin
- Solid R (+39.7) · D 30.0% · R 69.7%
- 2008→2024 swing
- -11.5pp toward R · 2008: -28.3pp · 2024: -39.7pp
- All cycles
- 2024: R+39.7 2020: R+34.1 2016: R+35.0 2012: R+29.1 2008: R+28.3
Not yet ingested
- Civics
- —
Market trends
- HPI YoY
- ▼ -54.56%
- Current HPI
- 316.6771
- Rent YoY
- —
- Metro
- —
- State GDP YoY
- ▲ 2.66%
- F500 in state
- 28
Industry mix (Fortune 500 HQ in GA)
| Industry | F500 HQs | Revenue |
|---|---|---|
| Paper / Packaging | 2 | $29B |
|
||
| Retail | 1 | $160B |
|
||
| Transportation / Logistics | 1 | $91B |
|
||
| Airlines | 1 | $62B |
|
||
| Consumer Goods | 1 | $47B |
|
||
| Utilities | 1 | $25B |
|
||
Price history
-25.8% since first listed12 events — show timeline
- 2026-04-05 Relisted — FMLS
- 2026-03-06 Listed $115,000 FMLS
- 2025-02-28 Listing Removed — FMLS
- 2024-11-04 Listed $249,000 FMLS
- 2024-10-31 Listing Removed — FMLS
- 2024-07-01 Listed $129,000 FMLS
- 2024-06-30 Listing Removed — FMLS
- 2024-04-01 Listed $135,000 FMLS
- 2024-03-31 Listing Removed — FMLS
- 2024-02-21 Price Changed $145,000 FMLS
- 2024-02-13 Price Changed $149,000 FMLS
- 2023-12-27 Listed $154,900 FMLS
Property tax history
+2.9%/yrLatest (2025): $973 · +12.2% YoY. Source: county tax records.
Cash-flow waterfall
monthlySold comps — $/sqft
last 12 mo · ≤1 miLoading sold comps…