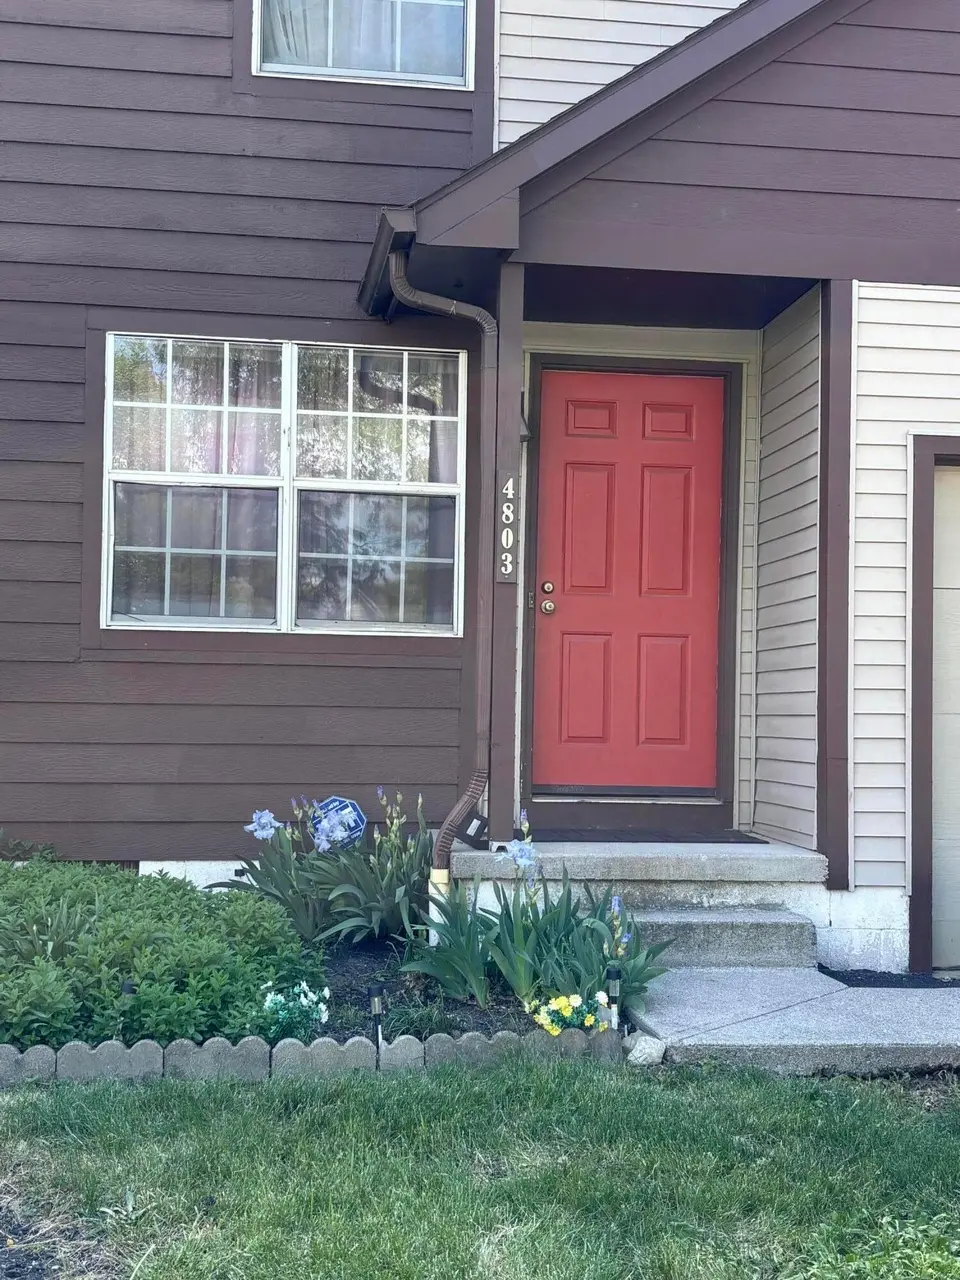
4803 Prince Charles Way Unit 42B · Hilliard, OH
Flood risk 1/10 · Minimal
- FEMA flood zone
- X (unshaded)
- Chance of flooding over 30 yrs
- 0.0%
- Est. flood insurance / yr
- $473 – $860
Fire risk 1/10 · Minimal
- Est. fire insurance / yr
- $713 – $1,323
Heat risk 3/10 · Minor
- Hot days now (above 100°F)
- 7 days/yr
- Hot days in 30 yrs
- 18 days/yr
Wind risk 2/10 · Minimal
- Chance of severe wind over 30 yrs
- 1.0%
Air-quality risk 3/10 · Minor
- Unhealthy air days now
- 2 days/yr
- Unhealthy air days in 30 yrs
- 4 days/yr
Risk factors via First Street. Map © Google.
Why this score? — see what drove the C- grade
The composite is a weighted blend of 9 inputs, each scored 0–100. Each bar is that input's sub-score; the figure is the points it added to the 100-point composite (weight × sub-score).
- ARV discount +13.7/15.0
- Cash flow +13.2/30.0
- 1% rule +5.9/10.0
- Schools +5.3/10.0
- Livability +4.4/5.0
- DSCR +4.0/10.0
- Rent growth +2.8/5.0
- Condition / age +2.5/5.0
- Appreciation +0.0/10.0
$190,000
🖨 Deal sheet 📄 Offer letter ✓ Due diligence
Listing remarks
Desirable Area Near Shopping, Restaurants, and Major commuter routes- 3 bedroom 2 full 1 half bath 1344 sg ft and a basement -Hilliard Schools Nearby
Key facts
- Near shopping
- Restaurants
- $220 HOA
Tags
Property features AI
Finance
- HOA & community: Homeowners association with a monthly fee of $220; HOA covers lawn care, insurance, and snow removal
Exterior
- Parking: Attached garage (1 car)
- Utilities: Public water; Public sewer
- Home design: Condominium; Two levels; Built in 1989; One common wall
- Construction: Block foundation; Built in 1989
- Exterior features: Block foundation
Interior
- Bathrooms: Two full bathrooms; One half bathroom
- Heating & cooling: Central air conditioning; Forced air heating
- Interior features: Insulated windows throughout; Basement
Neighborhood map
What this means for you Summary
Snapshot
- This is a 3-bed/2.5-bath condo listed at $190k.
Deal economics
- At list price, monthly cash flow is $-4 ($-47/yr) — negative.
- To cash-flow at today's rent, offer at most $189k (0.4% below list).
- Meets the 1% rule at list price ($2k rent vs $190k).
- Recommended offer: $184k (3.0% below list) — sets the bar for market timing.
- Cap rate 6.3% vs local median 1.8% in Hilliard — top-decile yield for the area; either an underpriced asset or a hidden risk that comps aren't pricing in. Stress-test before assuming the spread holds.
Location & tenants
- Location reads 87/100 on livability (#34 in OH, #331 nationally) — a professional / high-income tenant draw. Strengths: schools A+, crime A+, employment A+; Watch: commute F.
- Hilliard City (suburban): math 57% / reading 62% proficiency, ranked #246 of 656 in OH (top 38%) — acceptable for families but not a draw, mixed tenant base, ~2y average lease; only 20% free/reduced lunch — higher-income household profile.
- Market conditions: Rents rising (+1.2%/yr); 253 active listings in the ZIP; 29 comparable units currently listed for rent nearby; rentals leasing fast (median 8d on market — plan ~1-2 weeks tenant-placement turnaround); high-income renter base; 8,139 units permitted in Franklin County in 2024 (5,940 in 5+ unit buildings).
Forward outlook
- Local home prices are declining (-3.0%/yr); year-one equity from $1k of loan paydown is wiped out by about $6k of value loss. Plan a longer hold.
- Franklin County population projected at +34% by 2050 — long-run rental-demand tailwind backs the buy-and-hold thesis.
Negotiation context
- It's been on market 45 days — a 3% lower offer ($184k) is reasonable based on typical stale-listing flexibility.
- Current owner paid $75k; list at $190k implies a 153% gain — meaningful room to come down on a strong offer.
Questions for the listing agent
- What do current leases actually rent for vs. the listed asking? Can we see a recent rent roll and the last 12 months of T-12 income?
- It's been on market 45 days. Have you received any prior offers? Is the seller open to a 3% concession, seller financing, or rate buy-down credit?
- What does the HOA fee cover, when was the last increase, and are there any pending special assessments or reserve-fund shortfalls?
- Any open or pending special assessments — roof, HVAC, plumbing, elevator, façade? What's the per-unit balance and payoff schedule, and is the seller paying it off at close or rolling it to the buyer?
- Is there a deadline driving the sale (1031 exchange, divorce, estate, relocation)? That informs how much negotiation room exists.
- Schools are A-rated — typically a magnet for longer-tenancy family renters. What's the average tenant stay here, and is there a school-zone premium baked into asking?
- What's the average days-on-market for RENTAL listings here right now (not sales)? A rising rental-DOM trend means longer vacancies and softer asking-rent achievability than the comps imply.
- What's the recent tenant-quality profile in this submarket — average credit score on applications, eviction rate, late-payment / NSF rate, and stable-employment percentage? A property-management company in the area should have these aggregated.
- How much new apartment / multifamily construction is in the pipeline within 1–3 miles? Heavy new supply (>2% of stock underway) typically softens rents 12–24 months out; light construction supports rent growth.
Investment metrics
- 1% rule
- 1.09% ✓
- Cap rate
- 6.27%
- Cash-on-cash
- -0.09%
- DSCR
- 1.00
- GRM
- 7.7
CMA / ARV
- ARV (median comp)
- $220,087
- List price
- $190,000
- Delta
- -13.67%
- Verdict
- UNDERPRICED
- Comps
- 20 within 1.0 mi
Projected returns pro-forma
-3.0% appreciation · 1.25% rent growth · sell at horizon
- IRR
- -18.8%
- Equity multiple
- 0.35×
- Total profit
- $-34,381
- Equity at exit
- $28,330
- IRR
- -16.1%
- Equity multiple
- 0.18×
- Total profit
- $-43,477
- Equity at exit
- $16,428
Cash invested: $53,200 (down + closing). Projections, not guarantees.
Landlord ↔ Tenant lean methodology
- Overall (STATE)
- 73 Landlord-Friendly
- State Ohio
- 73 Landlord-Friendly · R+6
- County
- — inherits STATE
- City
- — inherits STATE
ZIP-level market 43026
- Rents YoY
- 1.2%
- Active inventory
- 253
- Price-to-rent
- 7.7×
Monthly cashflow live
- Estimated rent
- $2,063 high interval (Pro) →
- Mortgage (P&I)
- −$996
- Tax from tax record
- −$338 /mo · $4,056/yr
- Insurance
- −$79
- HOA
- −$220
- Vacancy / Maint / Mgmt
- −$433
- Net cashflow
- $-4
Break-even live
UW: 25.0% down · 7.5% · 30yr · 1.5% tax · 5.0% vac · 8.0% maint · 8.0% mgmt
Financing live
Cash to close
- Down payment
- $47,500
- Closing costs
- $5,700
- Reserves months
- —
- Total cash needed
- —
Loan-product check · same deal, 3 products live
Conventional
25% down · 7.5% · 30yr
- Down + closing
- —
- Monthly P&I
- —
- Monthly cashflow
- —
- DSCR
- —
- Eligible?
- —
Personal DTI + credit; lowest rate.
DSCR
20% down · 8.5% · 30yr
- Down + closing
- —
- Monthly P&I
- —
- Monthly cashflow
- —
- DSCR
- —
- Eligible?
- —
No personal income docs; deal must DSCR.
Hard money
10% down · 12.0% · 12mo
- Down + closing
- —
- Monthly P&I
- —
- Monthly cashflow
- —
- DSCR
- —
- Eligible?
- —
Short-term bridge; refi at stabilization.
Rent comps 29 comps
| Address | Beds | Baths | Sqft | Rent | $/sqft | DOM | Units | Dist |
|---|---|---|---|---|---|---|---|---|
| 4884 Leybourne Dr Hilliard, OH | 3.0 | 1.5 | 1685 | $2,414 | $1.43 | 44d | 1 | 0.25mi |
| 4964 Abberton Ct Hilliard, OH | 3.0 | 2.0 | 1172 | $2,350 | $2.01 | 44d | 1 | 0.27mi |
| 4663 Crystal Ball Dr Hilliard, OH | 1.0–2.0 | 1.0–2.5 | 1180 | $1,889 | $1.60 | 4d | 9 | 0.48mi |
| 5220 Riggins Run Rd Dublin, OH | 1.0–2.0 | 1.0–2.0 | 962 | $2,003 | $2.08 | 2d | 25 | 0.70mi |
| 5252 Riggins Run Dublin, OH | 1.0–2.0 | 1.0–2.0 | 970 | $1,838 | $1.89 | 2d | 12 | 0.75mi |
| 5288 Royal Arch Cascade Dr Dublin, OH | 2.0 | 2.5 | 1224 | $1,850 | $1.51 | 3d | 1 | 0.80mi |
| 5261 Berthold Pass Dr Columbus, OH | 2.0 | 2.5 | 1248 | $1,900 | $1.52 | 3d | 1 | 0.91mi |
| 5464 Eagle River Dr Dublin, OH | 2.0 | 2.0 | 1313 | $2,442 | $1.86 | 2d | 7 | 1.09mi |
| 5787 Passage Creek Dr Dublin, OH | 2.0 | 2.5 | 1456 | $2,200 | $1.51 | 17d | 1 | 1.13mi |
| 5787 Passage Creek Dr Unit 1 Dublin, OH | 2.0 | 3.0 | 1456 | $2,200 | $1.51 | 17d | 1 | 1.13mi |
| 5399 Grand Dr Dublin, OH | 1.0–3.0 | 1.0–2.5 | 1145 | $2,890 | $2.52 | 2d | 26 | 1.18mi |
| 5845 Marble Creek St Dublin, OH | 3.0 | 1.5 | 1244 | $2,049 | $1.65 | 3d | 1 | 1.25mi |
| 4761 Riggins Rd Dublin, OH | 1.0–2.0 | 1.0–2.5 | 1221 | $2,573 | $2.11 | 2d | 13 | 1.32mi |
| 5260 Franklin St Hilliard, OH | 1.0–2.0 | 1.0–2.0 | 792 | $1,735 | $2.19 | 2d | 11 | 1.33mi |
| 4460 Mountain Laurel Rd Hilliard, OH | 1.0–3.0 | 1.0–2.0 | 921 | $2,034 | $2.21 | 2d | 30 | 1.34mi |
| 5037 Vail Pine Pl Dublin, OH | 2.0 | 2.0 | 1343 | $1,840 | $1.37 | 44d | 1 | 1.36mi |
| 5677 Laurel Pine Ln Dublin, OH | 2.0 | 2.0 | 1165 | $1,640 | $1.41 | 24d | 1 | 1.37mi |
| 6007 Haydens Crossing Blvd Dublin, OH | 2.0 | 2.5 | 1335 | $2,500 | $1.87 | 7d | 1 | 1.39mi |
| 4003 Darby Park Rd Hilliard, OH | 3.0 | 3.0 | 1574 | $2,373 | $1.51 | 44d | 1 | 1.40mi |
| 5027 Stratford Pine Ln Dublin, OH | 2.0 | 2.0 | 1284 | $1,795 | $1.40 | 44d | 1 | 1.41mi |
| 5755 Laurel Pine Ln Dublin, OH | 2.0 | 2.0 | 1180 | $1,595 | $1.35 | 44d | 1 | 1.43mi |
| 5002 Stratford Pine Ln Dublin, OH | 2.0 | 2.5 | 1347 | $2,015 | $1.50 | 44d | 1 | 1.44mi |
| 1745 Sledge Dr Hilliard, OH | 1.0–2.0 | 1.0–2.5 | 983 | $2,052 | $2.09 | 2d | 12 | 1.47mi |
| 5080 Aspen Pine Blvd Dublin, OH | 2.0 | 2.0 | 1165 | $1,595 | $1.37 | 44d | 1 | 1.48mi |
| 4978 Aspen Pine Blvd Dublin, OH | 2.0 | 2.0 | 1180 | $1,640 | $1.39 | 7d | 1 | 1.48mi |
| 5137 Foxtail Pine St Dublin, OH | 2.0 | 2.0 | 1319 | $1,850 | $1.40 | 44d | 1 | 1.48mi |
| 4918 Stratford Pine Ln Dublin, OH | 2.0 | 1.0 | 950 | $1,440 | $1.52 | 7d | 1 | 1.49mi |
| 5168 Foxtail Pine St Dublin, OH | 2.0 | 2.0 | 1403 | $1,910 | $1.36 | 44d | 1 | 1.49mi |
| 5814 Avery Crest Dr E Dublin, OH | 1.0–3.0 | 1.0–2.0 | 971 | $1,990 | $2.05 | 44d | 1 | 1.49mi |
HOA detail condo
- Monthly dues
- $220 · $2,640/yr
- Assessments
- None detected in remarks — confirm with the listing agent.
Listing history 16 events
-
2026-06-18days on market $190,000 Active 45 DOM
-
2026-06-17days on market $190,000 Active 44 DOM
-
2026-06-16days on market $190,000 Active 43 DOM
-
2026-06-15days on market $190,000 Active 42 DOM
-
2026-06-13days on market $190,000 Active 40 DOM
-
2026-06-09days on market $190,000 Active 36 DOM
-
2026-06-08days on market $190,000 Active 35 DOM
-
2026-06-07days on market $190,000 Active 34 DOM
-
2026-06-05days on market $190,000 Active 31 DOM
-
2026-06-03days on market $190,000 Active 30 DOM
-
2026-06-02days on market $190,000 Active 29 DOM
-
2026-06-01days on market $190,000 Active 28 DOM
-
2026-05-31days on market $190,000 Active 27 DOM
-
2026-05-04$190,000 Active 149-char remark
-
2004-10-04soldstatus $75,000
-
1995-02-02soldstatus $2,530,000
ⓘ Source: listings_history table (triggers on properties + properties_extension) + one-shot
backfill from property_details.listing_events for pre-trigger history.
Tax reassessment forecast OH · Partial reset (capped growth)
- Current annual tax
- $4,056 · $338/mo
- Projected year-2 tax
- $4,056 · $338/mo
- Expected delta
- $0/yr ($0/mo · 0.0%)
ⓘ Screening estimate from a state-policy table — verify with the county assessor before closing.
Climate risk First Street
- Flood 1/10 Low FEMA zone X (unshaded) · 0% chance over 30 yrs
- Wildfire 1/10 Low
- Heat 3/10 Moderate 7 d/yr ≥100°F today · 18 d/yr by 30 yrs out
- Wind 2/10 Low 100% chance of damaging wind over 30 yrs
- Air quality 3/10 Moderate 2 unhealthy d/yr today · 4 by 30 yrs out
Nearby sold comps map
Loading sold comps map…
Walkable amenities ~0.75 mi
Loading nearby amenities…
Taxation est. · year 1
- Rental income
- $24,754
- − Mortgage interest
- −$10,643
- − Property taxes
- −$4,056
- − Insurance
- −$950
- − Repairs & maintenance
- −$1,980
- − Management
- −$1,980
- − HOA
- −$2,640
- − Depreciation
- −$5,527
- Taxable loss
- −$3,023
- Est. tax savings @ 24.0%
- +$726
- After-tax cash flow
- $678/yr
For passive investors: Depreciation is non-cash, so a rental often shows a tax loss while cash-flowing — sheltering income. Rental losses are passive: they offset passive income freely, and up to $25,000/yr can offset ordinary (W-2) income if you actively participate and your MAGI is under $100k (phasing out to $0 by $150k); unused losses carry forward. On sale, claimed depreciation is recaptured at up to 25%, and gains may owe capital-gains tax (a 1031 exchange can defer both). Figures are a year-1 estimate at your 24.0% rate — not tax advice; consult a CPA.
Schools (NCES district)
- District
- Hilliard City
- NCES district ID
- 3904701
- Math proficiency
- 57% ▼ -14.00%
- Reading proficiency
- 62% ▼ -6.00%
- Median HH income
- $77,944
- Composite
- 53.32/100
- National rank
- #1479
- State rank
- #246 of 656 in OH
Livability — Hilliard
- Score
- 87/100
- State rank
- #34
- US rank
- #331
Category grades
Schools grade is shown separately in the Schools card above.
Census & demographics
- Census place
- Hilliard, OH
- County
- Franklin County · 1,351,780 people
- City population
- 65,238
- Metro
- Columbus, OH
- Population (ZIP)
- 65,238
- Household income
- $111,440
- Rent vs Own
- Severe rent burden
- 1356.0
Population outlook (Franklin County) Hauer SSP2
- Today (2025)
- 1,456,139 people
- By 2030
- 1,556,890 · +6.9%
- By 2040
- 1,757,349 · +20.7%
- By 2050
- 1,950,539 · +34.0%
- By 2075
- 2,376,171 · +63.2%
- By 2100
- 2,636,796 · +81.1%
Race, ethnicity, and origin ACS 2023
- Neighborhood character
- Predominantly White (76%)
- Race & ethnicity
- White 76% Two or more races 7% Asian 6% Black 6% Hispanic / Latino 6%
- Hispanic origin (detail)
- Mexican 2%
- Common ancestry
- Romanian 4% Italian 2% Lithuanian 2%
- Foreign-born
- 11% · Canada, China
- Languages at home
- 85% English-only · Spanish 4% Other Indo-European 3% Arabic 2%
Political lean MEDSL · Franklin
- 2024 margin
- Strong D (+28.4) · D 63.7% · R 35.3% · Other 1.0%
- 2008→2024 swing
- +7.7pp toward D · 2008: 20.7pp · 2024: 28.4pp
- All cycles
- 2024: D+28.4 2020: D+31.4 2016: D+25.9 2012: D+21.7 2008: D+20.7
Not yet ingested
- Civics
- —
Market trends
- HPI YoY
- ▼ -277.31%
- Current HPI
- 268.491
- Rent YoY
- ▲ 1.25%
- Metro
- Columbus, OH
- State GDP YoY
- ▲ 1.98%
- F500 in state
- 48
Industry mix (Fortune 500 HQ in OH)
| Industry | F500 HQs | Revenue |
|---|---|---|
| Insurance | 3 | $145B |
|
||
| Industrial Machinery | 3 | $49B |
|
||
| Financial Services | 3 | $24B |
|
||
| Consumer Goods | 2 | $93B |
|
||
| Aerospace / Defense | 2 | $47B |
|
||
| Utilities | 2 | $33B |
|
||
Price history
-92.5% since first listed3 events — show timeline
- 2026-05-04 Listed $190,000 CBRMLS
- 2004-10-04 Sold (Public Records) $75,000 Public Records
- 1995-02-02 Sold (Public Records) $2,530,000 Public Records
Property tax history
+7.0%/yrLatest (2024): $4,056 · +22.8% YoY. Source: county tax records.
Cash-flow waterfall
monthlySold comps — $/sqft
last 12 mo · ≤1 miLoading sold comps…