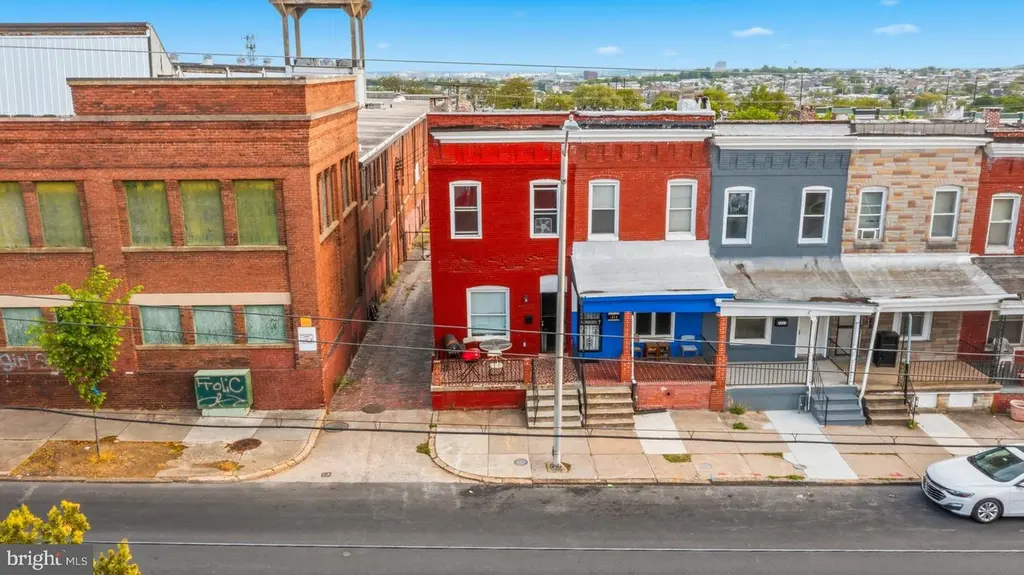
2815 E Preston St · Baltimore, MD
Flood risk 1/10 · Minimal
- FEMA flood zone
- X (unshaded)
- Chance of flooding over 30 yrs
- 0.0%
- Est. flood insurance / yr
- $473 – $860
Fire risk 1/10 · Minimal
- Est. fire insurance / yr
- $755 – $1,403
Heat risk 8/10 · Major
- Hot days now (above 103°F)
- 7 days/yr
- Hot days in 30 yrs
- 15 days/yr
Wind risk 6/10 · Moderate
- Chance of severe wind over 30 yrs
- 27.0%
Air-quality risk 4/10 · Minor
- Unhealthy air days now
- 6 days/yr
- Unhealthy air days in 30 yrs
- 7 days/yr
Risk factors via First Street. Map © Google.
Why this score? — see what drove the B grade
The composite is a weighted blend of 9 inputs, each scored 0–100. Each bar is that input's sub-score; the figure is the points it added to the 100-point composite (weight × sub-score).
- Cash flow +30.0/30.0
- 1% rule +10.0/10.0
- DSCR +10.0/10.0
- ARV discount +7.5/15.0
- Appreciation +4.7/10.0
- Rent growth +3.8/5.0
- Livability +3.8/5.0
- Condition / age +2.5/5.0
- Schools +1.0/10.0
$49,900
🖨 Deal sheet (PDF) 📄 Offer letter ✓ Due diligence
Listing remarks
Charming Baltimore rowhome offering classic character with strong investment potential. Conveniently located near Johns Hopkins Hospital and major commuter routes, this property is ideal for buyers looking to personalize or investors seeking rental opportunities. Sold as-is with plenty of upside in a growing area. This property is part of a larger portfolio. Please contact for more details regarding associated listings. Closings will need to be coordinated with the other properties in the portfolio but may sell to individual buyers. Seller will only accept offers from serious buyers who can align with that timeline.
Key facts
- Baltimore rowhome
- Built 1910
- Listed 38 days
Tags
Property features AI
Finance
- Other: Total below-grade area is recorded; Above-grade finished area is recorded
- Financial info: Ownership interest: Ground Rent; Land assessed value recorded; Improvement assessed value recorded; Annual ground rent listed as an income/expense item
Exterior
- Parking: On-street parking
- Utilities: Public water; Public sewer; Power and other utilities not specified
- Home design: Interior townhouse/rowhouse; Built-up roof; Ground rent exists (semi-annual payment of $90)
- Construction: Brick construction; Block foundation; Other structures both above and below grade; Year built information sourced from assessor
- Exterior features: Above-grade finished living space; Below-grade unfinished area
Interior
- Bedrooms: Three bedrooms on the first upper level
- Bathrooms: One full bathroom
- Heating & cooling: Heating: Other; Cooling: Other; Hot water: Natural gas
- Interior features: Basement with a connecting stairway; Living area information sourced from assessor
Neighborhood map
What this means for you Summary
Snapshot
- This is a 3-bed/1.0-bath townhouse listed at $50k.
Deal economics
- At list price, monthly cash flow is $1k ($13k/yr) — positive.
- The deal already cash-flows at list — no discount required.
- Meets the 1% rule at list price ($2k rent vs $50k).
- Recommended offer: $48k (3.0% below list) — sets the bar for market timing.
- Cap rate 32.8% vs local median 6.0% in Baltimore — top-decile yield for the area; either an underpriced asset or a hidden risk that comps aren't pricing in. Stress-test before assuming the spread holds.
Location & tenants
- Location reads 76/100 on livability (#90 in MD, #3,396 nationally) — a middle-class / working-renter tenant base. Strengths: amenities A+, commute A+, housing A+; Watch: schools D, crime F.
- Baltimore City Public Schools (urban): math 7% / reading 16% proficiency, ranked #24 of 24 in MD (top 100%) — low school quality limits family demand, transient renter base, plan for 1-2y turnover; 79% free/reduced lunch — lower-income household profile, screen leases tightly.
- Market conditions: Rents rising fast (+5.2%/yr); 319 active listings in the ZIP; 40 comparable units currently listed for rent nearby; rentals lingering (median 45d on market — plan ~5-8 weeks vacancy on turnover, expect pricing pressure); 55% of comp listings sitting > 30 days — soft ceiling on asking rent; 1,273 units permitted in Baltimore city in 2024 (1,104 in 5+ unit buildings).
- This rent runs 43% of the median local income ($51k/yr) — at the standard rent-burdened threshold; future hikes will face affordability resistance.
Forward outlook
- In year one you build about $62 of equity ($345 loan paydown + $-283 appreciation (-0.6% local appreciation)).
- Baltimore County population projected to shrink 4% by 2050 — rents likely to lag national; underwrite the cash flow, not the appreciation.
- At projected returns (-0.6% appreciation + 5.2% rent growth), your $14k cash investment doubles in ~2 years — after that, you're playing with house money.
Negotiation context
- It's been on market 38 days — a 3% lower offer ($48k) is reasonable based on typical stale-listing flexibility.
Risks & watch-outs
- Watch-outs: built in 1910 — expect roof / HVAC / electrical / plumbing capex.
- Climate carrying-cost: major wind risk, 27% chance of damaging wind over 30y; extreme-heat days projected 7→15/yr by 2055 (HVAC capex compounding) — expect insurance premiums to compound above CPI over the hold.
Questions for the listing agent
- It's been on market 38 days. Have you received any prior offers? Is the seller open to a 3% concession, seller financing, or rate buy-down credit?
- Built in 1910 — when were the roof, HVAC, electrical panel, plumbing, and water heater last replaced?
- Is there a deadline driving the sale (1031 exchange, divorce, estate, relocation)? That informs how much negotiation room exists.
- Schools are D-rated, which usually means shorter tenancies and higher turnover. Who's the typical renter profile here, and what's been the actual vacancy rate?
- Crime grade is F in this area — have there been break-ins, vandalism, or insurance claims at this property in the last 3 years? What carrier currently insures it and at what premium?
- What's the average days-on-market for RENTAL listings here right now (not sales)? A rising rental-DOM trend means longer vacancies and softer asking-rent achievability than the comps imply.
- What's the recent tenant-quality profile in this submarket — average credit score on applications, eviction rate, late-payment / NSF rate, and stable-employment percentage? A property-management company in the area should have these aggregated.
- How much new for-sale + rental construction is in the pipeline within 1–3 miles? Heavy new supply typically softens prices + rents 12–24 months out; constrained supply supports both.
Investment metrics
- 1% rule
- 3.67% ✓
- Cap rate
- 32.83%
- Cash-on-cash
- 94.77%
- DSCR
- 5.22
- GRM
- 2.3
CMA / ARV
- ARV (median comp)
- $100,193
- List price
- $49,900
- Delta
- -50.20%
- Verdict
- UNDERPRICED
- Comps
- 20 within 1.0 mi
Show comp detail 12 sales within ~0.75 mi
| Address | Dist | Beds/Ba | Sqft | Sold | Price | $/sf | Match |
|---|---|---|---|---|---|---|---|
| 1418 N Linwood Ave | 0.14mi | 3/1.0 | 1,356 (+3%) | 0mo | $90,000 | $66 | 88 |
| 1411 Kenhill Ave | 0.12mi | 4/2.0 (+1) | 1,356 (+3%) | 1mo | $240,000 | $177 | 80 |
| 2422 E Federal St | 0.37mi | 3/1.0 | 1,350 (+3%) | 2mo | $55,000 | $41 | 77 |
| 2736 Mura St | 0.05mi | 3/2.0 | 1,120 (-15%) | 0mo | $81,000 | $72 | 69 |
| 2811 E Biddle St | 0.07mi | 2/1.0 (-1) | 1,148 (-13%) | 2mo | $75,000 | $65 | 69 |
| 2712 Ashland Ave | 0.32mi | 3/1.5 | 1,164 (-12%) | 1mo | $175,000 | $150 | 63 |
| 2435 Jefferson St | 0.68mi | 3/1.0 | 1,260 (-4%) | 1mo | $140,000 | $111 | 60 |
| 2220 Henneman Ave | 0.45mi | 3/2.5 | 1,440 (+9%) | 1mo | $190,000 | $132 | 56 |
| 3135 Mcelderry St | 0.62mi | 3/2.0 | 1,224 (-7%) | 1mo | $234,000 | $191 | 54 |
| 2703 Jefferson St | 0.63mi | 3/1.0 | 1,170 (-11%) | 2mo | $102,500 | $88 | 51 |
| 1009 N Washington St N | 0.66mi | 2/2.5 (-1) | 1,386 (+5%) | 0mo | $235,000 | $170 | 49 |
| 3238 Ravenwood Ave | 0.66mi | 3/1.5 | 1,158 (-12%) | 0mo | $70,000 | $60 | 46 |
Match score weights: distance 35% · size 25% · config 20% · recency 20%. Top-matched comps best support the ARV.
Projected returns pro-forma
-0.57% appreciation · 5.25% rent growth · sell at horizon
- IRR
- 99.4%
- Equity multiple
- 6.14×
- Total profit
- $71,772
- Equity at exit
- $13,088
- IRR
- —
- Equity multiple
- 13.63×
- Total profit
- $176,434
- Equity at exit
- $14,654
Cash invested: $13,972 (down + closing). Projections, not guarantees.
Landlord ↔ Tenant lean methodology
- Overall (CITY)
- 12 Strongly Tenant-Friendly
- State Maryland
- 27 Tenant-Leaning · D+14
- County
- — inherits STATE
- City Baltimore
- 12 Strongly Tenant-Friendly · D+58
ZIP-level market 21213
- Home prices YoY
- -0.1%
- Rents YoY
- 5.2%
- Active inventory
- 319
- Price-to-rent
- 2.3×
Monthly cashflow live
- Estimated rent
- $1,833 high interval (Pro) →
- Mortgage (P&I)
- −$262
- Tax est. 1.5%
- −$62 /mo · $748/yr
- Insurance
- −$21
- HOA
- −$0
- Vacancy / Maint / Mgmt
- −$385
- Net cashflow
- $1,103
Break-even live
Sensitivity live
| Price | -10% $1,138 | -5% $1,121 | +0% $1,103 | +5% $1,086 | +10% $1,069 |
|---|---|---|---|---|---|
| Rent | -10% $959 | -5% $1,031 | +0% $1,103 | +5% $1,176 | +10% $1,248 |
| Rate | -1.0pp $1,129 | -0.5pp $1,116 | base $1,103 | +0.5pp $1,090 | +1.0pp $1,077 |
UW: 25.0% down · 7.5% · 30yr · 1.5% tax · 5.0% vac · 8.0% maint · 8.0% mgmt
Financing live
Cash to close
- Down payment
- $12,475
- Closing costs
- $1,497
- Reserves months
- —
- Total cash needed
- —
Loan-product check · same deal, 3 products live
Conventional
25% down · 7.5% · 30yr
- Down + closing
- —
- Monthly P&I
- —
- Monthly cashflow
- —
- DSCR
- —
- Eligible?
- —
Personal DTI + credit; lowest rate.
DSCR
20% down · 8.5% · 30yr
- Down + closing
- —
- Monthly P&I
- —
- Monthly cashflow
- —
- DSCR
- —
- Eligible?
- —
No personal income docs; deal must DSCR.
Hard money
10% down · 12.0% · 12mo
- Down + closing
- —
- Monthly P&I
- —
- Monthly cashflow
- —
- DSCR
- —
- Eligible?
- —
Short-term bridge; refi at stabilization.
Rent comps 40 comps
| Address | Beds | Baths | Sqft | Rent | $/sqft | DOM | Units | Dist |
|---|---|---|---|---|---|---|---|---|
| 1323 N Kenwood Ave Unit 1 Baltimore, MD | 2.0 | 1.5 | 1060 | $1,350 | $1.27 | 24d | 1 | 0.05mi |
| 2706 E Biddle St Baltimore, MD | 3.0 | 2.0 | 1577 | $1,395 | $0.88 | 44d | 1 | 0.10mi |
| 2626 E Preston St Baltimore, MD | 3.0 | 1.0 | 1136 | $1,800 | $1.58 | 44d | 1 | 0.12mi |
| 1403 N Linwood Ave Baltimore, MD | 3.0 | 2.0 | 1660 | $1,995 | $1.20 | 44d | 1 | 0.12mi |
| 2621 E Oliver St Baltimore, MD | 3.0 | 2.0 | 1600 | $1,700 | $1.06 | 24d | 1 | 0.19mi |
| 1310 N Ellwood Ave Baltimore, MD | 2.0 | 1.0 | 1000 | $1,450 | $1.45 | 13d | 1 | 0.21mi |
| 1310 N Ellwood Ave #1 Baltimore, MD | 2.0 | 1.0 | 1000 | $1,550 | $1.55 | 22d | 1 | 0.22mi |
| 1215 N Ellwood Ave Baltimore, MD | 3.0 | 1.0 | 1128 | $1,795 | $1.59 | 24d | 1 | 0.22mi |
| 2430 E Biddle St Baltimore, MD | 2.0 | 2.0 | 1300 | $2,000 | $1.54 | 44d | 1 | 0.29mi |
| 2522 E Federal St Baltimore, MD | 2.0 | 2.0 | 1760 | $1,400 | $0.80 | 44d | 1 | 0.30mi |
| 2729 Ashland Ave Baltimore, MD | 3.0 | 1.0 | 1000 | $1,350 | $1.35 | 3d | 1 | 0.35mi |
| 809 N Curley St Baltimore, MD | 3.0 | 1.0 | 1746 | $1,400 | $0.80 | 22d | 1 | 0.39mi |
| 2815 E Madison St Baltimore, MD | 4.0 | 2.0 | 1300 | $2,500 | $1.92 | 44d | 1 | 0.42mi |
| 724 N Curley St Baltimore, MD | 3.0 | 3.0 | 1500 | $2,200 | $1.47 | 5d | 1 | 0.44mi |
| 718 N Curley St Baltimore, MD | 3.0 | 3.0 | 1500 | $2,000 | $1.33 | 5d | 1 | 0.44mi |
| 2215 E Biddle St Baltimore, MD | 2.0 | 2.5 | 1350 | $1,800 | $1.33 | 44d | 1 | 0.47mi |
| 2934 E Monument St Baltimore, MD | 2.0 | 1.0 | 1200 | $1,499 | $1.25 | 44d | 1 | 0.48mi |
| 2311 E Lafayette Ave Baltimore, MD | 3.0 | 1.0 | 1000 | $1,400 | $1.40 | 44d | 1 | 0.51mi |
| 2202 Prentiss Pl Baltimore, MD | 3.0 | 2.0 | 1400 | $2,400 | $1.71 | 44d | 1 | 0.51mi |
| 627 N Lakewood Ave Baltimore, MD | 3.0 | 2.5 | 1175 | $1,900 | $1.62 | 22d | 1 | 0.53mi |
| 720 N Port St Baltimore, MD | 2.0 | 1.0 | 950 | $1,300 | $1.37 | 44d | 1 | 0.53mi |
| 2608 McElderry St Baltimore, MD | 3.0 | 1.0 | 1144 | $1,550 | $1.35 | 24d | 1 | 0.57mi |
| 531 N Belnord Ave Baltimore, MD | 2.0 | 1.5 | 1100 | $1,700 | $1.55 | 24d | 1 | 0.58mi |
| 537 N Lakewood Ave Baltimore, MD | 3.0 | 3.5 | 1755 | $2,050 | $1.17 | 44d | 1 | 0.58mi |
| 533 N Lakewood Ave Baltimore, MD | 4.0 | 3.5 | 1758 | $4,500 | $2.56 | 44d | 1 | 0.58mi |
| 539 N Luzerne Ave Baltimore, MD | 3.0 | 2.5 | 1702 | $2,300 | $1.35 | 44d | 1 | 0.59mi |
| 821 N Collington Ave Baltimore, MD | 3.0 | 2.0 | 1150 | $1,950 | $1.70 | 44d | 1 | 0.61mi |
| 520 N Decker Ave Baltimore, MD | 2.0 | 1.0 | 1000 | $1,650 | $1.65 | 44d | 1 | 0.62mi |
| 618 N Montford Ave Baltimore, MD | 3.0 | 1.0 | 1050 | $1,468 | $1.40 | 15d | 1 | 0.62mi |
| 618 N Montford Ave Baltimore, MD | 3.0 | 1.0 | 1050 | $1,468 | $1.40 | 44d | 1 | 0.62mi |
| 2431 McElderry St Baltimore, MD | 4.0 | 2.5 | 1600 | $2,100 | $1.31 | 44d | 1 | 0.63mi |
| 2903 Jefferson St Baltimore, MD | 3.0 | 3.0 | 1609 | $1,850 | $1.15 | 44d | 1 | 0.64mi |
| 3304 McElderry St Baltimore, MD | 3.0 | 2.0 | 1413 | $1,900 | $1.34 | 44d | 1 | 0.64mi |
| 3343 Ravenwood Ave Unit 3343 Baltimore, MD | 2.0 | 2.0 | 948 | $1,855 | $1.96 | 18d | 1 | 0.64mi |
| 2212 E Monument St Unit 2 Baltimore, MD | 2.0 | 1.0 | 1200 | $1,550 | $1.29 | 18d | 1 | 0.66mi |
| 3322 Ravenwood Ave Baltimore, MD | 3.0 | 2.0 | 932 | $1,800 | $1.93 | 24d | 1 | 0.66mi |
| 415 N Belnord Ave Baltimore, MD | 2.0 | 1.0 | 1008 | $1,300 | $1.29 | 24d | 1 | 0.67mi |
| 415 N Glover St Baltimore, MD | 2.0 | 2.5 | 1092 | $1,600 | $1.47 | 24d | 1 | 0.68mi |
| 3339 Elmora Ave Baltimore, MD | 3.0 | 2.0 | 896 | $1,600 | $1.79 | 44d | 1 | 0.68mi |
| 712 N Duncan St Baltimore, MD | 2.0 | 1.5 | 1000 | $2,000 | $2.00 | 44d | 1 | 0.69mi |
Listing history 10 events
-
2026-06-10statusdays on market $49,900 Pending 38 DOM
-
2026-06-04days on market $49,900 Active 36 DOM
-
2026-06-03days on market $49,900 Active 35 DOM
-
2026-06-02days on market $49,900 Active 34 DOM
-
2026-06-02price $49,900 Active 33 DOM
-
2026-06-01days on market $65,000 Active 33 DOM
-
2026-05-31days on market $65,000 Active 32 DOM
-
2026-05-15price $65,000 623-char remark
-
2026-05-07price $70,000 623-char remark
-
2026-04-29$75,000 Active 623-char remark
ⓘ Source: listings_history table (triggers on properties + properties_extension) + one-shot
backfill from property_details.listing_events for pre-trigger history.
Climate risk First Street
- Flood 1/10 Low FEMA zone X (unshaded) · 0% chance over 30 yrs
- Wildfire 1/10 Low
- Heat 8/10 Severe 7 d/yr ≥103°F today · 15 d/yr by 30 yrs out
- Wind 6/10 Major 27% chance of damaging wind over 30 yrs
- Air quality 4/10 Moderate 6 unhealthy d/yr today · 7 by 30 yrs out
Nearby sold comps map
Loading sold comps map…
Walkable amenities ~0.75 mi
Loading nearby amenities…
Taxation est. · year 1
- Rental income
- $21,999
- − Mortgage interest
- −$2,795
- − Property taxes
- −$748
- − Insurance
- −$250
- − Repairs & maintenance
- −$1,760
- − Management
- −$1,760
- − Depreciation
- −$1,452
- Taxable income
- $13,234
- Est. tax owed @ 24.0%
- −$3,176
- After-tax cash flow
- $10,065/yr
For passive investors: Depreciation is non-cash, so a rental often shows a tax loss while cash-flowing — sheltering income. Rental losses are passive: they offset passive income freely, and up to $25,000/yr can offset ordinary (W-2) income if you actively participate and your MAGI is under $100k (phasing out to $0 by $150k); unused losses carry forward. On sale, claimed depreciation is recaptured at up to 25%, and gains may owe capital-gains tax (a 1031 exchange can defer both). Figures are a year-1 estimate at your 24.0% rate — not tax advice; consult a CPA.
Schools (NCES district)
- District
- Baltimore City Public Schools
- NCES district ID
- 2400090
- Math proficiency
- 7% ▼ -9.00%
- Reading proficiency
- 16% ▼ -5.00%
- Median HH income
- $42,108
- Composite
- 10.08/100
- National rank
- #9805
- State rank
- #24 of 24 in MD
Livability — Baltimore
- Score
- 76/100
- State rank
- #90
- US rank
- #3396
Category grades
Schools grade is shown separately in the Schools card above.
Census & demographics
- Census place
- Baltimore, MD
- County
- Baltimore City · 558,601 people
- City population
- 588,727
- Metro
- Baltimore-Columbia-Towson, MD
- Population (ZIP)
- 28,058
- Household income
- $51,344
- Rent vs Own
- Severe rent burden
- 1868.0
Population outlook (Baltimore County) Hauer SSP2
- Today (2025)
- 624,249 people
- By 2030
- 621,541 · -0.4%
- By 2040
- 609,756 · -2.3%
- By 2050
- 597,249 · -4.3%
- By 2075
- 552,236 · -11.5%
- By 2100
- 513,934 · -17.7%
Race, ethnicity, and origin ACS 2023
- Neighborhood character
- Predominantly Black (86%)
- Race & ethnicity
- Black 86% White 6% Hispanic / Latino 4% Two or more races 3%
- Foreign-born
- 3% · Canada
- Languages at home
- 96% English-only · Spanish 3%
Political lean MEDSL · Baltimore
- 2024 margin
- Solid D (+73.0) · D 85.2% · R 12.2% · Other 2.6%
- 2008→2024 swing
- -2.5pp toward R · 2008: 75.5pp · 2024: 73.0pp
- All cycles
- 2024: D+73.0 2020: D+76.6 2016: D+74.6 2012: D+76.4 2008: D+75.5
Not yet ingested
- Civics
- —
Market trends
- HPI YoY
- ▼ -0.57%
- Current HPI
- 427.4453
- Rent YoY
- ▲ 5.25%
- Metro
- Baltimore-Columbia-Towson, MD
- State GDP YoY
- ▲ 2.97%
- F500 in state
- 12
Industry mix (Fortune 500 HQ in MD)
| Industry | F500 HQs | Revenue |
|---|---|---|
| Aerospace / Defense | 1 | $71B |
|
||
| Utilities | 1 | $25B |
|
||
| Hotels | 1 | $24B |
|
||
| Consumer Goods | 1 | $7B |
|
||
| Real Estate | 1 | $6B |
|
||
| Chemicals | 1 | $2B |
|
||
Price history
-33.5% since first listed6 events — show timeline
- 2026-06-09 Pending — BRIGHT MLS
- 2026-06-06 Listing Removed — BRIGHT MLS
- 2026-06-01 Price Changed $49,900 BRIGHT MLS
- 2026-05-15 Price Changed $65,000 BRIGHT MLS
- 2026-05-07 Price Changed $70,000 BRIGHT MLS
- 2026-04-29 Listed $75,000 BRIGHT MLS
Property tax history
+5.7%/yrLatest (2025): $2,835 · +15.0% YoY. Source: county tax records.
Cash-flow waterfall
monthlySold comps — $/sqft
last 12 mo · ≤1 miLoading sold comps…