1532 N Capitol St NW · Washington, DC
Flood risk No data
- FEMA flood zone
- —
- Chance of flooding over 30 yrs
- —
- Est. flood insurance / yr
- —
Fire risk No data
- Est. fire insurance / yr
- —
Heat risk No data
- Hot days now (above threshold)
- —
- Hot days in 30 yrs
- —
Wind risk No data
- Chance of severe wind over 30 yrs
- —
Air-quality risk No data
- Unhealthy air days now
- —
- Unhealthy air days in 30 yrs
- —
Risk factors via First Street. Map © Google.
Why this score? — see what drove the B- grade
The composite is a weighted blend of 9 inputs, each scored 0–100. Each bar is that input's sub-score; the figure is the points it added to the 100-point composite (weight × sub-score).
- Cash flow +29.1/30.0
- DSCR +10.0/10.0
- 1% rule +8.1/10.0
- ARV discount +7.5/15.0
- Condition / age +3.8/5.0
- Livability +3.7/5.0
- Schools +3.6/10.0
- Rent growth +1.7/5.0
- Appreciation +0.0/10.0
$204,000
🖨 Deal sheet 📄 Offer letter ✓ Due diligence
Listing remarks
The price is negotiable!! This is a 60% MFI 2-bedroom resale unit. The maximum allowable incomes are: $74,280 (2 people); $83,580 (3 people); $92,820 (4 people); $100,260 (5 people).
Key facts
- Built 2020
Property features AI
Exterior
- Home design: Built in 2020
- Exterior features: Located in the Northwest Washington subdivision
Neighborhood map
What this means for you Summary
Snapshot
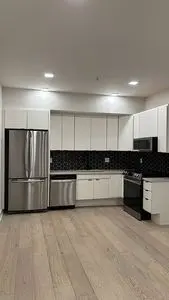
- This is a 2-bed/2.0-bath single-family listed at $204k. Condition is rated good.
Deal economics
- At list price, monthly cash flow is $707 ($8k/yr) — positive.
- The deal already cash-flows at list — no discount required.
- Meets the 1% rule at list price ($3k rent vs $204k).
- Cap rate 10.4% vs local median 2.5% in Washington — top-decile yield for the area; either an underpriced asset or a hidden risk that comps aren't pricing in. Stress-test before assuming the spread holds.
Location & tenants
- Location reads 73/100 on livability (#1 in DC) — a middle-class / working-renter tenant base. Strengths: amenities A+, commute A+, employment A+; Watch: crime F, cost of living F.
- District Of Columbia Public Schools (urban): math 33% / reading 40% proficiency, ranked #8 of 32 in DC (top 25%) — families likely to look elsewhere, expect single-tenant / working-renter base with shorter leases; 65% free/reduced lunch — lower-income household profile, screen leases tightly.
- Market conditions: Rents falling (-3.0%/yr); 548 active listings in the ZIP; 40 comparable units currently listed for rent nearby; rentals at typical pace (median 20d on market — plan ~3-4 weeks tenant-placement turnaround); high-income renter base; 1,737 units permitted in District of Columbia in 2024 (1,506 in 5+ unit buildings).
Forward outlook
- Local home prices are declining (-3.0%/yr); year-one equity from $1k of loan paydown is wiped out by about $6k of value loss. Plan a longer hold.
- District of Columbia County population projected at +50% by 2050 — long-run rental-demand tailwind backs the buy-and-hold thesis.
Negotiation context
- Only 1 days on market — expect competitive offers; lowballing is unlikely to land.
- 2 sale attempts with the ask held roughly flat each time — persistent listings suggest the price (not the market) is what's stuck; bring a comps-based counter.
Questions for the listing agent
- Is there a deadline driving the sale (1031 exchange, divorce, estate, relocation)? That informs how much negotiation room exists.
- Crime grade is F in this area — have there been break-ins, vandalism, or insurance claims at this property in the last 3 years? What carrier currently insures it and at what premium?
- What's the average days-on-market for RENTAL listings here right now (not sales)? A rising rental-DOM trend means longer vacancies and softer asking-rent achievability than the comps imply.
- What's the recent tenant-quality profile in this submarket — average credit score on applications, eviction rate, late-payment / NSF rate, and stable-employment percentage? A property-management company in the area should have these aggregated.
- How much new for-sale + rental construction is in the pipeline within 1–3 miles? Heavy new supply typically softens prices + rents 12–24 months out; constrained supply supports both.
Investment metrics
- 1% rule
- 1.31% ✓
- Cap rate
- 10.45%
- Cash-on-cash
- 14.84%
- DSCR
- 1.66
- GRM
- 6.3
CMA / ARV
No comps found within radius.
Projected returns pro-forma
-3.0% appreciation · 0.0% rent growth · sell at horizon
- IRR
- 2.0%
- Equity multiple
- 1.07×
- Total profit
- $4,132
- Equity at exit
- $30,417
- IRR
- 8.3%
- Equity multiple
- 1.55×
- Total profit
- $31,366
- Equity at exit
- $17,638
Cash invested: $57,120 (down + closing). Projections, not guarantees.
Landlord ↔ Tenant lean methodology
- Overall (CITY)
- 0 Strongly Tenant-Friendly
- State District of Columbia
- 12 Strongly Tenant-Friendly · D+43
- County
- — inherits STATE
- City Washington
- 0 Strongly Tenant-Friendly · D+43
ZIP-level market 20002
- Rents YoY
- -3.0%
- Active inventory
- 548
- Price-to-rent
- 6.3×
Monthly cashflow live
- Estimated rent
- $2,679 high interval (Pro) →
- Mortgage (P&I)
- −$1,070
- Tax est. 1.5%
- −$255 /mo · $3,060/yr
- Insurance
- −$85
- HOA
- −$0
- Vacancy / Maint / Mgmt
- −$563
- Net cashflow
- $707
Break-even live
UW: 25.0% down · 7.5% · 30yr · 1.5% tax · 5.0% vac · 8.0% maint · 8.0% mgmt
Financing live
Cash to close
- Down payment
- $51,000
- Closing costs
- $6,120
- Reserves months
- —
- Total cash needed
- —
Loan-product check · same deal, 3 products live
Conventional
25% down · 7.5% · 30yr
- Down + closing
- —
- Monthly P&I
- —
- Monthly cashflow
- —
- DSCR
- —
- Eligible?
- —
Personal DTI + credit; lowest rate.
DSCR
20% down · 8.5% · 30yr
- Down + closing
- —
- Monthly P&I
- —
- Monthly cashflow
- —
- DSCR
- —
- Eligible?
- —
No personal income docs; deal must DSCR.
Hard money
10% down · 12.0% · 12mo
- Down + closing
- —
- Monthly P&I
- —
- Monthly cashflow
- —
- DSCR
- —
- Eligible?
- —
Short-term bridge; refi at stabilization.
Rent comps 40 comps
| Address | Beds | Baths | Sqft | Rent | $/sqft | DOM | Units | Dist |
|---|---|---|---|---|---|---|---|---|
| 1 Florida Ave NE Washington, DC | 2.0 | 1.0–2.0 | 703 | $4,223 | $6.00 | 1d | 29 | 0.05mi |
| 27 Florida Ave NW Unit 2 Washington, DC | 2.0 | 1.0 | 800 | $2,100 | $2.62 | 24d | 1 | 0.06mi |
| 33 Florida Ave NE Unit 3 Washington, DC | 2.0 | 1.0 | 910 | $2,150 | $2.36 | 24d | 1 | 0.10mi |
| 50 Florida Ave NE Washington, DC | 1.0–2.0 | 1.0–2.0 | 783 | $3,200 | $4.08 | 24d | 4 | 0.10mi |
| 50 Florida Ave NE Washington, DC | 1.0–2.0 | 1.0–2.0 | 783 | $3,000 | $3.83 | 10d | 3 | 0.10mi |
| 50 Florida Ave NE Washington, DC | 1.0–2.0 | 1.0–2.0 | 787 | $3,000 | $3.81 | 19d | 3 | 0.10mi |
| 50 Florida Ave NE Washington, DC | 1.0–2.0 | 1.0–2.0 | 787 | $3,000 | $3.81 | 18d | 4 | 0.10mi |
| 46 Quincy Pl NE #1 Washington, DC | 1.0 | 1.0 | 850 | $2,400 | $2.82 | 16d | 1 | 0.12mi |
| 1527 1st St NW Washington, DC | 2.0 | 1.0 | 700 | $1,850 | $2.64 | 24d | 1 | 0.16mi |
| 1615 1st St NW Washington, DC | 1.0 | 1.0 | 750 | $2,250 | $3.00 | 24d | 1 | 0.16mi |
| 1615 1st St NW #3 Washington, DC | 1.0 | 1.5 | 750 | $2,250 | $3.00 | 24d | 1 | 0.16mi |
| 27 O St NW Washington, DC | 1.0–2.0 | 1.0 | 771 | $1,750 | $2.27 | 7d | 19 | 0.17mi |
| 1740 N Capitol St NW Unit 1 Washington, DC | 1.0 | 1.0 | 950 | $2,000 | $2.11 | 13d | 1 | 0.20mi |
| 1324 N Capitol St NW #1 Washington, DC | 1.0 | 1.0 | 571 | $1,599 | $2.80 | 24d | 1 | 0.20mi |
| 1324 N Capitol St NW Unit 504 Washington, DC | 1.0 | 1.5 | 773 | $2,649 | $3.43 | 24d | 1 | 0.20mi |
| 1324 N Capitol St NW Washington, DC | 2.0 | 1.0–2.0 | 613 | $3,799 | $6.19 | 3d | 14 | 0.20mi |
| 1324 N Capitol St NW Unit 401 Washington, DC | 2.0 | 2.0 | 838 | $3,099 | $3.70 | 24d | 1 | 0.20mi |
| 1324 N Capitol St NE Unit 204 Washington, DC | 1.0 | 1.5 | 773 | $2,499 | $3.23 | 24d | 1 | 0.20mi |
| 1324 N Capitol St NE Unit 201 Washington, DC | 2.0 | 2.0 | 838 | $2,899 | $3.46 | 24d | 1 | 0.20mi |
| 1324 N Capitol St NE Unit 107 Washington, DC | 1.0 | 1.0 | 560 | $1,899 | $3.39 | 24d | 1 | 0.20mi |
| 1324 N Capitol St NE Unit 005 Washington, DC | 1.0 | 1.0 | 531 | $1,699 | $3.20 | 24d | 1 | 0.20mi |
| 1324 N Capitol St NE Unit 602 Washington, DC | 2.0 | 2.0 | 797 | $3,799 | $4.77 | 2d | 1 | 0.20mi |
| 1324 N Capitol St NE Unit 604 Washington, DC | 2.0 | 2.0 | 767 | $3,749 | $4.89 | 24d | 1 | 0.20mi |
| 1324 N Capitol St NE Unit 206 Washington, DC | 1.0 | 1.0 | 569 | $2,099 | $3.69 | 24d | 1 | 0.20mi |
| 1324 N Capitol St NE Unit 309 Washington, DC | 1.0 | 1.0 | 611 | $2,199 | $3.60 | 24d | 1 | 0.20mi |
| 1324 N Capitol St NE Unit 601 Washington, DC | 1.0 | 1.0 | 610 | $2,799 | $4.59 | 24d | 1 | 0.20mi |
| 1324 N Capitol St NE Unit 212 Washington, DC | 2.0 | 2.0 | 767 | $2,799 | $3.65 | 3d | 1 | 0.20mi |
| 1324 N Capitol St NE Unit 205 Washington, DC | 1.0 | 1.0 | 569 | $2,099 | $3.69 | 7d | 1 | 0.20mi |
| 43 Hanover Pl NW #2 Washington, DC | 2.0 | 2.5 | 940 | $3,100 | $3.30 | 18d | 1 | 0.22mi |
| 1712 1st St NW Unit B Washington, DC | 1.0 | 1.0 | 600 | $1,995 | $3.33 | 2d | 1 | 0.23mi |
| 1810 N Capitol St NW Washington, DC | 2.0 | 2.0 | 850 | $3,000 | $3.53 | 19d | 1 | 0.24mi |
| 1718 1st St NW #4 Washington, DC | 2.0 | 2.0 | 875 | $2,850 | $3.26 | 14d | 1 | 0.24mi |
| 1810 N Capitol St NW Unit 1 Washington, DC | 2.0 | 2.0 | 850 | $3,000 | $3.53 | 24d | 1 | 0.24mi |
| 149 R St NE #1 Washington, DC | 2.0 | 1.0 | 815 | $2,850 | $3.50 | 24d | 1 | 0.25mi |
| 7 New York Ave NE Washington, DC | 4.0 | 1.0–3.0 | 1096 | $4,832 | $4.41 | 1d | 11 | 0.25mi |
| 151 Q St NE Washington, DC | 2.0 | 2.0 | 927 | $2,991 | $3.22 | 1d | 56 | 0.26mi |
| 1625 Eckington Pl NE Washington, DC | 1.0–2.0 | 1.0–2.0 | 777 | $3,500 | $4.50 | 18d | 4 | 0.28mi |
| 1625 Eckington Pl NE Washington, DC | 1.0–2.0 | 1.0–2.0 | 784 | $3,450 | $4.40 | 3d | 3 | 0.28mi |
| 1625 Eckington Pl NE Washington, DC | 1.0–2.0 | 1.0–2.0 | 784 | $3,450 | $4.40 | 4d | 4 | 0.28mi |
| 1625 Eckington Pl NE Washington, DC | 2.0 | 2.0 | 932 | $3,275 | $3.51 | 3d | 2 | 0.28mi |
Listing history 3 events
-
2026-05-26$204,000 Active
-
2025-10-10historical $3,100
-
2025-09-30$3,100
ⓘ Source: listings_history table (triggers on properties + properties_extension) + one-shot
backfill from property_details.listing_events for pre-trigger history.
Nearby sold comps map
Loading sold comps map…
Walkable amenities ~0.75 mi
Loading nearby amenities…
Taxation est. · year 1
- Rental income
- $32,147
- − Mortgage interest
- −$11,427
- − Property taxes
- −$3,060
- − Insurance
- −$1,020
- − Repairs & maintenance
- −$2,572
- − Management
- −$2,572
- − Depreciation
- −$5,935
- Taxable income
- $5,562
- Est. tax owed @ 24.0%
- −$1,335
- After-tax cash flow
- $7,144/yr
For passive investors: Depreciation is non-cash, so a rental often shows a tax loss while cash-flowing — sheltering income. Rental losses are passive: they offset passive income freely, and up to $25,000/yr can offset ordinary (W-2) income if you actively participate and your MAGI is under $100k (phasing out to $0 by $150k); unused losses carry forward. On sale, claimed depreciation is recaptured at up to 25%, and gains may owe capital-gains tax (a 1031 exchange can defer both). Figures are a year-1 estimate at your 24.0% rate — not tax advice; consult a CPA.
Condition & rehab AI · 2 photos
This 2-bedroom home is in good condition with modern appliances and a clean interior. It has potential for further value increases with exterior painting and energy-efficient window upgrades.
Value-add opportunities
- Both Paint the exterior — Enhances curb appeal and value
- Both Replace old windows with energy-efficient ones — Improves energy efficiency and aesthetics
- Both Install smart home devices — Enhances convenience and marketability
Renovation cost estimate screening
Value-add ROI direction
- Both Paint the exterior — Enhances curb appeal and value ↑
- Both Replace old windows with energy-efficient ones — Improves energy efficiency and aesthetics ↑
- Both Install smart home devices — Enhances convenience and marketability ↑
ⓘ Cost ranges are severity-bucket heuristics (US national rule-of-thumb). Get contractor quotes + a written scope before underwriting a rehab budget.
Schools (NCES district)
- District
- District Of Columbia Public Schools
- NCES district ID
- 1100030
- Math proficiency
- 33% ▲ 3.00%
- Reading proficiency
- 40% ▲ 5.00%
- Median HH income
- $67,671
- Composite
- 35.84/100
- National rank
- #9606
- State rank
- #8 of 32 in DC
Livability — Washington
- Score
- 73/100
- State rank
- #1
- US rank
- #5327
Category grades
Schools grade is shown separately in the Schools card above.
Census & demographics
- Census place
- Washington, DC
- County
- District of Columbia · 671,873 people
- City population
- 671,873
- Metro
- Washington-Arlington-Alexandria, DC-VA-MD-WV
- Population (ZIP)
- 72,397
- Household income
- $120,337
- Rent vs Own
- Severe rent burden
- 3854.0
Population outlook (District of Columbia County) Hauer SSP2
- Today (2025)
- 821,926 people
- By 2030
- 899,517 · +9.4%
- By 2040
- 1,061,162 · +29.1%
- By 2050
- 1,231,493 · +49.8%
- By 2075
- 1,603,312 · +95.1%
- By 2100
- 1,847,141 · +124.7%
Race, ethnicity, and origin ACS 2023
- Neighborhood character
- Diverse neighborhood (Simpson 0.66)
- Race & ethnicity
- White 41% Black 40% Two or more races 9% Hispanic / Latino 9% Asian 3%
- Hispanic origin (detail)
- Mexican 2%
- Common ancestry
- Romanian 3% Lithuanian 2% Italian 2%
- Foreign-born
- 9% · Canada, China, South Korea
- Languages at home
- 87% English-only · Spanish 5% French/Haitian/Cajun 2% Other Indo-European 1%
Political lean MEDSL · District of Columbia
- 2024 margin
- Solid D (+86.1) · D 91.2% · R 5.1% · Other 3.8%
- 2008→2024 swing
- +0.1pp no change · 2008: 85.9pp · 2024: 86.1pp
- All cycles
- 2024: D+86.1 2020: D+86.8 2016: D+88.7 2012: D+84.2 2008: D+85.9
Not yet ingested
- Civics
- —
Market trends
- HPI YoY
- ▼ -852.61%
- Current HPI
- 396.6033
- Rent YoY
- ▼ -3.04%
- Metro
- Washington-Arlington-Alexandria, DC-VA-MD-WV
- State GDP YoY
- ▲ 1.33%
- F500 in state
- 6
Industry mix (Fortune 500 HQ in DC)
| Industry | F500 HQs | Revenue |
|---|---|---|
| Financial Services | 1 | $153B |
|
||
| Life Sciences / Industrials | 1 | $25B |
|
||
| Industrial Machinery | 1 | $8B |
|
||
Price history
+6480.6% since first listed3 events — show timeline
- 2026-05-26 Listed $204,000 FSBO.com
- 2025-10-10 Rental Removed $3,100 APPFOLIO
- 2025-09-30 Listed for Rent $3,100 APPFOLIO
Cash-flow waterfall
monthlySold comps — $/sqft
last 12 mo · ≤1 miLoading sold comps…