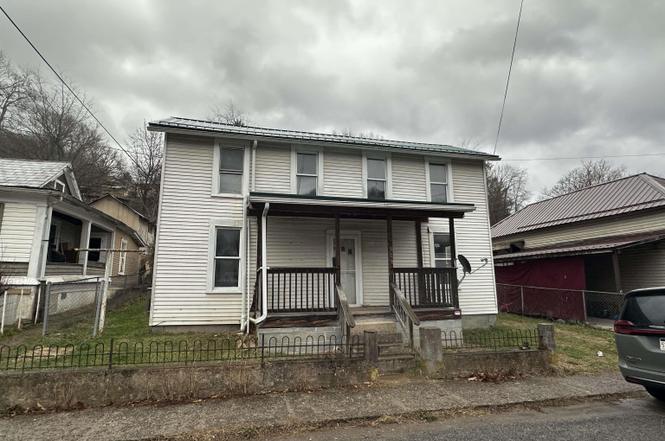
318 Broad St · Weston, WV
Flood risk 10/10 · Severe
- FEMA flood zone
- X (shaded)
- Chance of flooding over 30 yrs
- 0.99%
- Est. flood insurance / yr
- $507 – $1,088
Fire risk 3/10 · Minor
- Est. fire insurance / yr
- $787 – $1,461
Heat risk 4/10 · Minor
- Hot days now (above 100°F)
- 7 days/yr
- Hot days in 30 yrs
- 19 days/yr
Wind risk 1/10 · Minimal
- Chance of severe wind over 30 yrs
- 0.0%
Air-quality risk 2/10 · Minimal
- Unhealthy air days now
- 0 days/yr
- Unhealthy air days in 30 yrs
- 1 days/yr
Risk factors via First Street. Map © Google.
Why this score? — see what drove the B grade
The composite is a weighted blend of 9 inputs, each scored 0–100. Each bar is that input's sub-score; the figure is the points it added to the 100-point composite (weight × sub-score).
- Cash flow +30.0/30.0
- 1% rule +10.0/10.0
- DSCR +10.0/10.0
- ARV discount +7.5/15.0
- Appreciation +5.6/10.0
- Livability +3.7/5.0
- Rent growth +2.5/5.0
- Condition / age +2.5/5.0
- Schools +1.9/10.0
$39,500
🖨 Deal sheet 📄 Offer letter ✓ Due diligence
Listing remarks
Investment opportunity! Restore this house to its full potential! This home has 3 established bedrooms, with a potential 4th. If you don't need that extra space as a bedroom, you have room for an office space, expanded utility room, storage, etc. ! The back yard is fenced in and has storage available between a shed and cellar building! Did I mention it has a whole house generator that conveys? Close to restaurants, the grocery store and other conveniences! Don't miss this opportunity!
Key facts
- Fenced in back yard
- Storage available
- 7,500 sq ft lot
Tags
Property features AI
Finance
- Other: Annual tax amount listed (financial details available)
- HOA & community: Community amenities include golf, pool, and tennis courts
Exterior
- Parking: On-street parking
- Utilities: Public water; Public sewer
- Home design: Single family detached residence; 2 stories
- Construction: Frame construction with vinyl siding; Metal roof
- Exterior features: Patio; Porch; Chain link fencing; Sloped lot; Frontage listed as none
Interior
- Bedrooms: 6 total rooms (bedroom count not specified)
- Flooring: Vinyl flooring; Wood flooring
- Bathrooms: 1 full bathroom
- Heating & cooling: Central heating (natural gas); Central air; Ceiling fan(s)
- Interior features: Vinyl and wood flooring; Crawl space basement
Neighborhood map
What this means for you Summary
Snapshot
- This is a 2-bed/1.0-bath single-family listed at $40k.
Deal economics
- At list price, monthly cash flow is $493 ($6k/yr) — positive.
- The deal already cash-flows at list — no discount required.
- Meets the 1% rule at list price ($1k rent vs $40k).
- Recommended offer: $35k (12.0% below list) — sets the bar for market timing.
- Cap rate 23.3% vs local median 4.2% in Weston — top-decile yield for the area; either an underpriced asset or a hidden risk that comps aren't pricing in. Stress-test before assuming the spread holds.
Location & tenants
- Location reads 73/100 on livability (#38 in WV) — a middle-class / working-renter tenant base. Strengths: cost of living A+, housing A+, health & safety A+; Watch: amenities D-, commute F, employment F.
- Lewis County Schools (rural): math 19% / reading 27% proficiency, ranked #53 of 55 in WV (top 96%) — low school quality limits family demand, transient renter base, plan for 1-2y turnover.
- Zoned schools: Peterson-Central Elementary School (math 22% / reading 17%, grade F, #350 of 377 statewide, top 95%, 459 students, 0% FRL); Robert L. Bland Middle School (math 16% / reading 28%, grade F, #95 of 109 statewide, top 88%, 658 students, 0% FRL); Lewis County High School (math 12% / reading 37%, grade F, #91 of 110 statewide, top 85%, 756 students, 0% FRL) — zoned schools average 0% FRL vs 50% district-wide (50 pts lower); this property's tenant base skews higher-income than the district average.
- Market conditions: 37 active listings in the ZIP.
Forward outlook
- In year one you build about $736 of equity ($273 loan paydown + $463 appreciation (1.2% local appreciation)).
- Lewis County population projected to shrink 5% by 2050 — rents likely to lag national; underwrite the cash flow, not the appreciation.
- At projected returns (1.2% appreciation + 3.0% rent growth), your $11k cash investment doubles in ~2 years — after that, you're playing with house money.
Negotiation context
- It's been on market 138 days — a 12% lower offer ($35k) is reasonable based on typical stale-listing flexibility.
- 2 sale attempts; this cycle's ask is 13% above the opening price — seller raised mid-cycle; expect resistance to lowballs.
- Current owner paid $30k; 32% above their basis — modest negotiation headroom, anchor on the comps not their cost.
Risks & watch-outs
- Watch-outs: flood insurance adds $66/mo; built in 1935 — expect roof / HVAC / electrical / plumbing capex.
- Climate carrying-cost: severe flood risk — expect insurance premiums to compound above CPI over the hold.
Questions for the listing agent
- It's been on market 138 days. Have you received any prior offers? Is the seller open to a 12% concession, seller financing, or rate buy-down credit?
- Built in 1935 — when were the roof, HVAC, electrical panel, plumbing, and water heater last replaced?
- What's the actual annual flood-insurance premium (NFIP or private), and is the property in a SFHA with mandatory coverage?
- Why hasn't it sold? Are there any deal-killer items the seller is aware of (foundation, flood, title, zoning, code violations)?
- Is there a deadline driving the sale (1031 exchange, divorce, estate, relocation)? That informs how much negotiation room exists.
- Schools are D-rated, which usually means shorter tenancies and higher turnover. Who's the typical renter profile here, and what's been the actual vacancy rate?
- What's the average days-on-market for RENTAL listings here right now (not sales)? A rising rental-DOM trend means longer vacancies and softer asking-rent achievability than the comps imply.
- What's the recent tenant-quality profile in this submarket — average credit score on applications, eviction rate, late-payment / NSF rate, and stable-employment percentage? A property-management company in the area should have these aggregated.
- How much new for-sale + rental construction is in the pipeline within 1–3 miles? Heavy new supply typically softens prices + rents 12–24 months out; constrained supply supports both.
Investment metrics
- 1% rule
- 2.65% ✓
- Cap rate
- 23.28%
- Cash-on-cash
- 60.65%
- DSCR
- 3.70
- GRM
- 3.1
CMA / ARV
- ARV (on-the-fly)
- $119,968
- Comps found
- 12
Show comp detail 12 sales within ~0.75 mi
| Address | Dist | Beds/Ba | Sqft | Sold | Price | $/sf | Match |
|---|---|---|---|---|---|---|---|
| 319 Spring St | 0.14mi | 3/1.0 (+1) | 1,350 (+4%) | 19mo | $35,000 | $26 | 67 |
| 156 Montgomery Rd | 0.33mi | 3/2.0 (+1) | 1,260 (-3%) | 14mo | $219,000 | $174 | 58 |
| 119 E 3rd St | 0.46mi | 3/1.5 (+1) | 1,196 (-8%) | 3mo | $136,820 | $114 | 55 |
| 837 Walnut St | 0.66mi | 2/1.0 | 1,304 (0%) | 19mo | $80,000 | $61 | 54 |
| 122 Montgomery Rd | 0.35mi | 3/2.5 (+1) | 1,394 (+7%) | 15mo | $234,000 | $168 | 49 |
| 615 N River Ave | 0.46mi | 3/1.5 (+1) | 1,408 (+8%) | 15mo | $45,000 | $32 | 46 |
| 842 Cemetery St | 0.61mi | 3/1.5 (+1) | 1,248 (-4%) | 16mo | $238,000 | $191 | 44 |
| 147 E 6th St | 0.59mi | 3/1.0 (+1) | 1,183 (-9%) | 10mo | $90,000 | $76 | 44 |
| 928 N Main Ave | 0.66mi | 1/1.5 (-1) | 1,438 (+10%) | 4mo | $132,000 | $92 | 41 |
| 17 Jackson St | 0.69mi | 3/1.0 (+1) | 1,370 (+5%) | 18mo | $15,000 | $11 | 39 |
| 288 Rada Ave | 0.72mi | 3/1.5 (+1) | 1,476 (+13%) | 2mo | $135,000 | $91 | 36 |
| 285 Garton Ave | 0.73mi | 3/1.0 (+1) | 1,200 (-8%) | 21mo | $164,000 | $137 | 30 |
Match score weights: distance 35% · size 25% · config 20% · recency 20%. Top-matched comps best support the ARV.
Projected returns pro-forma
1.17% appreciation · 3.0% rent growth · sell at horizon
- IRR
- 56.4%
- Equity multiple
- 3.94×
- Total profit
- $32,496
- Equity at exit
- $13,839
- IRR
- 57.7%
- Equity multiple
- 7.94×
- Total profit
- $76,739
- Equity at exit
- $18,667
Cash invested: $11,060 (down + closing). Projections, not guarantees.
Landlord ↔ Tenant lean methodology
- Overall (STATE)
- 83 Strongly Landlord-Friendly
- State West Virginia
- 83 Strongly Landlord-Friendly · R+22
- County
- — inherits STATE
- City
- — inherits STATE
ZIP-level market 26452
- Home prices YoY
- 0.8%
- Active inventory
- 37
- Price-to-rent
- 3.1×
Monthly cashflow live
- Estimated rent
- $1,046 medium interval (Pro) →
- Mortgage (P&I)
- −$207
- Tax from tax record
- −$44 /mo · $524/yr
- Insurance
- −$16
- Flood insurance flood zone
- −$66 /mo · $798/yr
- HOA
- −$0
- Vacancy / Maint / Mgmt
- −$220
- Net cashflow
- $493
Break-even live
UW: 25.0% down · 7.5% · 30yr · 1.5% tax · 5.0% vac · 8.0% maint · 8.0% mgmt
Financing live
Cash to close
- Down payment
- $9,875
- Closing costs
- $1,185
- Reserves months
- —
- Total cash needed
- —
Loan-product check · same deal, 3 products live
Conventional
25% down · 7.5% · 30yr
- Down + closing
- —
- Monthly P&I
- —
- Monthly cashflow
- —
- DSCR
- —
- Eligible?
- —
Personal DTI + credit; lowest rate.
DSCR
20% down · 8.5% · 30yr
- Down + closing
- —
- Monthly P&I
- —
- Monthly cashflow
- —
- DSCR
- —
- Eligible?
- —
No personal income docs; deal must DSCR.
Hard money
10% down · 12.0% · 12mo
- Down + closing
- —
- Monthly P&I
- —
- Monthly cashflow
- —
- DSCR
- —
- Eligible?
- —
Short-term bridge; refi at stabilization.
Listing history 21 events
-
2026-06-18days on market $39,500 Active 138 DOM
-
2026-06-17days on market $39,500 Active 137 DOM
-
2026-06-16days on market $39,500 Active 136 DOM
-
2026-06-15days on market $39,500 Active 135 DOM
-
2026-06-15days on market $39,500 Active 134 DOM
-
2026-06-13days on market $39,500 Active 133 DOM
-
2026-06-12days on market $39,500 Active 132 DOM
-
2026-06-09days on market $39,500 Active 129 DOM
-
2026-06-08days on market $39,500 Active 128 DOM
-
2026-06-08days on market $39,500 Active 127 DOM
-
2026-06-07days on market $39,500 Active 126 DOM
-
2026-06-04days on market $39,500 Active 124 DOM
-
2026-06-03days on market $39,500 Active 123 DOM
-
2026-06-02days on market $39,500 Active 122 DOM
-
2026-06-01days on market $39,500 Active 121 DOM
-
2026-05-31days on market $39,500 Active 120 DOM
-
2026-04-29status Active
-
2026-04-29price $39,500
-
2026-04-24soldstatus $30,000
-
2026-02-01historical Active Under Contract
-
2026-01-17$35,000 Active
ⓘ Source: listings_history table (triggers on properties + properties_extension) + one-shot
backfill from property_details.listing_events for pre-trigger history.
Tax reassessment forecast WV · Resets to sale price
- Current annual tax
- $524 · $44/mo
- Projected year-2 tax
- $524 · $44/mo
- Expected delta
- $0/yr ($0/mo · 0.0%)
ⓘ Screening estimate from a state-policy table — verify with the county assessor before closing.
Climate risk First Street
- Flood 10/10 Extreme FEMA zone X (shaded) · 99% chance over 30 yrs
- Wildfire 3/10 Moderate
- Heat 4/10 Moderate 7 d/yr ≥100°F today · 19 d/yr by 30 yrs out
- Wind 1/10 Low 0% chance of damaging wind over 30 yrs
- Air quality 2/10 Low 0 unhealthy d/yr today · 1 by 30 yrs out
Nearby sold comps map
Loading sold comps map…
Walkable amenities ~0.75 mi
Loading nearby amenities…
Taxation est. · year 1
- Rental income
- $12,551
- − Mortgage interest
- −$2,213
- − Property taxes
- −$524
- − Insurance
- −$995
- − Repairs & maintenance
- −$1,004
- − Management
- −$1,004
- − Depreciation
- −$1,149
- Taxable income
- $5,662
- Est. tax owed @ 24.0%
- −$1,359
- After-tax cash flow
- $4,552/yr
For passive investors: Depreciation is non-cash, so a rental often shows a tax loss while cash-flowing — sheltering income. Rental losses are passive: they offset passive income freely, and up to $25,000/yr can offset ordinary (W-2) income if you actively participate and your MAGI is under $100k (phasing out to $0 by $150k); unused losses carry forward. On sale, claimed depreciation is recaptured at up to 25%, and gains may owe capital-gains tax (a 1031 exchange can defer both). Figures are a year-1 estimate at your 24.0% rate — not tax advice; consult a CPA.
Schools (NCES district)
- District
- Lewis County Schools
- NCES district ID
- 5400630
- Math proficiency
- 19% ▼ -12.00%
- Reading proficiency
- 27% ▼ -8.00%
- Median HH income
- $36,146
- Composite
- 19.05/100
- National rank
- #8843
- State rank
- #53 of 55 in WV
Livability — Weston
- Score
- 73/100
- State rank
- #38
- US rank
- #5368
Category grades
Schools grade is shown separately in the Schools card above.
Census & demographics
- Census place
- Weston, WV
- Population (ZIP)
- 9,374
Population outlook (Lewis County) Hauer SSP2
- Today (2025)
- 16,382 people
- By 2030
- 16,293 · -0.5%
- By 2040
- 15,999 · -2.3%
- By 2050
- 15,569 · -5.0%
- By 2075
- 14,450 · -11.8%
- By 2100
- 12,164 · -25.7%
Race, ethnicity, and origin ACS 2023
- Neighborhood character
- Predominantly White (92%)
- Race & ethnicity
- White 92% Two or more races 6% Hispanic / Latino 2%
- Common ancestry
- Serbian 1% Iranian 1% Italian 1%
- Foreign-born
- 1% · Canada
- Languages at home
- 98% English-only · Spanish 1%
Political lean MEDSL · Lewis
- 2024 margin
- Solid R (+59.3) · D 19.5% · R 78.8% · Other 1.8%
- 2008→2024 swing
- -25.6pp toward R · 2008: -33.7pp · 2024: -59.3pp
- All cycles
- 2024: R+59.3 2020: R+56.9 2016: R+56.8 2012: R+42.1 2008: R+33.7
Not yet ingested
- Civics
- —
Market trends
- HPI YoY
- ▲ 1.17%
- Current HPI
- 144.3377
- Rent YoY
- —
- Metro
- —
- State GDP YoY
- —
- F500 in state
- 0
Price history
+12.9% since first listed5 events — show timeline
- 2026-04-29 Relisted — NCWVREIN
- 2026-04-29 Price Changed $39,500 NCWVREIN
- 2026-04-24 Sold (Public Records) $30,000 Public Records
- 2026-02-01 Contingent — NCWVREIN
- 2026-01-17 Listed $35,000 NCWVREIN
Property tax history
+8.3%/yrLatest (2025): $524 · +134.7% YoY. Source: county tax records.
Cash-flow waterfall
monthlySold comps — $/sqft
last 12 mo · ≤1 miLoading sold comps…