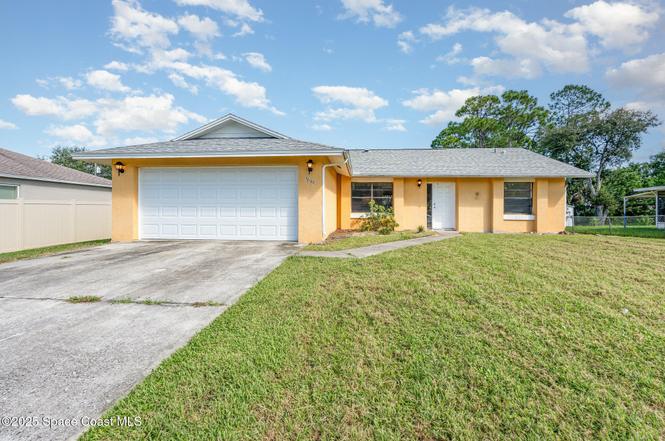
1867 Cyclone St NW · Palm Bay, FL
Flood risk 1/10 · Minimal
- FEMA flood zone
- X (unshaded)
- Chance of flooding over 30 yrs
- 0.0%
- Est. flood insurance / yr
- $507 – $1,088
Fire risk 6/10 · Moderate
- Est. fire insurance / yr
- $947 – $1,759
Heat risk 9/10 · Severe
- Hot days now (above 107°F)
- 7 days/yr
- Hot days in 30 yrs
- 22 days/yr
Wind risk 10/10 · Severe
- Chance of severe wind over 30 yrs
- 99.0%
Air-quality risk 1/10 · Minimal
- Unhealthy air days now
- 0 days/yr
- Unhealthy air days in 30 yrs
- 0 days/yr
Risk factors via First Street. Map © Google.
Why this score? — see what drove the C- grade
The composite is a weighted blend of 9 inputs, each scored 0–100. Each bar is that input's sub-score; the figure is the points it added to the 100-point composite (weight × sub-score).
- Cash flow +19.2/30.0
- ARV discount +7.5/15.0
- DSCR +6.0/10.0
- 1% rule +5.4/10.0
- Schools +4.7/10.0
- Livability +3.6/5.0
- Rent growth +2.7/5.0
- Condition / age +2.5/5.0
- Appreciation +0.0/10.0
$210,000
🖨 Deal sheet 📄 Offer letter ✓ Due diligence
Listing remarks
SELLER WANTS SOLD !!! This 3-bedroom, 2-bath home offers a functional floor plan and endless potential. Major updates include a new roof (Sept 2024), water heater (Dec 2023), A/C unit (Sept. 2021) and garage door (March 2023). Spacious living room with sliders opens to a large yard perfect for enjoying the Florida weather. Separate dining area and kitchen with plenty of cabinet and counter space provide great flow for future updates. Additional features include a 2-car garage, city water, and a convenient location near main roads, shopping, schools, and restaurants. Full of possibilities--make it your own, flip, or rental.
Key facts
- Water heater
- Large yard
- Convenient location
Tags
Neighborhood map
What this means for you Summary
Snapshot
- This is a 3-bed/2.0-bath single-family listed at $210k.
Deal economics
- At list price, monthly cash flow is $225 ($3k/yr) — positive.
- The deal already cash-flows at list — no discount required.
- Meets the 1% rule at list price ($2k rent vs $210k).
- Recommended offer: $185k (12.0% below list) — sets the bar for market timing.
Location & tenants
- Location reads 72/100 on livability (#366 in FL) — a middle-class / working-renter tenant base. Strengths: cost of living A+, housing A+; Watch: employment D+, amenities F, health & safety D-.
- Brevard (suburban): math 53% / reading 57% proficiency, ranked #19 of 73 in FL (top 26%) — acceptable for families but not a draw, mixed tenant base, ~2y average lease.
- Zoned schools: Discovery Elementary School (math 45% / reading 49%, grade D-, #1,191 of 2,144 statewide, top 57%, 641 students, 69% FRL); Central Middle School (math 50% / reading 48%, grade C-, #265 of 571 statewide, top 48%, 1,127 students, 53% FRL); Heritage High School (math 30% / reading 44%, grade F, #340 of 667 statewide, top 52%, 2,007 students, 62% FRL) — zoned schools average 61% FRL vs 43% district-wide (18 pts higher); higher-poverty schools than district average — tighter screening recommended.
- Market conditions: Rents flat; 739 active listings in the ZIP; 19 comparable units currently listed for rent nearby; rentals at typical pace (median 20d on market — plan ~3-4 weeks tenant-placement turnaround); solid renter incomes; 4,602 units permitted in Brevard County in 2024 (702 in 5+ unit buildings).
- This rent runs 35% of the median local income ($75k/yr) — at the standard rent-burdened threshold; future hikes will face affordability resistance.
Forward outlook
- Local home prices are declining (-3.0%/yr); year-one equity from $1k of loan paydown is wiped out by about $6k of value loss. Plan a longer hold.
- Brevard County population projected at +15% by 2050 — modest demand growth; plan on rents tracking national, not racing it.
Negotiation context
- It's been on market 151 days — a 12% lower offer ($185k) is reasonable based on typical stale-listing flexibility.
- 3 sale attempts; this cycle's ask has dropped $30k (12%) from the opening price — seller is motivated, your offer sets the floor, not the list.
- Current owner paid $76k; list at $210k implies a 175% gain — meaningful room to come down on a strong offer.
Risks & watch-outs
- Climate carrying-cost: severe wind risk, 99% chance of damaging wind over 30y; major wildfire risk; extreme-heat days projected 7→22/yr by 2055 (HVAC capex compounding) — expect insurance premiums to compound above CPI over the hold.
Questions for the listing agent
- It's been on market 151 days. Have you received any prior offers? Is the seller open to a 12% concession, seller financing, or rate buy-down credit?
- Why hasn't it sold? Are there any deal-killer items the seller is aware of (foundation, flood, title, zoning, code violations)?
- Is there a deadline driving the sale (1031 exchange, divorce, estate, relocation)? That informs how much negotiation room exists.
- What's the average days-on-market for RENTAL listings here right now (not sales)? A rising rental-DOM trend means longer vacancies and softer asking-rent achievability than the comps imply.
- What's the recent tenant-quality profile in this submarket — average credit score on applications, eviction rate, late-payment / NSF rate, and stable-employment percentage? A property-management company in the area should have these aggregated.
- How much new for-sale + rental construction is in the pipeline within 1–3 miles? Heavy new supply typically softens prices + rents 12–24 months out; constrained supply supports both.
Investment metrics
- 1% rule
- 1.04% ✓
- Cap rate
- 7.58%
- Cash-on-cash
- 4.59%
- DSCR
- 1.20
- GRM
- 8.0
CMA / ARV
No comps found within radius.
Projected returns pro-forma
-3.0% appreciation · 0.93% rent growth · sell at horizon
- IRR
- -11.5%
- Equity multiple
- 0.59×
- Total profit
- $-24,088
- Equity at exit
- $31,312
- IRR
- -5.7%
- Equity multiple
- 0.66×
- Total profit
- $-19,805
- Equity at exit
- $18,157
Cash invested: $58,800 (down + closing). Projections, not guarantees.
Landlord ↔ Tenant lean methodology
- Overall (STATE)
- 87 Strongly Landlord-Friendly
- State Florida
- 87 Strongly Landlord-Friendly · R+3
- County
- — inherits STATE
- City
- — inherits STATE
ZIP-level market 32907
- Home prices YoY
- -10.1%
- Rents YoY
- 0.9%
- Active inventory
- 739
- Price-to-rent
- 8.0×
Monthly cashflow live
- Estimated rent
- $2,184 high interval (Pro) →
- Mortgage (P&I)
- −$1,101
- Tax from tax record
- −$312 /mo · $3,738/yr
- Insurance
- −$88
- HOA
- −$0
- Vacancy / Maint / Mgmt
- −$459
- Net cashflow
- $225
Break-even live
UW: 25.0% down · 7.5% · 30yr · 1.5% tax · 5.0% vac · 8.0% maint · 8.0% mgmt
Financing live
Cash to close
- Down payment
- $52,500
- Closing costs
- $6,300
- Reserves months
- —
- Total cash needed
- —
Loan-product check · same deal, 3 products live
Conventional
25% down · 7.5% · 30yr
- Down + closing
- —
- Monthly P&I
- —
- Monthly cashflow
- —
- DSCR
- —
- Eligible?
- —
Personal DTI + credit; lowest rate.
DSCR
20% down · 8.5% · 30yr
- Down + closing
- —
- Monthly P&I
- —
- Monthly cashflow
- —
- DSCR
- —
- Eligible?
- —
No personal income docs; deal must DSCR.
Hard money
10% down · 12.0% · 12mo
- Down + closing
- —
- Monthly P&I
- —
- Monthly cashflow
- —
- DSCR
- —
- Eligible?
- —
Short-term bridge; refi at stabilization.
Rent comps 19 comps
| Address | Beds | Baths | Sqft | Rent | $/sqft | DOM | Units | Dist |
|---|---|---|---|---|---|---|---|---|
| 1743 Fairlight St NW Palm Bay, FL | 4.0 | 2.0 | 1860 | $2,250 | $1.21 | 23d | 1 | 0.57mi |
| 1146 Kylar Dr NW Palm Bay, FL | 4.0 | 2.0 | 1635 | $2,250 | $1.38 | 13d | 1 | 0.83mi |
| 1405 Pace Dr NW Palm Bay, FL | 4.0 | 2.0 | 1830 | $2,500 | $1.37 | 19d | 1 | 0.87mi |
| 1560 Gardenton St NW Palm Bay, FL | 4.0 | 2.0 | 1828 | $2,200 | $1.20 | 23d | 1 | 0.88mi |
| 1699 Givens Ct NW Palm Bay, FL | 3.0 | 2.0 | 1458 | $1,900 | $1.30 | 14d | 1 | 0.91mi |
| 838 Gillen Ave NW Palm Bay, FL | 3.0 | 2.0 | 1416 | $1,900 | $1.34 | 14d | 1 | 0.98mi |
| 1197 Gallatin Ave NW Palm Bay, FL | 3.0 | 2.0 | 1734 | $1,965 | $1.13 | 19d | 1 | 1.04mi |
| 1572 Holbrook Rd NW Palm Bay, FL | 3.0 | 2.0 | 1256 | $1,945 | $1.55 | 23d | 1 | 1.04mi |
| 308 Tamarind Cir NW Palm Bay, FL | 3.0 | 2.0 | 1350 | $2,100 | $1.56 | 23d | 1 | 1.06mi |
| 938 Soleway Ave NW Palm Bay, FL | 3.0 | 2.0 | 1867 | $2,300 | $1.23 | 13d | 1 | 1.12mi |
| 2585 Roygaris St NW Palm Bay, FL | 4.0 | 2.0 | 1845 | $2,650 | $1.44 | 2d | 1 | 1.16mi |
| 1460 Cass Ave NW Palm Bay, FL | 3.0 | 2.0 | 1254 | $1,765 | $1.41 | 23d | 1 | 1.18mi |
| 1337 Helvenston St NW Palm Bay, FL | 3.0 | 2.0 | 1816 | $1,900 | $1.05 | 23d | 1 | 1.19mi |
| 1388 Hazel St NW Palm Bay, FL | 3.0 | 2.0 | 1475 | $1,894 | $1.28 | 14d | 1 | 1.38mi |
| 1021 Locust Ave NW Palm Bay, FL | 4.0 | 2.0 | 1724 | $2,046 | $1.19 | 14d | 1 | 1.44mi |
| 1357 Sequoia Rd NW Palm Bay, FL | 3.0 | 2.0 | 1874 | $2,200 | $1.17 | 23d | 1 | 1.44mi |
| 1483 Jasper Ave NW Palm Bay, FL | 3.0 | 2.0 | 1644 | $1,800 | $1.09 | 14d | 1 | 1.44mi |
| 1492 Glencove Ave NW Palm Bay, FL | 3.0 | 2.0 | 1679 | $1,800 | $1.07 | 23d | 1 | 1.45mi |
| 1649 Cains Ave NW Palm Bay, FL | 3.0 | 2.0 | 1294 | $2,000 | $1.55 | 23d | 1 | 1.49mi |
Listing history 9 events
-
2026-03-12status Pending
-
2026-03-10price $210,000
-
2026-02-24status Active
-
2026-02-18historical Active Under Contract
-
2025-12-20status Active
-
2025-12-06status Pending
-
2025-09-28$239,900 Active
-
1992-09-01soldstatus $76,400
-
1990-08-30soldstatus $6,700
ⓘ Source: listings_history table (triggers on properties + properties_extension) + one-shot
backfill from property_details.listing_events for pre-trigger history.
Tax reassessment forecast FL · Resets to sale price
- Current annual tax
- $3,738 · $312/mo
- Projected year-2 tax
- $3,738 · $312/mo
- Expected delta
- $0/yr ($0/mo · 0.0%)
ⓘ Screening estimate from a state-policy table — verify with the county assessor before closing.
Climate risk First Street
- Flood 1/10 Low FEMA zone X (unshaded) · 0% chance over 30 yrs
- Wildfire 6/10 Major
- Heat 9/10 Extreme 7 d/yr ≥107°F today · 22 d/yr by 30 yrs out
- Wind 10/10 Extreme 99% chance of damaging wind over 30 yrs
- Air quality 1/10 Low 0 unhealthy d/yr today · 0 by 30 yrs out
Nearby sold comps map
Loading sold comps map…
Walkable amenities ~0.75 mi
Loading nearby amenities…
Taxation est. · year 1
- Rental income
- $26,208
- − Mortgage interest
- −$11,763
- − Property taxes
- −$3,738
- − Insurance
- −$1,050
- − Repairs & maintenance
- −$2,097
- − Management
- −$2,097
- − Depreciation
- −$6,109
- Taxable loss
- −$646
- Est. tax savings @ 24.0%
- +$155
- After-tax cash flow
- $2,856/yr
For passive investors: Depreciation is non-cash, so a rental often shows a tax loss while cash-flowing — sheltering income. Rental losses are passive: they offset passive income freely, and up to $25,000/yr can offset ordinary (W-2) income if you actively participate and your MAGI is under $100k (phasing out to $0 by $150k); unused losses carry forward. On sale, claimed depreciation is recaptured at up to 25%, and gains may owe capital-gains tax (a 1031 exchange can defer both). Figures are a year-1 estimate at your 24.0% rate — not tax advice; consult a CPA.
Schools (NCES district)
- District
- Brevard
- NCES district ID
- 1200150
- Math proficiency
- 53% ▼ -9.00%
- Reading proficiency
- 57% ▼ -4.00%
- Median HH income
- $49,426
- Composite
- 46.86/100
- National rank
- #2370
- State rank
- #19 of 73 in FL
Livability — Palm Bay
- Score
- 72/100
- State rank
- #366
- US rank
- #6458
Category grades
Schools grade is shown separately in the Schools card above.
Census & demographics
- Census place
- Palm Bay, FL
- County
- Brevard County · 602,871 people
- City population
- 132,211
- Metro
- Palm Bay-Melbourne-Titusville, FL
- Population (ZIP)
- 49,080
- Household income
- $75,311
- Rent vs Own
- Severe rent burden
- 702.0
Population outlook (Brevard County) Hauer SSP2
- Today (2025)
- 623,254 people
- By 2030
- 648,420 · +4.0%
- By 2040
- 690,009 · +10.7%
- By 2050
- 715,669 · +14.8%
- By 2075
- 775,744 · +24.5%
- By 2100
- 776,687 · +24.6%
Race, ethnicity, and origin ACS 2023
- Neighborhood character
- Diverse neighborhood (Simpson 0.62)
- Race & ethnicity
- White 56% Hispanic / Latino 21% Black 15% Two or more races 14% Asian 2%
- Hispanic origin (detail)
- Mexican 2% Puerto Rican 9% Cuban 2% Dominican 3%
- Common ancestry
- Romanian 2% Lithuanian 2% Hispanic 2%
- Foreign-born
- 16% · Canada, Jamaica
- Languages at home
- 77% English-only · Spanish 17% French/Haitian/Cajun 2% Other Indo-European 1%
Political lean MEDSL · Brevard
- 2024 margin
- Strong R (+20.8) · D 39.1% · R 59.9% · Other 1.0%
- 2008→2024 swing
- -10.4pp toward R · 2008: -10.4pp · 2024: -20.8pp
- All cycles
- 2024: R+20.8 2020: R+16.4 2016: R+19.8 2012: R+12.7 2008: R+10.4
Not yet ingested
- Civics
- —
Market trends
- HPI YoY
- ▼ -34.79%
- Current HPI
- 308.9719
- Rent YoY
- ▲ 0.93%
- Metro
- Palm Bay-Melbourne-Titusville, FL
- State GDP YoY
- ▲ 3.28%
- F500 in state
- 36
Industry mix (Fortune 500 HQ in FL)
| Industry | F500 HQs | Revenue |
|---|---|---|
| Industrial Technology | 2 | $29B |
|
||
| Insurance | 2 | $17B |
|
||
| Retail | 1 | $60B |
|
||
| Technology Distribution | 1 | $58B |
|
||
| Homebuilding | 1 | $35B |
|
||
| Technology Manufacturing | 1 | $35B |
|
||
Price history
+3034.3% since first listed9 events — show timeline
- 2026-03-12 Pending — SCMLS
- 2026-03-10 Price Changed $210,000 SCMLS
- 2026-02-24 Relisted — SCMLS
- 2026-02-18 Contingent — SCMLS
- 2025-12-20 Relisted — SCMLS
- 2025-12-06 Pending — SCMLS
- 2025-09-28 Listed $239,900 SCMLS
- 1992-09-01 Sold (Public Records) $76,400 Public Records
- 1990-08-30 Sold (Public Records) $6,700 Public Records
Property tax history
+7.8%/yrLatest (2025): $3,738 · +3.0% YoY. Source: county tax records.
Cash-flow waterfall
monthlySold comps — $/sqft
last 12 mo · ≤1 miLoading sold comps…