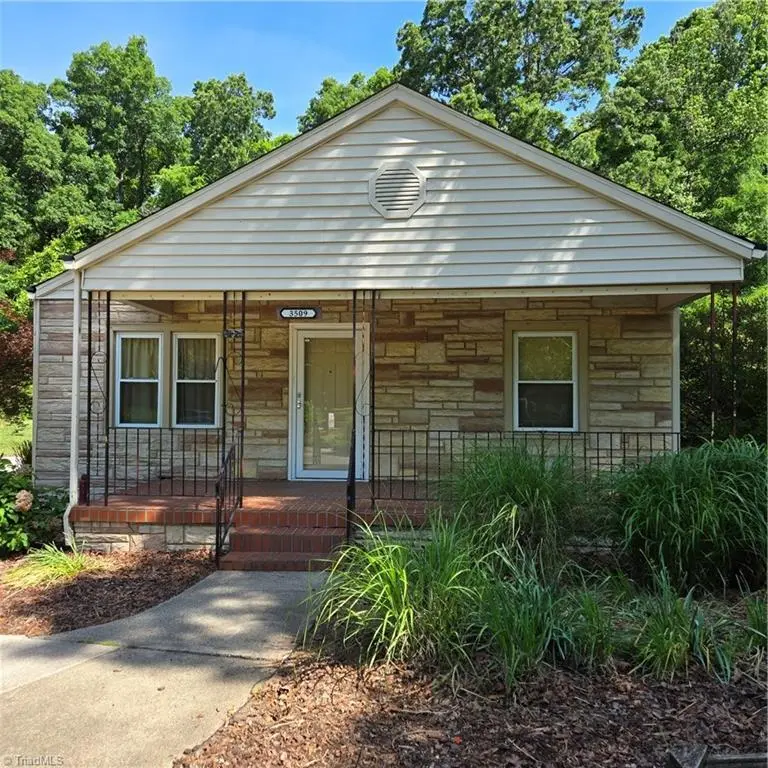
3509 Mcknight Mill Rd · Greensboro, NC
Flood risk 1/10 · Minimal
- FEMA flood zone
- X (unshaded)
- Chance of flooding over 30 yrs
- 0.0%
- Est. flood insurance / yr
- $507 – $1,088
Fire risk 2/10 · Minimal
- Est. fire insurance / yr
- $906 – $1,684
Heat risk 5/10 · Moderate
- Hot days now (above 103°F)
- 7 days/yr
- Hot days in 30 yrs
- 18 days/yr
Wind risk 4/10 · Minor
- Chance of severe wind over 30 yrs
- 14.0%
Air-quality risk 2/10 · Minimal
- Unhealthy air days now
- 1 days/yr
- Unhealthy air days in 30 yrs
- 2 days/yr
Risk factors via First Street. Map © Google.
Why this score? — see what drove the C+ grade
The composite is a weighted blend of 9 inputs, each scored 0–100. Each bar is that input's sub-score; the figure is the points it added to the 100-point composite (weight × sub-score).
- Cash flow +22.1/30.0
- ARV discount +15.0/15.0
- DSCR +7.1/10.0
- 1% rule +4.7/10.0
- Livability +4.0/5.0
- Schools +3.6/10.0
- Rent growth +3.5/5.0
- Condition / age +2.5/5.0
- Appreciation +0.0/10.0
$182,000
🖨 Deal sheet 📄 Offer letter ✓ Due diligence
Listing remarks
Welcome to this charming one-level, 3-bedroom home offering a spacious layout and generously sized rooms throughout. Designed for comfortable living, the floor plan provides a natural flow that’s perfect for both everyday life and entertaining. The kitchen serves as the heart of the home, ample cabinetry, and a spacious layout This home is full of potential, giving you the opportunity to add your personal touch with just a little updating. Hardwood flooring in select areas adds warmth and character, while the roomy interior creates a bright and inviting atmosphere. Outside, you’ll find even more to love with a convenient storage building, detached carport, and plenty of parking
Key facts
- 0.52 acre lot
- 2 garage spots
- Built 1948
Property features AI
Finance
- HOA & community: No homeowners association
Exterior
- Parking: Detached carport (2 parking spaces)
- Utilities: Public water; Septic sewer; Natural gas for heating; Water heater: unknown
- Home design: Residential stick/site-built house; One story; Built in 1948; Living room fireplace
- Construction: Vinyl siding; Crawl space foundation; Shingle roof not specified
- Exterior features: Cleared lot; Public-maintained road access; Septic tank
Interior
- Kitchen: Microwave; Oven; Cooktop; Dishwasher; Pantry in kitchen
- Bedrooms: Bedrooms located on the main level
- Flooring: Tile; Vinyl; Wood
- Bathrooms: One full bathroom
- Heating & cooling: Forced air heating (natural gas); Central air conditioning
- Interior features: Primary bedroom on main level; Pull-down attic stairs; Ceiling fans; Pantry
- Laundry & utility: Washer hookup; Dryer connection on main level
Neighborhood map
What this means for you Summary
Snapshot
- This is a 3-bed/1.0-bath single-family listed at $182k.
Deal economics
- At list price, monthly cash flow is $294 ($4k/yr) — positive.
- The deal already cash-flows at list — no discount required.
- To meet the 1% rule (rent ≥ 1% of price), the offer needs to be $177k (2.9% below list).
- Recommended offer: $177k (3.0% below list) — sets the bar for market timing.
- Cap rate 8.2% vs local median 3.8% in Greensboro — top-decile yield for the area; either an underpriced asset or a hidden risk that comps aren't pricing in. Stress-test before assuming the spread holds.
Location & tenants
- Location reads 81/100 on livability (#12 in NC, #1,335 nationally) — a professional / high-income tenant draw. Strengths: amenities A+, commute A+, cost of living A+; Watch: employment D, crime F.
- Guilford County Schools (urban): math 39% / reading 45% proficiency, ranked #99 of 178 in NC (top 56%) — families likely to look elsewhere, expect single-tenant / working-renter base with shorter leases.
- Market conditions: Rents rising (+3.8%/yr); 381 active listings in the ZIP; 6 comparable units currently listed for rent nearby; rentals at typical pace (median 23d on market — plan ~3-4 weeks tenant-placement turnaround); 3,843 units permitted in Guilford County in 2024 (2,397 in 5+ unit buildings).
- This rent runs 45% of the median local income ($47k/yr) — at the standard rent-burdened threshold; future hikes will face affordability resistance.
Forward outlook
- Local home prices are declining (-3.0%/yr); year-one equity from $1k of loan paydown is wiped out by about $5k of value loss. Plan a longer hold.
- Guilford County population projected at +26% by 2050 — long-run rental-demand tailwind backs the buy-and-hold thesis.
Negotiation context
- It's been on market 43 days — a 3% lower offer ($177k) is reasonable based on typical stale-listing flexibility.
- Current owner paid $23k; list at $182k implies a 691% gain — meaningful room to come down on a strong offer.
Risks & watch-outs
- Watch-outs: built in 1948 — expect roof / HVAC / electrical / plumbing capex.
- Climate carrying-cost: extreme-heat days projected 7→18/yr by 2055 (HVAC capex compounding) — expect insurance premiums to compound above CPI over the hold.
Questions for the listing agent
- It's been on market 43 days. Have you received any prior offers? Is the seller open to a 3% concession, seller financing, or rate buy-down credit?
- Built in 1948 — when were the roof, HVAC, electrical panel, plumbing, and water heater last replaced?
- Is there a deadline driving the sale (1031 exchange, divorce, estate, relocation)? That informs how much negotiation room exists.
- Crime grade is F in this area — have there been break-ins, vandalism, or insurance claims at this property in the last 3 years? What carrier currently insures it and at what premium?
- What's the average days-on-market for RENTAL listings here right now (not sales)? A rising rental-DOM trend means longer vacancies and softer asking-rent achievability than the comps imply.
- What's the recent tenant-quality profile in this submarket — average credit score on applications, eviction rate, late-payment / NSF rate, and stable-employment percentage? A property-management company in the area should have these aggregated.
- How much new for-sale + rental construction is in the pipeline within 1–3 miles? Heavy new supply typically softens prices + rents 12–24 months out; constrained supply supports both.
Investment metrics
- 1% rule
- 0.97% ✗
- Cap rate
- 8.23%
- Cash-on-cash
- 6.93%
- DSCR
- 1.31
- GRM
- 8.6
CMA / ARV
- ARV (on-the-fly)
- $250,044
- Comps found
- 12
Show comp detail 12 sales within ~0.75 mi
| Address | Dist | Beds/Ba | Sqft | Sold | Price | $/sf | Match |
|---|---|---|---|---|---|---|---|
| 3720 Hillrise Dr | 0.24mi | 3/2.5 | 1,202 (-3%) | 6mo | $234,900 | $195 | 73 |
| 3801 Sanderston Dr | 0.31mi | 3/2.0 | 1,265 (+2%) | 8mo | $269,000 | $213 | 72 |
| 3902 Arcola Way | 0.32mi | 3/2.0 | 1,265 (+2%) | 9mo | $269,300 | $213 | 71 |
| 3911 Arcola Way | 0.30mi | 3/2.0 | 1,265 (+2%) | 12mo | $269,000 | $213 | 70 |
| 3908 Arcola Way | 0.32mi | 3/2.0 | 1,199 (-4%) | 16mo | $257,000 | $214 | 62 |
| 109 Lemon Ln | 0.21mi | 3/2.5 | 1,418 (+14%) | 1mo | $252,000 | $178 | 60 |
| 2520 Mcknight Mill Rd | 0.31mi | 2/1.0 (-1) | 1,126 (-10%) | 7mo | $181,000 | $161 | 59 |
| 3805 Sanderston Dr | 0.28mi | 3/2.0 | 1,199 (-4%) | 22mo | $257,900 | $215 | 58 |
| 3700 Miller Dr | 0.35mi | 3/2.0 | 1,334 (+7%) | 15mo | $180,000 | $135 | 55 |
| 2902 Desmond Woods Dr | 0.35mi | 3/2.5 | 1,407 (+13%) | 2mo | $265,000 | $188 | 55 |
| 213 Pleasant Willow Pl | 0.14mi | 3/2.5 | 1,407 (+13%) | 21mo | $265,000 | $188 | 49 |
| 3411 Cecilside Ln | 0.68mi | 3/1.0 | 1,144 (-8%) | 8mo | $230,000 | $201 | 48 |
Match score weights: distance 35% · size 25% · config 20% · recency 20%. Top-matched comps best support the ARV.
Projected returns pro-forma
-3.0% appreciation · 3.83% rent growth · sell at horizon
- IRR
- -4.9%
- Equity multiple
- 0.82×
- Total profit
- $-9,324
- Equity at exit
- $27,137
- IRR
- 5.6%
- Equity multiple
- 1.43×
- Total profit
- $21,951
- Equity at exit
- $15,736
Cash invested: $50,960 (down + closing). Projections, not guarantees.
Landlord ↔ Tenant lean methodology
- Overall (STATE)
- 85 Strongly Landlord-Friendly
- State North Carolina
- 85 Strongly Landlord-Friendly · R+3
- County
- — inherits STATE
- City
- — inherits STATE
ZIP-level market 27405
- Home prices YoY
- -20.6%
- Rents YoY
- 3.8%
- Active inventory
- 381
- Price-to-rent
- 8.6×
Monthly cashflow live
- Estimated rent
- $1,767 high interval (Pro) →
- Mortgage (P&I)
- −$954
- Tax from tax record
- −$71 /mo · $856/yr
- Insurance
- −$76
- HOA
- −$0
- Vacancy / Maint / Mgmt
- −$371
- Net cashflow
- $294
Break-even live
UW: 25.0% down · 7.5% · 30yr · 1.5% tax · 5.0% vac · 8.0% maint · 8.0% mgmt
Financing live
Cash to close
- Down payment
- $45,500
- Closing costs
- $5,460
- Reserves months
- —
- Total cash needed
- —
Loan-product check · same deal, 3 products live
Conventional
25% down · 7.5% · 30yr
- Down + closing
- —
- Monthly P&I
- —
- Monthly cashflow
- —
- DSCR
- —
- Eligible?
- —
Personal DTI + credit; lowest rate.
DSCR
20% down · 8.5% · 30yr
- Down + closing
- —
- Monthly P&I
- —
- Monthly cashflow
- —
- DSCR
- —
- Eligible?
- —
No personal income docs; deal must DSCR.
Hard money
10% down · 12.0% · 12mo
- Down + closing
- —
- Monthly P&I
- —
- Monthly cashflow
- —
- DSCR
- —
- Eligible?
- —
Short-term bridge; refi at stabilization.
Rent comps 6 comps
| Address | Beds | Baths | Sqft | Rent | $/sqft | DOM | Units | Dist |
|---|---|---|---|---|---|---|---|---|
| 109 Lemon Ln Greensboro, NC | 3.0 | 3.0 | 1418 | $2,000 | $1.41 | 23d | 1 | 0.21mi |
| 3902 Arcola Way Greensboro, NC | 3.0 | 2.0 | 1265 | $1,795 | $1.42 | 23d | 1 | 0.30mi |
| 4100 US Highway 29 N Greensboro, NC | 1.0–3.0 | 1.0–2.0 | 928 | $1,529 | $1.65 | 23d | 1 | 0.44mi |
| 3409 N O.Henry Blvd Greensboro, NC | 2.0–3.0 | 1.0–1.5 | 925 | $1,475 | $1.59 | 14d | 6 | 1.26mi |
| 1811 Cody Ave Greensboro, NC | 3.0 | 2.0 | 1200 | $1,600 | $1.33 | 18d | 1 | 1.47mi |
| 1811 Cody Ave Greensboro, NC | 3.0 | 2.0 | 1200 | $1,600 | $1.33 | 23d | 1 | 1.47mi |
Listing history 17 events
-
2026-06-18days on market $182,000 Active 43 DOM
-
2026-06-17days on market $182,000 Active 42 DOM
-
2026-06-16days on market $182,000 Active 41 DOM
-
2026-06-15days on market $182,000 Active 40 DOM
-
2026-06-14days on market $182,000 Active 38 DOM
-
2026-06-10days on market $182,000 Active 35 DOM
-
2026-06-09days on market $182,000 Active 34 DOM
-
2026-06-08days on market $182,000 Active 33 DOM
-
2026-06-07days on market $182,000 Active 32 DOM
-
2026-06-03days on market $182,000 Active 28 DOM
-
2026-06-02days on market $182,000 Active 27 DOM
-
2026-06-01days on market $182,000 Active 26 DOM
-
2026-05-31days on market $182,000 Active 25 DOM
-
2026-05-31days on market $182,000 Active 24 DOM
-
2026-05-21price $182,000
-
2026-05-06$195,000 Active
-
1977-06-01soldstatus $23,000
ⓘ Source: listings_history table (triggers on properties + properties_extension) + one-shot
backfill from property_details.listing_events for pre-trigger history.
Tax reassessment forecast NC · Resets to sale price
- Current annual tax
- $856 · $71/mo
- Projected year-2 tax
- $1,492 · $124/mo
- Expected delta
- +$636/yr (+$53/mo · 74.3%)
ⓘ Screening estimate from a state-policy table — verify with the county assessor before closing.
Climate risk First Street
- Flood 1/10 Low FEMA zone X (unshaded) · 0% chance over 30 yrs
- Wildfire 2/10 Low
- Heat 5/10 Major 7 d/yr ≥103°F today · 18 d/yr by 30 yrs out
- Wind 4/10 Moderate 14% chance of damaging wind over 30 yrs
- Air quality 2/10 Low 1 unhealthy d/yr today · 2 by 30 yrs out
Nearby sold comps map
Loading sold comps map…
Walkable amenities ~0.75 mi
Loading nearby amenities…
Taxation est. · year 1
- Rental income
- $21,205
- − Mortgage interest
- −$10,195
- − Property taxes
- −$856
- − Insurance
- −$910
- − Repairs & maintenance
- −$1,696
- − Management
- −$1,696
- − Depreciation
- −$5,295
- Taxable income
- $557
- Est. tax owed @ 24.0%
- −$134
- After-tax cash flow
- $3,399/yr
For passive investors: Depreciation is non-cash, so a rental often shows a tax loss while cash-flowing — sheltering income. Rental losses are passive: they offset passive income freely, and up to $25,000/yr can offset ordinary (W-2) income if you actively participate and your MAGI is under $100k (phasing out to $0 by $150k); unused losses carry forward. On sale, claimed depreciation is recaptured at up to 25%, and gains may owe capital-gains tax (a 1031 exchange can defer both). Figures are a year-1 estimate at your 24.0% rate — not tax advice; consult a CPA.
Schools (NCES district)
- District
- Guilford County Schools
- NCES district ID
- 3701920
- Math proficiency
- 39% ▲ 1.00%
- Reading proficiency
- 45% ▲ 1.00%
- Median HH income
- $46,315
- Composite
- 35.78/100
- National rank
- #4842
- State rank
- #99 of 178 in NC
Livability — Greensboro
- Score
- 81/100
- State rank
- #12
- US rank
- #1335
Category grades
Schools grade is shown separately in the Schools card above.
Census & demographics
- County
- Guilford County · 487,190 people
- City population
- 329,421
- Metro
- Greensboro-High Point, NC
- Population (ZIP)
- 54,303
- Household income
- $47,431
- Rent vs Own
- Severe rent burden
- 2517.0
Population outlook (Guilford County) Hauer SSP2
- Today (2025)
- 584,596 people
- By 2030
- 616,851 · +5.5%
- By 2040
- 678,451 · +16.1%
- By 2050
- 734,788 · +25.7%
- By 2075
- 862,985 · +47.6%
- By 2100
- 948,704 · +62.3%
Race, ethnicity, and origin ACS 2023
- Neighborhood character
- Diverse neighborhood (Simpson 0.62)
- Race & ethnicity
- Black 57% White 20% Hispanic / Latino 14% Two or more races 7% Asian 4%
- Hispanic origin (detail)
- Mexican 9% Puerto Rican 2%
- Common ancestry
- Romanian 1% Ukrainian 1% Italian 1%
- Foreign-born
- 15% · Canada, Vietnam, China
- Languages at home
- 79% English-only · Spanish 11% Other Asian/Pacific 2% Other Indo-European 1%
Political lean MEDSL · Guilford
- 2024 margin
- Strong D (+21.8) · D 60.2% · R 38.4% · Other 1.4%
- 2008→2024 swing
- +3.5pp toward D · 2008: 18.4pp · 2024: 21.8pp
- All cycles
- 2024: D+21.8 2020: D+23.1 2016: D+20.0 2012: D+16.5 2008: D+18.4
Not yet ingested
- Civics
- —
Market trends
- HPI YoY
- ▼ -63.02%
- Current HPI
- 243.1261
- Rent YoY
- ▲ 3.83%
- Metro
- Greensboro-High Point, NC
- State GDP YoY
- ▲ 3.28%
- F500 in state
- 26
Industry mix (Fortune 500 HQ in NC)
| Industry | F500 HQs | Revenue |
|---|---|---|
| Financial Services | 2 | $213B |
|
||
| Retail | 2 | $95B |
|
||
| Industrial Conglomerate | 1 | $38B |
|
||
| Metals / Steel | 1 | $35B |
|
||
| Utilities | 1 | $30B |
|
||
| Industrial Machinery | 1 | $19B |
|
||
Price history
+691.3% since first listed3 events — show timeline
- 2026-05-21 Price Changed $182,000 Triad MLS
- 2026-05-06 Listed $195,000 Triad MLS
- 1977-06-01 Sold (Public Records) $23,000 Public Records
Property tax history
+3.1%/yrLatest (2025): $856 · +0.0% YoY. Source: county tax records.
Cash-flow waterfall
monthlySold comps — $/sqft
last 12 mo · ≤1 miLoading sold comps…