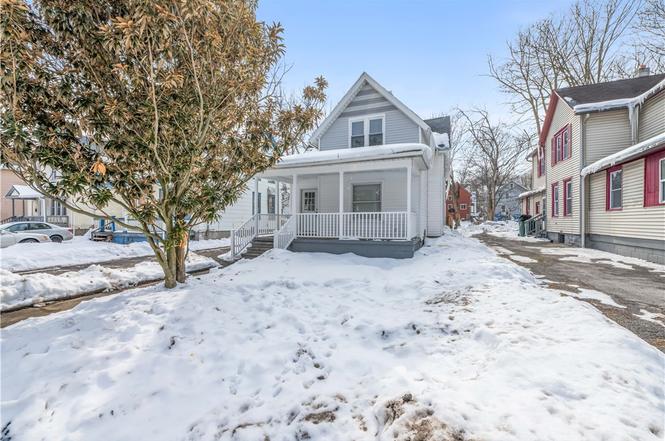
139 Hawley St · Rochester, NY
Flood risk 6/10 · Moderate
- FEMA flood zone
- X (unshaded)
- Chance of flooding over 30 yrs
- 0.69%
- Est. flood insurance / yr
- $473 – $860
Fire risk 1/10 · Minimal
- Est. fire insurance / yr
- $691 – $1,283
Heat risk 2/10 · Minimal
- Hot days now (above 96°F)
- 7 days/yr
- Hot days in 30 yrs
- 15 days/yr
Wind risk 1/10 · Minimal
- Chance of severe wind over 30 yrs
- —
Air-quality risk 2/10 · Minimal
- Unhealthy air days now
- 1 days/yr
- Unhealthy air days in 30 yrs
- 1 days/yr
Risk factors via First Street. Map © Google.
Why this score? — see what drove the C- grade
The composite is a weighted blend of 9 inputs, each scored 0–100. Each bar is that input's sub-score; the figure is the points it added to the 100-point composite (weight × sub-score).
- Cash flow +20.4/30.0
- Appreciation +6.8/10.0
- DSCR +6.5/10.0
- Rent growth +4.2/5.0
- 1% rule +4.1/10.0
- Livability +3.8/5.0
- Condition / age +2.5/5.0
- Schools +1.9/10.0
- ARV discount +0.0/15.0
$189,900
🖨 Deal sheet 📄 Offer letter ✓ Due diligence
Listing remarks
Welcome to this fully renovated 4 bedroom, 2 bath home in the Plymouth-Exchange neighborhood of the City of Rochester! From the charming front porch to the modern finishes inside, this home is truly move-in ready. Step into the open 1st floor featuring a spacious living room filled with natural light and a massive eat-in kitchen designed for both everyday living and entertaining. The kitchen boasts a large island, quartz countertops, tile backsplash, brand-new stainless steel appliances, and an oversized dining space. The 1st floor also offers incredible flexibility with a bedroom plus a private office that could easily serve as a 5th bedroom, playroom, or additional flex space. A beautiful
Key facts
- Quartz countertops
- Charming front porch
- Large island
Tags
Neighborhood map
What this means for you Summary
Snapshot
- This is a 3-bed/2.0-bath single-family listed at $190k.
Deal economics
- At list price, monthly cash flow is $245 ($3k/yr) — positive.
- The deal already cash-flows at list — no discount required.
- To meet the 1% rule (rent ≥ 1% of price), the offer needs to be $172k (9.2% below list).
- Recommended offer: $172k (9.2% below list) — sets the bar for 1% rule.
Location & tenants
- Location reads 76/100 on livability (#222 in NY, #3,482 nationally) — a middle-class / working-renter tenant base. Strengths: commute A+, cost of living A+, housing A+; Watch: schools D+, crime F, employment F.
- Rochester City School District (urban): math 21% / reading 26% proficiency, ranked #589 of 590 in NY (top 100%) — low school quality limits family demand, transient renter base, plan for 1-2y turnover; 82% free/reduced lunch — lower-income household profile, screen leases tightly.
- Market conditions: Rents rising fast (+6.6%/yr); 51 active listings in the ZIP; 40 comparable units currently listed for rent nearby; rentals at typical pace (median 15d on market — plan ~3-4 weeks tenant-placement turnaround); lower-income renter base — watch delinquency; 1,169 units permitted in Monroe County in 2024 (591 in 5+ unit buildings).
- At $1,725/mo this rent would consume 51% of the median local household income ($41k/yr) (locally 1300% of renters already pay >50% of income on rent) — very limited rent-growth headroom before tenants either downsize or default.
Forward outlook
- In year one you build about $8k of equity ($1k loan paydown + $7k appreciation (3.7% local appreciation)).
- Monroe County population projected to shrink 6% by 2050 — rents likely to lag national; underwrite the cash flow, not the appreciation.
- At projected returns (3.7% appreciation + 6.6% rent growth), your $53k cash investment doubles in ~4 years — after that, you're playing with house money.
- By year 5, paydown + projected appreciation supports a ~$36k cash-out refi (75% LTV) — recoverable capital for the next deal without selling this one.
Negotiation context
- It's been on market 39 days — a 3% lower offer ($184k) is reasonable based on typical stale-listing flexibility.
- Current owner paid $22k; list at $190k implies a 767% gain — meaningful room to come down on a strong offer.
Risks & watch-outs
- Watch-outs: built in 1930 — expect roof / HVAC / electrical / plumbing capex.
- Climate carrying-cost: major flood risk — expect insurance premiums to compound above CPI over the hold.
Questions for the listing agent
- It's been on market 39 days. Have you received any prior offers? Is the seller open to a 9% concession, seller financing, or rate buy-down credit?
- Built in 1930 — when were the roof, HVAC, electrical panel, plumbing, and water heater last replaced?
- Is there a deadline driving the sale (1031 exchange, divorce, estate, relocation)? That informs how much negotiation room exists.
- Schools are D-rated, which usually means shorter tenancies and higher turnover. Who's the typical renter profile here, and what's been the actual vacancy rate?
- Crime grade is F in this area — have there been break-ins, vandalism, or insurance claims at this property in the last 3 years? What carrier currently insures it and at what premium?
- What's the average days-on-market for RENTAL listings here right now (not sales)? A rising rental-DOM trend means longer vacancies and softer asking-rent achievability than the comps imply.
- What's the recent tenant-quality profile in this submarket — average credit score on applications, eviction rate, late-payment / NSF rate, and stable-employment percentage? A property-management company in the area should have these aggregated.
- How much new for-sale + rental construction is in the pipeline within 1–3 miles? Heavy new supply typically softens prices + rents 12–24 months out; constrained supply supports both.
Investment metrics
- 1% rule
- 0.91% ✗
- Cap rate
- 7.84%
- Cash-on-cash
- 5.54%
- DSCR
- 1.25
- GRM
- 9.2
CMA / ARV
- ARV (on-the-fly)
- $131,820
- Comps found
- 12
Show comp detail 12 sales within ~0.75 mi
| Address | Dist | Beds/Ba | Sqft | Sold | Price | $/sf | Match |
|---|---|---|---|---|---|---|---|
| 91 Columbia Ave | 0.13mi | 3/1.5 | 1,518 (-10%) | 0mo | $145,000 | $96 | 75 |
| 215 Reynolds St | 0.25mi | 3/1.0 | 1,626 (-4%) | 5mo | $38,000 | $23 | 74 |
| 3 Fenwick St | 0.19mi | 3/1.0 | 1,908 (+13%) | 1mo | $136,000 | $71 | 64 |
| 392 Frost Ave | 0.32mi | 4/1.0 (+1) | 1,569 (-7%) | 2mo | $75,000 | $48 | 63 |
| 1283 Plymouth Ave S | 0.58mi | 4/2.0 (+1) | 1,621 (-4%) | 1mo | $200,000 | $123 | 60 |
| 163 Reynolds St | 0.39mi | 3/1.5 | 1,914 (+13%) | 2mo | $70,000 | $37 | 56 |
| 71 Aberdeen St | 0.66mi | 4/1.5 (+1) | 1,740 (+3%) | 2mo | $245,000 | $141 | 55 |
| 51 W High Ter | 0.72mi | 3/1.5 | 1,631 (-4%) | 5mo | $145,000 | $89 | 54 |
| 219 Adams St | 0.56mi | 4/1.0 (+1) | 1,564 (-8%) | 0mo | $72,000 | $46 | 52 |
| 33 Sawyer St | 0.58mi | 3/1.0 | 1,540 (-9%) | 4mo | $120,000 | $78 | 50 |
| 21 Gladstone St | 0.63mi | 4/1.0 (+1) | 1,584 (-6%) | 1mo | $10,000 | $6 | 50 |
| 153 Barton St | 0.71mi | 3/2.0 | 1,525 (-10%) | 2mo | $255,000 | $167 | 49 |
Match score weights: distance 35% · size 25% · config 20% · recency 20%. Top-matched comps best support the ARV.
Projected returns pro-forma
3.69% appreciation · 6.61% rent growth · sell at horizon
- IRR
- 16.2%
- Equity multiple
- 1.98×
- Total profit
- $51,932
- Equity at exit
- $92,872
- IRR
- 18.8%
- Equity multiple
- 4.12×
- Total profit
- $165,660
- Equity at exit
- $149,240
Cash invested: $53,172 (down + closing). Projections, not guarantees.
Landlord ↔ Tenant lean methodology
- Overall (STATE)
- 15 Strongly Tenant-Friendly
- State New York
- 15 Strongly Tenant-Friendly · D+10
- County
- — inherits STATE
- City
- — inherits STATE
ZIP-level market 14608
- Home prices YoY
- 1.3%
- Rents YoY
- 6.6%
- Active inventory
- 51
- Price-to-rent
- 9.2×
Monthly cashflow live
- Estimated rent
- $1,725 high interval (Pro) →
- Mortgage (P&I)
- −$996
- Tax from tax record
- −$42 /mo · $506/yr
- Insurance
- −$79
- HOA
- −$0
- Vacancy / Maint / Mgmt
- −$362
- Net cashflow
- $245
Break-even live
UW: 25.0% down · 7.5% · 30yr · 1.5% tax · 5.0% vac · 8.0% maint · 8.0% mgmt
Financing live
Cash to close
- Down payment
- $47,475
- Closing costs
- $5,697
- Reserves months
- —
- Total cash needed
- —
Loan-product check · same deal, 3 products live
Conventional
25% down · 7.5% · 30yr
- Down + closing
- —
- Monthly P&I
- —
- Monthly cashflow
- —
- DSCR
- —
- Eligible?
- —
Personal DTI + credit; lowest rate.
DSCR
20% down · 8.5% · 30yr
- Down + closing
- —
- Monthly P&I
- —
- Monthly cashflow
- —
- DSCR
- —
- Eligible?
- —
No personal income docs; deal must DSCR.
Hard money
10% down · 12.0% · 12mo
- Down + closing
- —
- Monthly P&I
- —
- Monthly cashflow
- —
- DSCR
- —
- Eligible?
- —
Short-term bridge; refi at stabilization.
Rent comps 40 comps
| Address | Beds | Baths | Sqft | Rent | $/sqft | DOM | Units | Dist |
|---|---|---|---|---|---|---|---|---|
| 249 1/2 Columbia Ave #249 Rochester, NY | 3.0 | 1.0 | 1600 | $1,300 | $0.81 | 14d | 1 | 0.12mi |
| 193 Reynolds St Rochester, NY | 3.0 | 1.5 | 1342 | $1,800 | $1.34 | 21d | 1 | 0.28mi |
| 367 Hawley St Rochester, NY | 4.0 | 1.5 | 1210 | $1,395 | $1.15 | 43d | 1 | 0.33mi |
| 192 Bartlett St Unit 192 Rochester, NY | 3.0 | 1.0 | 1099 | $1,295 | $1.18 | 14d | 1 | 0.35mi |
| 478 Tremont St Rochester, NY | 3.0 | 2.0 | 1424 | $1,500 | $1.05 | 43d | 1 | 0.52mi |
| 686 Seward St Rochester, NY | 3.0 | 1.5 | 1166 | $1,600 | $1.37 | 43d | 1 | 0.52mi |
| 106 Gregory St Rochester, NY | 3.0 | 1.5 | 1680 | $1,995 | $1.19 | 23d | 1 | 0.78mi |
| 94 Averill Ave Unit 2 Rochester, NY | 2.0 | 1.0 | 1200 | $1,500 | $1.25 | 3d | 1 | 0.85mi |
| 190 Warwick Ave Rochester, NY | 3.0 | 1.5 | 1240 | $1,400 | $1.13 | 43d | 1 | 0.89mi |
| 290 Exchange Blvd Rochester, NY | 2.0 | 1.0–2.0 | 892 | $2,102 | $2.36 | 2d | 15 | 0.94mi |
| 42 S Washington St Rochester, NY | 2.0 | 2.0 | 1298 | $2,300 | $1.77 | 43d | 1 | 0.96mi |
| 42 S Washington St Unit 401 Rochester, NY | 2.0 | 2.0 | 1298 | $2,300 | $1.77 | 23d | 1 | 0.96mi |
| 256 Gregory St Rochester, NY | 3.0 | 1.0 | 1150 | $1,700 | $1.48 | 43d | 1 | 1.00mi |
| 79 Evangeline St Rochester, NY | 3.0 | 2.0 | 1876 | $2,500 | $1.33 | 2d | 1 | 1.08mi |
| 13 S Fitzhugh St Rochester, NY | 1.0–2.0 | 1.5–2.0 | 890 | $2,098 | $2.36 | 10d | 2 | 1.09mi |
| 75 Stewart St Rochester, NY | 2.0 | 1.0 | 1840 | $1,300 | $0.71 | 19d | 1 | 1.10mi |
| 55 Exchange Blvd Rochester, NY | 2.0 | 1.0–2.0 | 952 | $2,695 | $2.83 | 3d | 28 | 1.12mi |
| 30 Flanders St Rochester, NY | 3.0 | 1.5 | 1170 | $1,650 | $1.41 | 14d | 1 | 1.13mi |
| 127 Congress Ave Rochester, NY | 3.0 | 1.0 | 1200 | $1,595 | $1.33 | 43d | 1 | 1.14mi |
| 59 Gold St Rochester, NY | 3.0 | 1.5 | 1264 | $2,000 | $1.58 | 43d | 1 | 1.16mi |
| 485 Sawyer St Unit 1 Rochester, NY | 3.0 | 1.0 | 1400 | $1,900 | $1.36 | 43d | 1 | 1.16mi |
| 485 Sawyer St Rochester, NY | 3.0 | 1.0 | 1400 | $1,900 | $1.36 | 2d | 1 | 1.16mi |
| 48 Thorndale Ter Rochester, NY | 4.0 | 1.5 | 1700 | $1,400 | $0.82 | 14d | 1 | 1.20mi |
| 39 State St Rochester, NY | 1.0–2.0 | 1.0–2.5 | 1154 | $3,500 | $3.03 | 3d | 8 | 1.21mi |
| 102 Court St Rochester, NY | 1.0–2.0 | 1.0–2.0 | 952 | $2,570 | $2.70 | 3d | 11 | 1.21mi |
| 416 Gregory St Unit Down Rochester, NY | 3.0 | 1.0 | 1374 | $1,995 | $1.45 | 23d | 1 | 1.22mi |
| 1331 Mt Hope Ave Rochester, NY | 2.0 | 1.0–2.0 | 949 | $2,725 | $2.87 | 2d | 5 | 1.23mi |
| 839 Elmwood Ave Rochester, NY | 3.0 | 1.0 | 1500 | $2,600 | $1.73 | 23d | 1 | 1.23mi |
| 132 Anthony St Rochester, NY | 3.0 | 1.0 | 1260 | $1,500 | $1.19 | 3d | 1 | 1.25mi |
| 793 Woodbine Ave Rochester, NY | 4.0 | 1.0 | 1700 | $2,200 | $1.29 | 2d | 1 | 1.26mi |
| 444-450 Brooks Ave Unit 446 Rochester, NY | 4.0 | 2.0 | 1150 | $3,100 | $2.70 | 10d | 1 | 1.32mi |
| 161 Fillmore St Rochester, NY | 4.0 | 2.0 | 1612 | $1,400 | $0.87 | 14d | 1 | 1.33mi |
| 451 Averill Ave Rochester, NY | 2.0 | 1.0 | 1352 | $1,695 | $1.25 | 3d | 1 | 1.36mi |
| 451 Averill Ave Rochester, NY | 2.0 | 1.0 | 1352 | $1,695 | $1.25 | 21d | 1 | 1.36mi |
| 102 Virginia Ave Rochester, NY | 4.0 | 1.5 | 1453 | $2,150 | $1.48 | 2d | 1 | 1.36mi |
| 1317 Genesee St Rochester, NY | 3.0 | 2.0 | 1720 | $2,550 | $1.48 | 2d | 1 | 1.37mi |
| 463 Averill Ave Unit 451 Averill Rochester, NY | 2.0 | 1.0 | 1352 | $1,695 | $1.25 | 21d | 1 | 1.39mi |
| 183 E Main St Rochester, NY | 1.0–2.0 | 1.0 | 1142 | $2,870 | $2.51 | 10d | 28 | 1.39mi |
| 355 Caroline St Rochester, NY | 3.0 | 1.0 | 1143 | $1,650 | $1.44 | 21d | 1 | 1.40mi |
| 271 Pearl St Unit 273 Rochester, NY | 3.0 | 1.0 | 1200 | $1,795 | $1.50 | 3d | 1 | 1.40mi |
Listing history 3 events
-
2026-03-29status Pending
-
2026-02-18$189,900 Active
-
1998-12-04soldstatus $21,900
ⓘ Source: listings_history table (triggers on properties + properties_extension) + one-shot
backfill from property_details.listing_events for pre-trigger history.
Tax reassessment forecast NY · Partial reset (capped growth)
- Current annual tax
- $506 · $42/mo
- Projected year-2 tax
- $1,858 · $155/mo
- Expected delta
- +$1,352/yr (+$113/mo · 267.0%)
ⓘ Screening estimate from a state-policy table — verify with the county assessor before closing.
Climate risk First Street
- Flood 6/10 Major FEMA zone X (unshaded) · 69% chance over 30 yrs
- Wildfire 1/10 Low
- Heat 2/10 Low 7 d/yr ≥96°F today · 15 d/yr by 30 yrs out
- Wind 1/10 Low
- Air quality 2/10 Low 1 unhealthy d/yr today · 1 by 30 yrs out
Nearby sold comps map
Loading sold comps map…
Walkable amenities ~0.75 mi
Loading nearby amenities…
Taxation est. · year 1
- Rental income
- $20,696
- − Mortgage interest
- −$10,637
- − Property taxes
- −$506
- − Insurance
- −$950
- − Repairs & maintenance
- −$1,656
- − Management
- −$1,656
- − Depreciation
- −$5,524
- Taxable loss
- −$233
- Est. tax savings @ 24.0%
- +$56
- After-tax cash flow
- $3,000/yr
For passive investors: Depreciation is non-cash, so a rental often shows a tax loss while cash-flowing — sheltering income. Rental losses are passive: they offset passive income freely, and up to $25,000/yr can offset ordinary (W-2) income if you actively participate and your MAGI is under $100k (phasing out to $0 by $150k); unused losses carry forward. On sale, claimed depreciation is recaptured at up to 25%, and gains may owe capital-gains tax (a 1031 exchange can defer both). Figures are a year-1 estimate at your 24.0% rate — not tax advice; consult a CPA.
Schools (NCES district)
- District
- Rochester City School District
- NCES district ID
- 3624750
- Math proficiency
- 21% ▬ 0.00%
- Reading proficiency
- 26% ▲ 4.00%
- Median HH income
- $30,923
- Composite
- 18.98/100
- National rank
- #8850
- State rank
- #589 of 590 in NY
Livability — Rochester
- Score
- 76/100
- State rank
- #222
- US rank
- #3482
Category grades
Schools grade is shown separately in the Schools card above.
Census & demographics
- Census place
- Rochester, NY
- County
- Monroe County · 674,131 people
- City population
- 432,803
- Metro
- Rochester, NY
- Population (ZIP)
- 12,792
- Household income
- $40,646
- Rent vs Own
- Severe rent burden
- 1300.0
Population outlook (Monroe County) Hauer SSP2
- Today (2025)
- 759,460 people
- By 2030
- 757,154 · -0.3%
- By 2040
- 740,644 · -2.5%
- By 2050
- 714,443 · -5.9%
- By 2075
- 645,883 · -15.0%
- By 2100
- 547,084 · -28.0%
Race, ethnicity, and origin ACS 2023
- Neighborhood character
- Diverse neighborhood (Simpson 0.67)
- Race & ethnicity
- Black 50% White 25% Two or more races 13% Hispanic / Latino 12% Asian 4%
- Hispanic origin (detail)
- Puerto Rican 10%
- Common ancestry
- Lithuanian 1% Romanian 1% Iranian 1%
- Foreign-born
- 8% · Canada, India
- Languages at home
- 85% English-only · Spanish 8% Other Indo-European 3% French/Haitian/Cajun 1%
Political lean MEDSL · Monroe
- 2024 margin
- D (+19.1) · D 59.5% · R 40.5%
- 2008→2024 swing
- +1.4pp toward D · 2008: 17.7pp · 2024: 19.1pp
- All cycles
- 2024: D+19.1 2020: D+21.0 2016: D+14.1 2012: D+17.4 2008: D+17.7
Not yet ingested
- Civics
- —
Market trends
- HPI YoY
- ▲ 3.69%
- Current HPI
- 280.2411
- Rent YoY
- ▲ 6.61%
- Metro
- Rochester, NY
- State GDP YoY
- ▲ 2.60%
- F500 in state
- 92
Industry mix (Fortune 500 HQ in NY)
| Industry | F500 HQs | Revenue |
|---|---|---|
| Financial Services | 10 | $950B |
|
||
| Consumer Goods | 9 | $162B |
|
||
| Insurance | 4 | $225B |
|
||
| Telecommunications | 2 | $144B |
|
||
| Pharmaceuticals | 2 | $112B |
|
||
| Media / Entertainment | 2 | $69B |
|
||
Price history
+767.1% since first listed3 events — show timeline
- 2026-03-29 Pending — UNYREIS
- 2026-02-18 Listed $189,900 UNYREIS
- 1998-12-04 Sold (Public Records) $21,900 Public Records
Property tax history
-0.8%/yrLatest (2025): $506 · +0.0% YoY. Source: county tax records.
Cash-flow waterfall
monthlySold comps — $/sqft
last 12 mo · ≤1 miLoading sold comps…