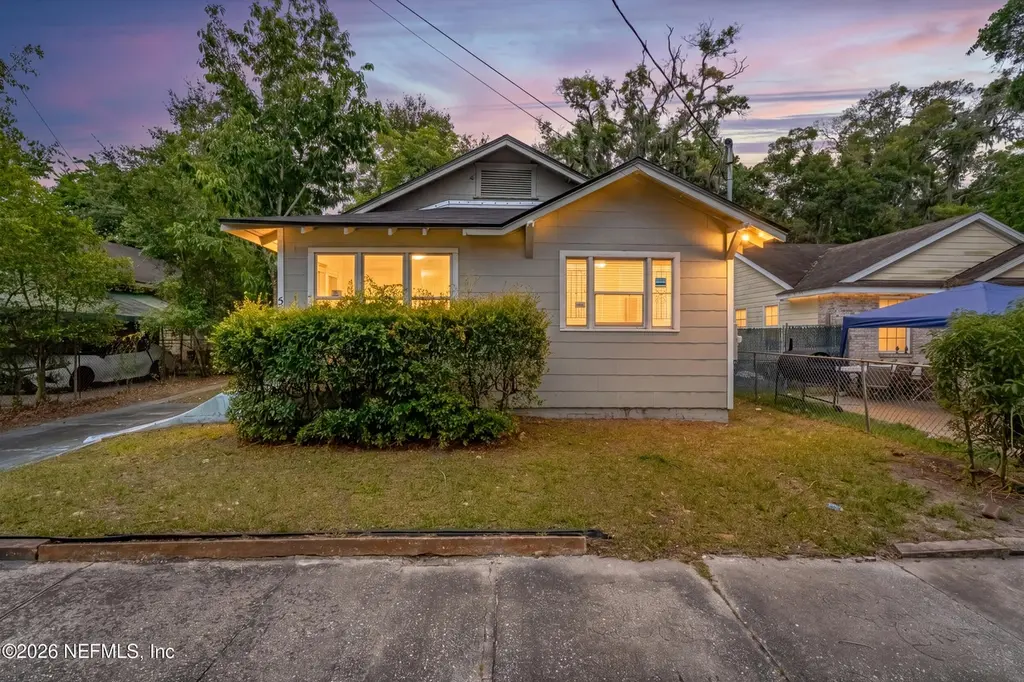
530 W 19th St · Jacksonville, FL
Flood risk 1/10 · Minimal
- FEMA flood zone
- X (unshaded)
- Chance of flooding over 30 yrs
- 0.0%
- Est. flood insurance / yr
- $507 – $1,088
Fire risk 1/10 · Minimal
- Est. fire insurance / yr
- $947 – $1,759
Heat risk 9/10 · Severe
- Hot days now (above 107°F)
- 7 days/yr
- Hot days in 30 yrs
- 20 days/yr
Wind risk 9/10 · Severe
- Chance of severe wind over 30 yrs
- 99.0%
Air-quality risk 4/10 · Minor
- Unhealthy air days now
- 6 days/yr
- Unhealthy air days in 30 yrs
- 6 days/yr
Risk factors via First Street. Map © Google.
Why this score? — see what drove the C grade
The composite is a weighted blend of 9 inputs, each scored 0–100. Each bar is that input's sub-score; the figure is the points it added to the 100-point composite (weight × sub-score).
- Cash flow +20.8/30.0
- ARV discount +9.7/15.0
- DSCR +6.6/10.0
- 1% rule +5.1/10.0
- Livability +4.2/5.0
- Schools +3.9/10.0
- Rent growth +2.7/5.0
- Condition / age +2.5/5.0
- Appreciation +0.0/10.0
$121,800
🖨 Deal sheet 📄 Offer letter ✓ Due diligence
Listing remarks MLS
The property is being sold as-is. The seller has never occupied the property. Buyer and Buyer's Agent are responsible for completing their own due diligence. Nestled in North Springfield Heights, this inviting 3-bedroom, 1-bath residence showcases spacious living areas, 9-foot ceilings, and distinctive historic details, offering both character and comfort.
Key facts
- 4,791 sq ft lot
- Built 1923
- Listed 32 days
Property features AI
Finance
- Financial info: Annual property tax listed (not shown per instructions)
- HOA & community: Not a senior community
Exterior
- Parking: Additional parking
- Utilities: Public sewer; Electricity available; Sewer available
- Home design: Single family residence; Residential use
- Exterior features: Lot approximately 0.11 acres; No private pool
Interior
- Bedrooms: 3 bedrooms
- Bathrooms: 2 full bathrooms
- Heating & cooling: Central heating (electric); Central air conditioning (electric)
- Interior features: Electric range
Neighborhood map
What this means for you Summary
Snapshot
- This is a 3-bed/1.0-bath single-family listed at $122k.
Deal economics
- At list price, monthly cash flow is $167 ($2k/yr) — positive.
- The deal already cash-flows at list — no discount required.
- Meets the 1% rule at list price ($1k rent vs $122k).
- Recommended offer: $118k (3.0% below list) — sets the bar for market timing.
- Cap rate 7.9% vs local median 4.0% in Jacksonville — top-decile yield for the area; either an underpriced asset or a hidden risk that comps aren't pricing in. Stress-test before assuming the spread holds.
Location & tenants
- Location reads 83/100 on livability (#50 in FL, #911 nationally) — a professional / high-income tenant draw. Strengths: amenities A+, commute A+, housing A+.
- Duval (urban): math 46% / reading 45% proficiency, ranked #48 of 73 in FL (top 66%) — families likely to look elsewhere, expect single-tenant / working-renter base with shorter leases.
- Market conditions: Rents flat; 194 active listings in the ZIP; 40 comparable units currently listed for rent nearby; rentals at typical pace (median 24d on market — plan ~3-4 weeks tenant-placement turnaround); lower-income renter base — watch delinquency; 6,503 units permitted in Duval County in 2024 (1,131 in 5+ unit buildings).
- This rent runs 38% of the median local income ($39k/yr) — at the standard rent-burdened threshold; future hikes will face affordability resistance.
Forward outlook
- Local home prices are declining (-3.0%/yr); year-one equity from $842 of loan paydown is wiped out by about $4k of value loss. Plan a longer hold.
- Duval County population projected at +19% by 2050 — long-run rental-demand tailwind backs the buy-and-hold thesis.
Negotiation context
- It's been on market 32 days — a 3% lower offer ($118k) is reasonable based on typical stale-listing flexibility.
- 19 sale attempts since 12y ago with the ask held roughly flat each time — persistent listings suggest the price (not the market) is what's stuck; bring a comps-based counter.
- Current owner paid $75k; list at $122k implies a 62% gain — meaningful room to come down on a strong offer.
Risks & watch-outs
- Watch-outs: built in 1923 — expect roof / HVAC / electrical / plumbing capex.
- Climate carrying-cost: severe wind risk, 99% chance of damaging wind over 30y; extreme-heat days projected 7→20/yr by 2055 (HVAC capex compounding) — expect insurance premiums to compound above CPI over the hold.
Questions for the listing agent
- It's been on market 32 days. Have you received any prior offers? Is the seller open to a 3% concession, seller financing, or rate buy-down credit?
- Built in 1923 — when were the roof, HVAC, electrical panel, plumbing, and water heater last replaced?
- Is there a deadline driving the sale (1031 exchange, divorce, estate, relocation)? That informs how much negotiation room exists.
- Schools are B-rated — typically a magnet for longer-tenancy family renters. What's the average tenant stay here, and is there a school-zone premium baked into asking?
- What's the average days-on-market for RENTAL listings here right now (not sales)? A rising rental-DOM trend means longer vacancies and softer asking-rent achievability than the comps imply.
- What's the recent tenant-quality profile in this submarket — average credit score on applications, eviction rate, late-payment / NSF rate, and stable-employment percentage? A property-management company in the area should have these aggregated.
- How much new for-sale + rental construction is in the pipeline within 1–3 miles? Heavy new supply typically softens prices + rents 12–24 months out; constrained supply supports both.
Investment metrics
- 1% rule
- 1.01% ✓
- Cap rate
- 7.94%
- Cash-on-cash
- 5.87%
- DSCR
- 1.26
- GRM
- 8.2
CMA / ARV
- ARV (on-the-fly)
- $128,088
- Comps found
- 12
Show comp detail 12 sales within ~0.75 mi
| Address | Dist | Beds/Ba | Sqft | Sold | Price | $/sf | Match |
|---|---|---|---|---|---|---|---|
| 3032 Laura St N | 0.39mi | 3/1.0 | 1,150 (-3%) | 4mo | $70,000 | $61 | 73 |
| 1058 W 17th St | 0.51mi | 3/2.0 | 1,182 (-0%) | 3mo | $200,000 | $169 | 69 |
| 321 W 24th St | 0.34mi | 3/1.0 | 1,110 (-6%) | 7mo | $95,000 | $86 | 68 |
| 522 W 21st St | 0.09mi | 3/2.0 | 1,045 (-12%) | 6mo | $58,500 | $56 | 67 |
| 40 W 11th St | 0.58mi | 2/1.0 (-1) | 1,196 (+1%) | 3mo | $295,000 | $247 | 64 |
| 705 Oak Arbor Cir | 0.44mi | 3/2.0 | 1,094 (-8%) | 1mo | $160,000 | $146 | 62 |
| 3918 Springfield Blvd | 0.60mi | 3/2.0 | 1,222 (+3%) | 3mo | $185,000 | $151 | 60 |
| 228 E 25th St | 0.73mi | 3/1.0 | 1,187 (+0%) | 7mo | $125,000 | $105 | 60 |
| 3410 N Lee St | 0.50mi | 3/1.0 | 1,056 (-11%) | 3mo | $100,000 | $95 | 56 |
| 1136 W 25th St | 0.66mi | 3/2.0 | 1,267 (+7%) | 0mo | $222,000 | $175 | 54 |
| 334 Birch St | 0.51mi | 3/1.0 | 1,008 (-15%) | 4mo | $50,000 | $50 | 48 |
| 4402 Springfield Blvd | 0.74mi | 3/1.0 | 1,082 (-9%) | 7mo | $116,500 | $108 | 45 |
Match score weights: distance 35% · size 25% · config 20% · recency 20%. Top-matched comps best support the ARV.
Projected returns pro-forma
-3.0% appreciation · 0.94% rent growth · sell at horizon
- IRR
- -9.5%
- Equity multiple
- 0.66×
- Total profit
- $-11,624
- Equity at exit
- $18,161
- IRR
- -3.0%
- Equity multiple
- 0.81×
- Total profit
- $-6,311
- Equity at exit
- $10,531
Cash invested: $34,104 (down + closing). Projections, not guarantees.
Landlord ↔ Tenant lean methodology
- Overall (STATE)
- 87 Strongly Landlord-Friendly
- State Florida
- 87 Strongly Landlord-Friendly · R+3
- County
- — inherits STATE
- City
- — inherits STATE
ZIP-level market 32206
- Home prices YoY
- -23.7%
- Rents YoY
- 0.9%
- Active inventory
- 194
- Price-to-rent
- 8.2×
Monthly cashflow live
- Estimated rent
- $1,231 high interval (Pro) →
- Mortgage (P&I)
- −$639
- Tax from tax record
- −$117 /mo · $1,400/yr
- Insurance
- −$51
- HOA
- −$0
- Vacancy / Maint / Mgmt
- −$259
- Net cashflow
- $167
Break-even live
UW: 25.0% down · 7.5% · 30yr · 1.5% tax · 5.0% vac · 8.0% maint · 8.0% mgmt
Financing live
Cash to close
- Down payment
- $30,450
- Closing costs
- $3,654
- Reserves months
- —
- Total cash needed
- —
Loan-product check · same deal, 3 products live
Conventional
25% down · 7.5% · 30yr
- Down + closing
- —
- Monthly P&I
- —
- Monthly cashflow
- —
- DSCR
- —
- Eligible?
- —
Personal DTI + credit; lowest rate.
DSCR
20% down · 8.5% · 30yr
- Down + closing
- —
- Monthly P&I
- —
- Monthly cashflow
- —
- DSCR
- —
- Eligible?
- —
No personal income docs; deal must DSCR.
Hard money
10% down · 12.0% · 12mo
- Down + closing
- —
- Monthly P&I
- —
- Monthly cashflow
- —
- DSCR
- —
- Eligible?
- —
Short-term bridge; refi at stabilization.
Rent comps 40 comps
| Address | Beds | Baths | Sqft | Rent | $/sqft | DOM | Units | Dist |
|---|---|---|---|---|---|---|---|---|
| 519 W 19th St Jacksonville, FL | 2.0 | 2.0 | 1071 | $1,095 | $1.02 | 21d | 1 | 0.06mi |
| 519 W 19th St Unit a Jacksonville, FL | 2.0 | 1.5 | 1071 | $1,095 | $1.02 | 21d | 1 | 0.06mi |
| 519 W 19th St Unit a Jacksonville, FL | 2.0 | 1.5 | 1071 | $1,075 | $1.00 | 13d | 1 | 0.06mi |
| 519 W 19th St Jacksonville, FL | 2.0 | 2.0 | 1071 | $1,075 | $1.00 | 4d | 1 | 0.06mi |
| 610 W 18th St Unit 1 Jacksonville, FL | 2.0 | 1.0 | 750 | $825 | $1.10 | 23d | 1 | 0.07mi |
| 610 W 18th St Unit 2 Jacksonville, FL | 2.0 | 1.0 | 750 | $825 | $1.10 | 2d | 1 | 0.07mi |
| 503 W 16th St Jacksonville, FL | 4.0 | 1.5 | 1216 | $1,420 | $1.17 | 23d | 1 | 0.09mi |
| 522 W 21st St Jacksonville, FL | 3.0 | 2.0 | 1045 | $1,350 | $1.29 | 23d | 1 | 0.13mi |
| 2817 Mars Ave Jacksonville, FL | 2.0 | 1.0 | 945 | $975 | $1.03 | 21d | 1 | 0.21mi |
| 2811 Venus St Jacksonville, FL | 2.0 | 1.0 | 830 | $1,087 | $1.31 | 4d | 1 | 0.25mi |
| 2906 Silver St Unit 01 Jacksonville, FL | 2.0 | 1.0 | 840 | $895 | $1.07 | 23d | 1 | 0.29mi |
| 347 W 23rd St Jacksonville, FL | 3.0 | 1.5 | 1176 | $1,112 | $0.95 | 7d | 1 | 0.30mi |
| 528 W 25th St Jacksonville, FL | 2.0 | 1.0 | 944 | $1,100 | $1.17 | 23d | 1 | 0.32mi |
| 204 W 23rd St Jacksonville, FL | 3.0 | 1.0 | 960 | $1,225 | $1.28 | 1d | 1 | 0.37mi |
| 3020 N Laura St Jacksonville, FL | 3.0 | 1.0 | 1162 | $1,300 | $1.12 | 23d | 1 | 0.39mi |
| 134 W 23rd St Jacksonville, FL | 2.0 | 1.0 | 768 | $1,050 | $1.37 | 23d | 1 | 0.40mi |
| 2314 Teal St Jacksonville, FL | 2.0 | 1.0 | 750 | $1,150 | $1.53 | 23d | 1 | 0.42mi |
| 916 W 25th St Jacksonville, FL | 2.0 | 1.0 | 816 | $1,025 | $1.26 | 17d | 1 | 0.47mi |
| 34 W 23rd St Jacksonville, FL | 3.0 | 1.5 | 962 | $1,400 | $1.46 | 23d | 1 | 0.48mi |
| 231 W 10th St Jacksonville, FL | 3.0 | 1.0 | 1200 | $1,500 | $1.25 | 23d | 1 | 0.49mi |
| 1018 W 23rd St Jacksonville, FL | 3.0 | 2.5 | 1161 | $1,600 | $1.38 | 23d | 1 | 0.49mi |
| 2313 Janette St Jacksonville, FL | 4.0 | 2.0 | 1148 | $1,349 | $1.18 | 16d | 1 | 0.51mi |
| 3730 Lehigh St Unit 3730 Jacksonville, FL | 2.0 | 1.0 | 850 | $900 | $1.06 | 14d | 1 | 0.52mi |
| 3732 Lehigh St Jacksonville, FL | 2.0 | 1.0 | 850 | $900 | $1.06 | 14d | 1 | 0.53mi |
| 2063 N Laura St Jacksonville, FL | 2.0 | 1.0 | 900 | $1,250 | $1.39 | 23d | 1 | 0.54mi |
| 2040 N Laura St Jacksonville, FL | 2.0 | 1.5 | 1300 | $1,498 | $1.15 | 23d | 1 | 0.54mi |
| 154 W 28th St Jacksonville, FL | 2.0 | 2.0 | 818 | $1,138 | $1.39 | 17d | 1 | 0.55mi |
| 2324 Moncrief Rd Unit 2324 Jacksonville, FL | 2.0 | 1.0 | 900 | $900 | $1.00 | 23d | 1 | 0.56mi |
| 2025 N Laura St Jacksonville, FL | 2.0 | 1.0 | 1000 | $1,195 | $1.20 | 4d | 1 | 0.58mi |
| 2532 Moncrief Rd Jacksonville, FL | 2.0 | 1.0 | 700 | $900 | $1.29 | 23d | 1 | 0.58mi |
| 118 W 28th St Jacksonville, FL | 3.0 | 2.0 | 1332 | $1,250 | $0.94 | 23d | 1 | 0.58mi |
| 3728 Silver St Jacksonville, FL | 2.0 | 1.0 | 916 | $1,100 | $1.20 | 23d | 1 | 0.59mi |
| 1031 W 26th St Jacksonville, FL | 3.0 | 2.0 | 1261 | $1,445 | $1.15 | 23d | 1 | 0.60mi |
| 1104 W 24th St Jacksonville, FL | 2.0 | 1.0 | 786 | $600 | $0.76 | 17d | 1 | 0.61mi |
| 3927 Notter Ave Jacksonville, FL | 2.0 | 1.0 | 738 | $850 | $1.15 | 21d | 1 | 0.62mi |
| 3927 Notter Ave Jacksonville, FL | 2.0 | 1.0 | 738 | $850 | $1.15 | 13d | 1 | 0.62mi |
| 3914 Springfield Blvd Jacksonville, FL | 2.0 | 1.0 | 858 | $1,050 | $1.22 | 4d | 1 | 0.62mi |
| 3914 Springfield Blvd Jacksonville, FL | 2.0 | 1.0 | 858 | $1,050 | $1.22 | 23d | 1 | 0.62mi |
| 849 W 30th St Apt 3 Jacksonville, FL | 2.0 | 1.0 | 750 | $965 | $1.29 | 23d | 1 | 0.64mi |
| 326 Basswood St Jacksonville, FL | 3.0 | 2.0 | 1317 | $1,550 | $1.18 | 23d | 1 | 0.65mi |
Listing history 50 events
-
2026-06-18days on market $121,800 Active 32 DOM
-
2026-06-17days on market $121,800 Active 31 DOM
-
2026-06-16days on market $121,800 Active 30 DOM
-
2026-06-15days on market $121,800 Active 29 DOM
-
2026-06-13days on market $121,800 Active 26 DOM
-
2026-06-10days on market $121,800 Active 23 DOM
-
2026-06-08days on market $121,800 Active 22 DOM
-
2026-06-07days on market $121,800 Active 21 DOM
-
2026-06-05days on market $121,800 Active 18 DOM
-
2026-06-03days on market $121,800 Active 17 DOM
-
2026-06-02days on market $121,800 Active 16 DOM
-
2026-06-01days on market $121,800 Active 15 DOM
-
2026-05-31days on market $121,800 Active 14 DOM
-
2026-05-17$121,800 Active
-
2026-05-08historical 364-char remark
Show marketing remark (364 chars)
The property is being sold as-is. The seller has never occupied the property. Buyer and Buyer's Agent are responsible for completing their own due diligence. Nestled in North Springfield Heights, this inviting 3-bedroom, 1-bath residence showcases spacious living areas, 9-foot ceilings, and distinctive historic details, offering both character and comfort.
-
2026-03-09price $120,000 364-char remark
Show marketing remark (364 chars)
The property is being sold as-is. The seller has never occupied the property. Buyer and Buyer's Agent are responsible for completing their own due diligence. Nestled in North Springfield Heights, this inviting 3-bedroom, 1-bath residence showcases spacious living areas, 9-foot ceilings, and distinctive historic details, offering both character and comfort.
-
2026-02-27status Active 364-char remark
Show marketing remark (364 chars)
The property is being sold as-is. The seller has never occupied the property. Buyer and Buyer's Agent are responsible for completing their own due diligence. Nestled in North Springfield Heights, this inviting 3-bedroom, 1-bath residence showcases spacious living areas, 9-foot ceilings, and distinctive historic details, offering both character and comfort.
-
2026-02-27price $95,000 364-char remark
Show marketing remark (364 chars)
The property is being sold as-is. The seller has never occupied the property. Buyer and Buyer's Agent are responsible for completing their own due diligence. Nestled in North Springfield Heights, this inviting 3-bedroom, 1-bath residence showcases spacious living areas, 9-foot ceilings, and distinctive historic details, offering both character and comfort.
-
2025-12-20historical 364-char remark
Show marketing remark (364 chars)
The property is being sold as-is. The seller has never occupied the property. Buyer and Buyer's Agent are responsible for completing their own due diligence. Nestled in North Springfield Heights, this inviting 3-bedroom, 1-bath residence showcases spacious living areas, 9-foot ceilings, and distinctive historic details, offering both character and comfort.
-
2025-12-18$80,000 Active 364-char remark
Show marketing remark (364 chars)
The property is being sold as-is. The seller has never occupied the property. Buyer and Buyer's Agent are responsible for completing their own due diligence. Nestled in North Springfield Heights, this inviting 3-bedroom, 1-bath residence showcases spacious living areas, 9-foot ceilings, and distinctive historic details, offering both character and comfort.
-
2023-09-27historical $1,150
-
2023-09-13price $1,150
-
2023-09-08price $1,184
-
2023-08-22$1,284
-
2023-07-05soldstatus $75,000
-
2023-06-30soldstatus $75,000 Sold 70-char remark
Show marketing remark (70 chars)
Home features real hardwood flooring, and Brick Fireplace. .Sold AS IS
-
2023-06-21status Pending 70-char remark
Show marketing remark (70 chars)
Home features real hardwood flooring, and Brick Fireplace. .Sold AS IS
-
2023-06-20Active - Contingent 70-char remark
Show marketing remark (70 chars)
Home features real hardwood flooring, and Brick Fireplace. .Sold AS IS
-
2023-06-18$105,000 70-char remark
Show marketing remark (70 chars)
Home features real hardwood flooring, and Brick Fireplace. .Sold AS IS
-
2023-06-18historical
Show marketing remark (70 chars)
Home features real hardwood flooring, and Brick Fireplace. .Sold AS IS
-
2023-05-19price $105,000
-
2023-05-06price $110,000
-
2023-03-27status Active
-
2023-03-22historical Active - Contingent
-
2023-03-17price $120,000
-
2023-01-18$125,000 Active
-
2022-12-27historical Active - Contingent
-
2022-12-27historical
-
2022-12-02price $125,000
-
2022-11-21status Active
-
2022-11-17status Pending
-
2022-11-14historical Active - Contingent
-
2022-11-11status Active
-
2022-11-09status Pending
-
2022-10-31historical Active - Contingent
-
2022-10-06status Active
-
2022-10-04status Pending
-
2022-09-26historical Active - Contingent
-
2022-09-16status Active
-
2022-08-29status Pending
ⓘ Source: listings_history table (triggers on properties + properties_extension) + one-shot
backfill from property_details.listing_events for pre-trigger history.
Tax reassessment forecast FL · Resets to sale price
- Current annual tax
- $1,400 · $117/mo
- Projected year-2 tax
- $1,400 · $117/mo
- Expected delta
- $0/yr ($0/mo · 0.0%)
ⓘ Screening estimate from a state-policy table — verify with the county assessor before closing.
Climate risk First Street
- Flood 1/10 Low FEMA zone X (unshaded) · 0% chance over 30 yrs
- Wildfire 1/10 Low
- Heat 9/10 Extreme 7 d/yr ≥107°F today · 20 d/yr by 30 yrs out
- Wind 9/10 Extreme 99% chance of damaging wind over 30 yrs
- Air quality 4/10 Moderate 6 unhealthy d/yr today · 6 by 30 yrs out
Nearby sold comps map
Loading sold comps map…
Walkable amenities ~0.75 mi
Loading nearby amenities…
Taxation est. · year 1
- Rental income
- $14,778
- − Mortgage interest
- −$6,823
- − Property taxes
- −$1,400
- − Insurance
- −$609
- − Repairs & maintenance
- −$1,182
- − Management
- −$1,182
- − Depreciation
- −$3,543
- Taxable income
- $38
- Est. tax owed @ 24.0%
- −$9
- After-tax cash flow
- $1,991/yr
For passive investors: Depreciation is non-cash, so a rental often shows a tax loss while cash-flowing — sheltering income. Rental losses are passive: they offset passive income freely, and up to $25,000/yr can offset ordinary (W-2) income if you actively participate and your MAGI is under $100k (phasing out to $0 by $150k); unused losses carry forward. On sale, claimed depreciation is recaptured at up to 25%, and gains may owe capital-gains tax (a 1031 exchange can defer both). Figures are a year-1 estimate at your 24.0% rate — not tax advice; consult a CPA.
Schools (NCES district)
- District
- Duval
- NCES district ID
- 1200480
- Math proficiency
- 46% ▼ -11.00%
- Reading proficiency
- 45% ▼ -4.00%
- Median HH income
- $48,987
- Composite
- 38.97/100
- National rank
- #4076
- State rank
- #48 of 73 in FL
Livability — Jacksonville
- Score
- 83/100
- State rank
- #50
- US rank
- #911
Category grades
Schools grade is shown separately in the Schools card above.
Census & demographics
- Census place
- Jacksonville, FL
- County
- Duval County · 1,015,274 people
- City population
- 979,034
- Metro
- Jacksonville, FL
- Population (ZIP)
- 17,105
- Household income
- $39,242
- Rent vs Own
- Severe rent burden
- 1057.0
Population outlook (Duval County) Hauer SSP2
- Today (2025)
- 1,013,010 people
- By 2030
- 1,059,228 · +4.6%
- By 2040
- 1,141,439 · +12.7%
- By 2050
- 1,205,258 · +19.0%
- By 2075
- 1,324,282 · +30.7%
- By 2100
- 1,319,620 · +30.3%
Race, ethnicity, and origin ACS 2023
- Neighborhood character
- Predominantly Black (65%)
- Race & ethnicity
- Black 65% White 22% Two or more races 8% Hispanic / Latino 6%
- Hispanic origin (detail)
- Mexican 1% Puerto Rican 2%
- Common ancestry
- Italian 2% Romanian 1% Slovak 1%
- Foreign-born
- 5% · Canada
- Languages at home
- 93% English-only · Spanish 3% Arabic 1% German/W. Germanic 1%
Political lean MEDSL · Duval
- 2024 margin
- Toss-up / Even · D 48.7% · R 50.1% · Other 1.2%
- 2008→2024 swing
- +0.4pp no change · 2008: -1.9pp · 2024: -1.5pp
- All cycles
- 2024: R+1.5 2020: D+3.8 2016: R+1.5 2012: R+3.6 2008: R+1.9
Not yet ingested
- Civics
- —
Market trends
- HPI YoY
- ▼ -64.55%
- Current HPI
- 208.1852
- Rent YoY
- ▲ 0.94%
- Metro
- Jacksonville, FL
- State GDP YoY
- ▲ 3.28%
- F500 in state
- 36
Industry mix (Fortune 500 HQ in FL)
| Industry | F500 HQs | Revenue |
|---|---|---|
| Industrial Technology | 2 | $29B |
|
||
| Insurance | 2 | $17B |
|
||
| Retail | 1 | $60B |
|
||
| Technology Distribution | 1 | $58B |
|
||
| Homebuilding | 1 | $35B |
|
||
| Technology Manufacturing | 1 | $35B |
|
||
Price history
+588.1% since first listed58 events — show timeline
- 2026-05-17 Listed $121,800 realMLS
- 2026-05-08 Listing Removed — realMLS
- 2026-03-09 Price Changed $120,000 realMLS
- 2026-02-27 Relisted — realMLS
- 2026-02-27 Price Changed $95,000 realMLS
- 2025-12-20 Listing Removed — realMLS
- 2025-12-18 Listed $80,000 realMLS
- 2023-09-27 Rental Removed $1,150 RENT.
- 2023-09-13 Price Changed $1,150 RENT.
- 2023-09-08 Price Changed $1,184 RENT.
- 2023-08-22 Listed for Rent $1,284 RENT.
- 2023-07-05 Sold (Public Records) $75,000 Public Records
- 2023-06-30 Sold (MLS) $75,000 realMLS
- 2023-06-21 Pending — realMLS
- 2023-06-20 Listed — realMLS
- 2023-06-18 Listing Removed — realMLS
- 2023-06-18 Listed $105,000 realMLS
- 2023-05-19 Price Changed $105,000 realMLS
- 2023-05-06 Price Changed $110,000 realMLS
- 2023-03-27 Relisted — realMLS
- 2023-03-22 Contingent — realMLS
- 2023-03-17 Price Changed $120,000 realMLS
- 2023-01-18 Listed $125,000 realMLS
- 2022-12-27 Contingent — realMLS
- 2022-12-27 Listing Removed — realMLS
- 2022-12-02 Price Changed $125,000 realMLS
- 2022-11-21 Relisted — realMLS
- 2022-11-17 Pending — realMLS
- 2022-11-14 Contingent — realMLS
- 2022-11-11 Relisted — realMLS
- 2022-11-09 Pending — realMLS
- 2022-10-31 Contingent — realMLS
- 2022-10-06 Relisted — realMLS
- 2022-10-04 Pending — realMLS
- 2022-09-26 Contingent — realMLS
- 2022-09-16 Relisted — realMLS
- 2022-08-29 Pending — realMLS
- 2022-08-22 Contingent — realMLS
- 2022-06-27 Listed $150,000 realMLS
- 2017-06-08 Sold (Public Records) $47,000 Public Records
- 2017-05-21 Listing Removed — realMLS
- 2017-05-16 Sold (MLS) $47,000 realMLS
- 2017-04-14 Pending — realMLS
- 2017-01-18 Price Changed $53,500 realMLS
- 2017-01-18 Price Changed $53,500 realMLS
- 2016-12-13 Listed $54,000 realMLS
- 2016-12-13 Listed $54,000 realMLS
- 2016-09-21 Listing Removed — realMLS
- 2016-07-05 Listed $55,000 realMLS
- 2015-04-16 Sold (MLS) $20,000 realMLS
- 2015-02-06 Pending — realMLS
- 2014-12-18 Relisted — realMLS
- 2014-12-18 Price Changed $20,000 realMLS
- 2014-12-16 Listing Removed — realMLS
- 2014-10-11 Relisted — realMLS
- 2014-10-10 Listing Removed — realMLS
- 2014-09-19 Listed $25,000 realMLS
- 1986-01-29 Sold (Public Records) $17,700 Public Records
Property tax history
+5.1%/yrLatest (2025): $1,400 · +12.5% YoY. Source: county tax records.
Cash-flow waterfall
monthlySold comps — $/sqft
last 12 mo · ≤1 miLoading sold comps…