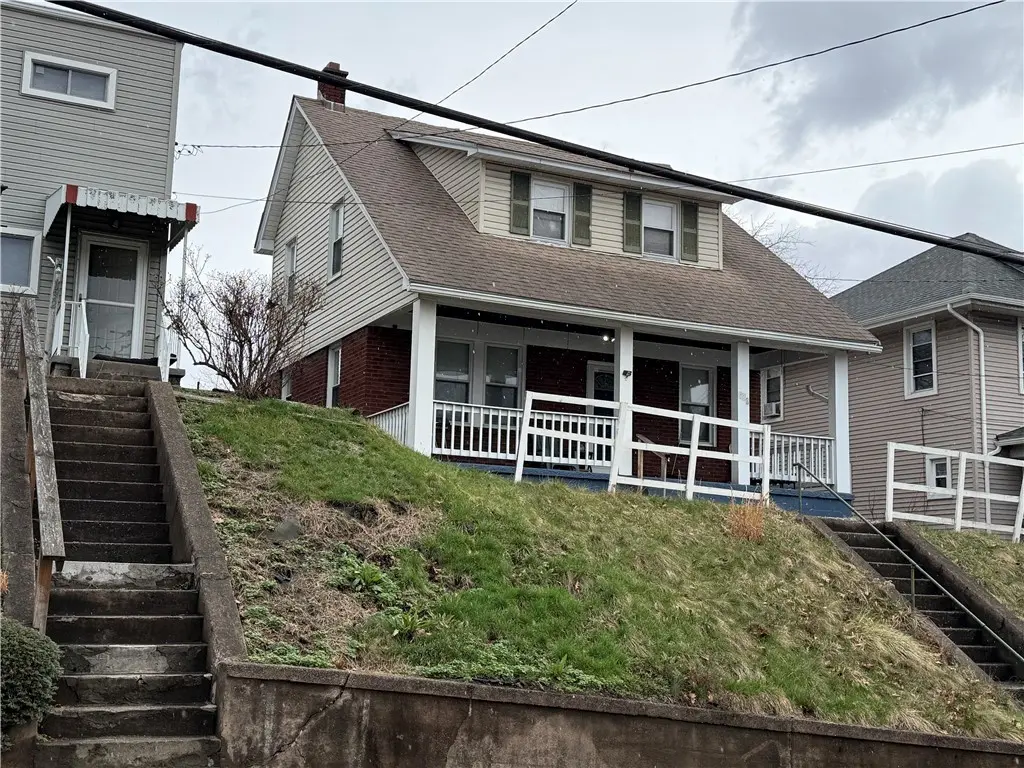
128 Carnegie Ave · Clairton, PA
Flood risk 1/10 · Minimal
- FEMA flood zone
- X (unshaded)
- Chance of flooding over 30 yrs
- 0.0%
- Est. flood insurance / yr
- $473 – $860
Fire risk 1/10 · Minimal
- Est. fire insurance / yr
- $511 – $949
Heat risk 4/10 · Minor
- Hot days now (above 98°F)
- 7 days/yr
- Hot days in 30 yrs
- 19 days/yr
Wind risk 2/10 · Minimal
- Chance of severe wind over 30 yrs
- —
Air-quality risk 5/10 · Moderate
- Unhealthy air days now
- 8 days/yr
- Unhealthy air days in 30 yrs
- 8 days/yr
Risk factors via First Street. Map © Google.
Why this score? — see what drove the C+ grade
The composite is a weighted blend of 9 inputs, each scored 0–100. Each bar is that input's sub-score; the figure is the points it added to the 100-point composite (weight × sub-score).
- Cash flow +30.0/30.0
- 1% rule +10.0/10.0
- DSCR +10.0/10.0
- Rent growth +5.0/5.0
- Livability +3.2/5.0
- Condition / age +2.5/5.0
- Schools +1.1/10.0
- ARV discount +0.5/15.0
- Appreciation +0.0/10.0
$85,000
🖨 Deal sheet 📄 Offer letter ✓ Due diligence
Listing remarks MLS
Updated home offers a great primary residence of investment. The spacious first floor offers a comfortable living room, formal dining room and kitchen. With three upstairs bedrooms, this home was renovated in 2024-2025 and is presently tenant occupied. The re is a large covered front porch for relaxing and alley access to the off street parking in the rear.
Key facts
- Alley access
- Spacious first floor
- Formal dining room
Tags
Neighborhood map
What this means for you Summary
Snapshot
- This is a 3-bed/1.0-bath single-family listed at $85k.
Deal economics
- At list price, monthly cash flow is $407 ($5k/yr) — positive.
- The deal already cash-flows at list — no discount required.
- Meets the 1% rule at list price ($1k rent vs $85k).
- Recommended offer: $80k (6.0% below list) — sets the bar for market timing.
Location & tenants
- Location reads 63/100 on livability (#1,308 in PA) — a middle-class / working-renter tenant base. Strengths: cost of living A+, housing A; Watch: crime C-, health & safety D+, schools F.
- Clairton City SD (suburban): math 7% / reading 21% proficiency, ranked #520 of 539 in PA (top 96%) — low school quality limits family demand, transient renter base, plan for 1-2y turnover; 82% free/reduced lunch — lower-income household profile, screen leases tightly.
- Market conditions: Rents rising fast (+10.5%/yr); 94 active listings in the ZIP; 15 comparable units currently listed for rent nearby; rentals at typical pace (median 24d on market — plan ~3-4 weeks tenant-placement turnaround); 47% of comp listings sitting > 30 days — soft ceiling on asking rent; solid renter incomes; 2,996 units permitted in Allegheny County in 2024 (1,588 in 5+ unit buildings).
Forward outlook
- Local home prices are declining (-3.0%/yr); year-one equity from $588 of loan paydown is wiped out by about $3k of value loss. Plan a longer hold.
- At projected returns (-3.0% appreciation + 8.0% rent growth), your $24k cash investment doubles in ~5 years — after that, you're playing with house money.
Negotiation context
- It's been on market 87 days — a 6% lower offer ($80k) is reasonable based on typical stale-listing flexibility.
- 2 sale attempts since 14y ago; this cycle's ask has dropped $15k (15%) from the opening price — seller is motivated, your offer sets the floor, not the list.
Risks & watch-outs
- Watch-outs: built in 1930 — expect roof / HVAC / electrical / plumbing capex.
Questions for the listing agent
- It's been on market 87 days. Have you received any prior offers? Is the seller open to a 6% concession, seller financing, or rate buy-down credit?
- Built in 1930 — when were the roof, HVAC, electrical panel, plumbing, and water heater last replaced?
- Why hasn't it sold? Are there any deal-killer items the seller is aware of (foundation, flood, title, zoning, code violations)?
- Is there a deadline driving the sale (1031 exchange, divorce, estate, relocation)? That informs how much negotiation room exists.
- Schools are F-rated, which usually means shorter tenancies and higher turnover. Who's the typical renter profile here, and what's been the actual vacancy rate?
- What's the average days-on-market for RENTAL listings here right now (not sales)? A rising rental-DOM trend means longer vacancies and softer asking-rent achievability than the comps imply.
- What's the recent tenant-quality profile in this submarket — average credit score on applications, eviction rate, late-payment / NSF rate, and stable-employment percentage? A property-management company in the area should have these aggregated.
- How much new for-sale + rental construction is in the pipeline within 1–3 miles? Heavy new supply typically softens prices + rents 12–24 months out; constrained supply supports both.
Investment metrics
- 1% rule
- 1.58% ✓
- Cap rate
- 12.04%
- Cash-on-cash
- 20.54%
- DSCR
- 1.91
- GRM
- 5.3
CMA / ARV
- ARV (median comp)
- $73,624
- List price
- $85,000
- Delta
- 15.45%
- Verdict
- OVERPRICED
- Comps
- 20 within 1.0 mi
Show comp detail 12 sales within ~0.75 mi
| Address | Dist | Beds/Ba | Sqft | Sold | Price | $/sf | Match |
|---|---|---|---|---|---|---|---|
| 416 Walnut Ave | 0.21mi | 3/1.0 | 1,100 (-1%) | 4mo | $70,000 | $64 | 86 |
| 412 N 4th St | 0.24mi | 3/1.0 | 1,080 (-3%) | 13mo | $77,000 | $71 | 73 |
| 811 N State | 0.15mi | 2/1.0 (-1) | 960 (-14%) | 6mo | $35,000 | $36 | 61 |
| 526 State Route 885 | 0.28mi | 3/2.0 | 992 (-11%) | 5mo | $152,000 | $153 | 60 |
| 320 N 3rd | 0.29mi | 3/1.0 | 1,024 (-8%) | 22mo | $73,000 | $71 | 55 |
| 423 N 3rd St | 0.21mi | 2/2.0 (-1) | 1,050 (-6%) | 23mo | $99,500 | $95 | 52 |
| 1035 Ohio Ave | 0.61mi | 3/1.0 | 1,134 (+2%) | 24mo | $80,000 | $71 | 49 |
| 1040 Indiana Ave | 0.64mi | 3/2.0 | 1,160 (+4%) | 14mo | $138,500 | $119 | 47 |
| 1029 Pennsylvania Ave | 0.37mi | 2/1.0 (-1) | 1,000 (-10%) | 18mo | $63,000 | $63 | 46 |
| 934 Vermont Ave | 0.74mi | 3/1.0 | 1,056 (-5%) | 16mo | $20,000 | $19 | 44 |
| 1007 N 6th St | 0.36mi | 3/2.0 | 1,250 (+12%) | 19mo | $87,500 | $70 | 43 |
| 1036 Indiana Ave | 0.65mi | 3/1.5 | 1,256 (+13%) | 19mo | $95,000 | $76 | 30 |
Match score weights: distance 35% · size 25% · config 20% · recency 20%. Top-matched comps best support the ARV.
Projected returns pro-forma
-3.0% appreciation · 8.0% rent growth · sell at horizon
- IRR
- 18.8%
- Equity multiple
- 1.81×
- Total profit
- $19,327
- Equity at exit
- $12,674
- IRR
- 30.6%
- Equity multiple
- 4.48×
- Total profit
- $82,786
- Equity at exit
- $7,349
Cash invested: $23,800 (down + closing). Projections, not guarantees.
Landlord ↔ Tenant lean methodology
- Overall (STATE)
- 62 Landlord-Friendly
- State Pennsylvania
- 62 Landlord-Friendly · EVEN
- County
- — inherits STATE
- City
- — inherits STATE
ZIP-level market 15025
- Home prices YoY
- -34.4%
- Rents YoY
- 10.5%
- Active inventory
- 94
- Price-to-rent
- 5.3×
Monthly cashflow live
- Estimated rent
- $1,343 high interval (Pro) →
- Mortgage (P&I)
- −$446
- Tax from tax record
- −$173 /mo · $2,071/yr
- Insurance
- −$35
- HOA
- −$0
- Vacancy / Maint / Mgmt
- −$282
- Net cashflow
- $407
Break-even live
UW: 25.0% down · 7.5% · 30yr · 1.5% tax · 5.0% vac · 8.0% maint · 8.0% mgmt
Financing live
Cash to close
- Down payment
- $21,250
- Closing costs
- $2,550
- Reserves months
- —
- Total cash needed
- —
Loan-product check · same deal, 3 products live
Conventional
25% down · 7.5% · 30yr
- Down + closing
- —
- Monthly P&I
- —
- Monthly cashflow
- —
- DSCR
- —
- Eligible?
- —
Personal DTI + credit; lowest rate.
DSCR
20% down · 8.5% · 30yr
- Down + closing
- —
- Monthly P&I
- —
- Monthly cashflow
- —
- DSCR
- —
- Eligible?
- —
No personal income docs; deal must DSCR.
Hard money
10% down · 12.0% · 12mo
- Down + closing
- —
- Monthly P&I
- —
- Monthly cashflow
- —
- DSCR
- —
- Eligible?
- —
Short-term bridge; refi at stabilization.
Rent comps 15 comps
| Address | Beds | Baths | Sqft | Rent | $/sqft | DOM | Units | Dist |
|---|---|---|---|---|---|---|---|---|
| 185 Carnegie Ave Clairton, PA | 3.0 | 1.0 | 1404 | $1,295 | $0.92 | 43d | 1 | 0.10mi |
| 507 N 6th St Clairton, PA | 2.0 | 1.5 | 1120 | $1,250 | $1.12 | 43d | 1 | 0.26mi |
| 231 Connecticut Ave Clairton, PA | 3.0 | 1.0 | 1064 | $1,150 | $1.08 | 43d | 1 | 0.30mi |
| 441 Ohio Ave Clairton, PA | 2.0 | 1.0 | 852 | $950 | $1.12 | 20d | 1 | 0.33mi |
| 1044 Delaware Ave Glassport, PA | 3.0 | 1.0 | 1200 | $1,350 | $1.12 | 20d | 1 | 0.66mi |
| 833 Vermont Ave Glassport, PA | 3.0 | 1.0 | 1290 | $1,395 | $1.08 | 23d | 1 | 0.88mi |
| 701-703 Waddell Ave Clairton, PA | 4.0 | 1.0 | 1200 | $1,850 | $1.54 | 1d | 1 | 1.00mi |
| 642 Ohio Ave Unit 1 Glassport, PA | 2.0 | 1.0 | 700 | $1,200 | $1.71 | 43d | 1 | 1.07mi |
| 526 Ohio Ave Unit 3 Glassport, PA | 2.0 | 1.0 | 800 | $900 | $1.12 | 43d | 1 | 1.22mi |
| 505 Wylie Ave Clairton, PA | 2.0 | 1.0 | 791 | $1,500 | $1.90 | 1d | 1 | 1.30mi |
| 511 Payne Hill Rd Clairton, PA | 1.0–3.0 | 1.0–2.0 | 1026 | $1,900 | $1.85 | 1d | 1 | 1.37mi |
| 350 Wylie Ave Unit 1 Clairton, PA | 2.0 | 1.0 | 1152 | $1,050 | $0.91 | 43d | 1 | 1.42mi |
| 753 East Dr Clairton, PA | 3.0 | 1.0 | 1000 | $1,100 | $1.10 | 43d | 1 | 1.44mi |
| 127 Constitution Cir Clairton, PA | 2.0 | 1.0 | 1063 | $1,275 | $1.20 | 10d | 1 | 1.48mi |
| 127 Constitution Cir Clairton, PA | 2.0 | 1.0 | 972 | $1,275 | $1.31 | 1d | 1 | 1.48mi |
Listing history 11 events
-
2026-06-09days on market $85,000 Active 87 DOM
-
2026-06-08days on market $85,000 Active 86 DOM
-
2026-06-07days on market $85,000 Active 85 DOM
-
2026-06-05days on market $85,000 Active 82 DOM
-
2026-06-03days on market $85,000 Active 81 DOM
-
2026-06-02days on market $85,000 Active 80 DOM
-
2026-06-01days on market $85,000 Active 79 DOM
-
2026-05-31days on market $85,000 Active 78 DOM
-
2026-05-01price $85,000 359-char remark
Show marketing remark (359 chars)
Updated home offers a great primary residence of investment. The spacious first floor offers a comfortable living room, formal dining room and kitchen. With three upstairs bedrooms, this home was renovated in 2024-2025 and is presently tenant occupied. The re is a large covered front porch for relaxing and alley access to the off street parking in the rear.
-
2026-03-14$99,900 Active 359-char remark
Show marketing remark (359 chars)
Updated home offers a great primary residence of investment. The spacious first floor offers a comfortable living room, formal dining room and kitchen. With three upstairs bedrooms, this home was renovated in 2024-2025 and is presently tenant occupied. The re is a large covered front porch for relaxing and alley access to the off street parking in the rear.
-
2012-06-27$49,900 211-char remark
Show marketing remark (211 chars)
hy rent when you can own this adorable 3 bedroom home located in Wilson. Enjoy your morning coffee on the front porch. This well maintained home would be great for any family. Call today! Home warranty included
ⓘ Source: listings_history table (triggers on properties + properties_extension) + one-shot
backfill from property_details.listing_events for pre-trigger history.
Tax reassessment forecast PA · Partial reset (capped growth)
- Current annual tax
- $2,071 · $173/mo
- Projected year-2 tax
- $2,071 · $173/mo
- Expected delta
- $0/yr ($0/mo · 0.0%)
ⓘ Screening estimate from a state-policy table — verify with the county assessor before closing.
Climate risk First Street
- Flood 1/10 Low FEMA zone X (unshaded) · 0% chance over 30 yrs
- Wildfire 1/10 Low
- Heat 4/10 Moderate 7 d/yr ≥98°F today · 19 d/yr by 30 yrs out
- Wind 2/10 Low
- Air quality 5/10 Major 8 unhealthy d/yr today · 8 by 30 yrs out
Nearby sold comps map
Loading sold comps map…
Walkable amenities ~0.75 mi
Loading nearby amenities…
Taxation est. · year 1
- Rental income
- $16,117
- − Mortgage interest
- −$4,761
- − Property taxes
- −$2,071
- − Insurance
- −$425
- − Repairs & maintenance
- −$1,289
- − Management
- −$1,289
- − Depreciation
- −$2,473
- Taxable income
- $3,808
- Est. tax owed @ 24.0%
- −$914
- After-tax cash flow
- $3,974/yr
For passive investors: Depreciation is non-cash, so a rental often shows a tax loss while cash-flowing — sheltering income. Rental losses are passive: they offset passive income freely, and up to $25,000/yr can offset ordinary (W-2) income if you actively participate and your MAGI is under $100k (phasing out to $0 by $150k); unused losses carry forward. On sale, claimed depreciation is recaptured at up to 25%, and gains may owe capital-gains tax (a 1031 exchange can defer both). Figures are a year-1 estimate at your 24.0% rate — not tax advice; consult a CPA.
Schools (NCES district)
- District
- Clairton City SD
- NCES district ID
- 4206030
- Math proficiency
- 7% ▼ -11.00%
- Reading proficiency
- 21% ▼ -12.00%
- Median HH income
- $30,250
- Composite
- 11.0/100
- National rank
- #9742
- State rank
- #520 of 539 in PA
Livability — Clairton
- Score
- 63/100
- State rank
- #1308
- US rank
- #16085
Category grades
Schools grade is shown separately in the Schools card above.
Census & demographics
- Census place
- Clairton, PA
- County
- Allegheny County · 1,022,028 people
- City population
- 16,939
- Metro
- Pittsburgh, PA
- Population (ZIP)
- 16,939
- Household income
- $76,531
- Rent vs Own
- Severe rent burden
- 572.0
Population outlook (Allegheny County) Hauer SSP2
- Today (2025)
- 1,250,282 people
- By 2030
- 1,256,482 · +0.5%
- By 2040
- 1,256,318 · +0.5%
- By 2050
- 1,244,169 · -0.5%
- By 2075
- 1,197,693 · -4.2%
- By 2100
- 1,093,187 · -12.6%
Race, ethnicity, and origin ACS 2023
- Neighborhood character
- Predominantly White (74%)
- Race & ethnicity
- White 74% Black 18% Two or more races 4% Asian 2% Hispanic / Latino 2%
- Common ancestry
- Romanian 6% Lithuanian 2% Slovak 1%
- Foreign-born
- 4% · China, Canada, India
- Languages at home
- 96% English-only · Other Indo-European 1% Chinese 1% Spanish 1%
Political lean MEDSL · Allegheny
- 2024 margin
- Strong D (+20.3) · D 59.7% · R 39.4%
- 2008→2024 swing
- +4.8pp toward D · 2008: 15.5pp · 2024: 20.3pp
- All cycles
- 2024: D+20.3 2020: D+20.4 2016: D+16.4 2012: D+14.4 2008: D+15.5
Not yet ingested
- Civics
- —
Market trends
- HPI YoY
- ▼ -96.35%
- Current HPI
- 183.858
- Rent YoY
- ▲ 10.47%
- Metro
- Pittsburgh, PA
- State GDP YoY
- ▲ 1.68%
- F500 in state
- 34
Industry mix (Fortune 500 HQ in PA)
| Industry | F500 HQs | Revenue |
|---|---|---|
| Healthcare | 2 | $309B |
|
||
| Insurance | 2 | $27B |
|
||
| Telecommunications / Media | 1 | $124B |
|
||
| Industrial Distribution | 1 | $22B |
|
||
| Financial Services | 1 | $20B |
|
||
| Chemicals / Materials | 1 | $18B |
|
||
Price history
+70.3% since first listed3 events — show timeline
- 2026-05-01 Price Changed $85,000 West Penn MLS
- 2026-03-14 Listed $99,900 West Penn MLS
- 2012-06-27 Listed $49,900 West Penn MLS
Property tax history
+16.0%/yrLatest (2026): $2,071 · +11.0% YoY. Source: county tax records.
Cash-flow waterfall
monthlySold comps — $/sqft
last 12 mo · ≤1 miLoading sold comps…