None · Calverton, NY
Flood risk 7/10 · Major
- FEMA flood zone
- X (unshaded)
- Chance of flooding over 30 yrs
- 0.78%
- Est. flood insurance / yr
- $473 – $860
Fire risk 3/10 · Minor
- Est. fire insurance / yr
- $691 – $1,283
Heat risk 4/10 · Minor
- Hot days now (above 93°F)
- 7 days/yr
- Hot days in 30 yrs
- 18 days/yr
Wind risk 8/10 · Major
- Chance of severe wind over 30 yrs
- 80.0%
Air-quality risk 3/10 · Minor
- Unhealthy air days now
- 2 days/yr
- Unhealthy air days in 30 yrs
- 3 days/yr
Risk factors via First Street. Map © Google.
Why this score? — see what drove the B- grade
The composite is a weighted blend of 9 inputs, each scored 0–100. Each bar is that input's sub-score; the figure is the points it added to the 100-point composite (weight × sub-score).
- Cash flow +30.0/30.0
- 1% rule +10.0/10.0
- DSCR +10.0/10.0
- Appreciation +6.6/10.0
- Schools +3.6/10.0
- Livability +2.9/5.0
- Rent growth +2.5/5.0
- Condition / age +2.5/5.0
- ARV discount +0.0/15.0
$129,900
🖨 Deal sheet 📄 Offer letter ✓ Due diligence
Listing remarks MLS
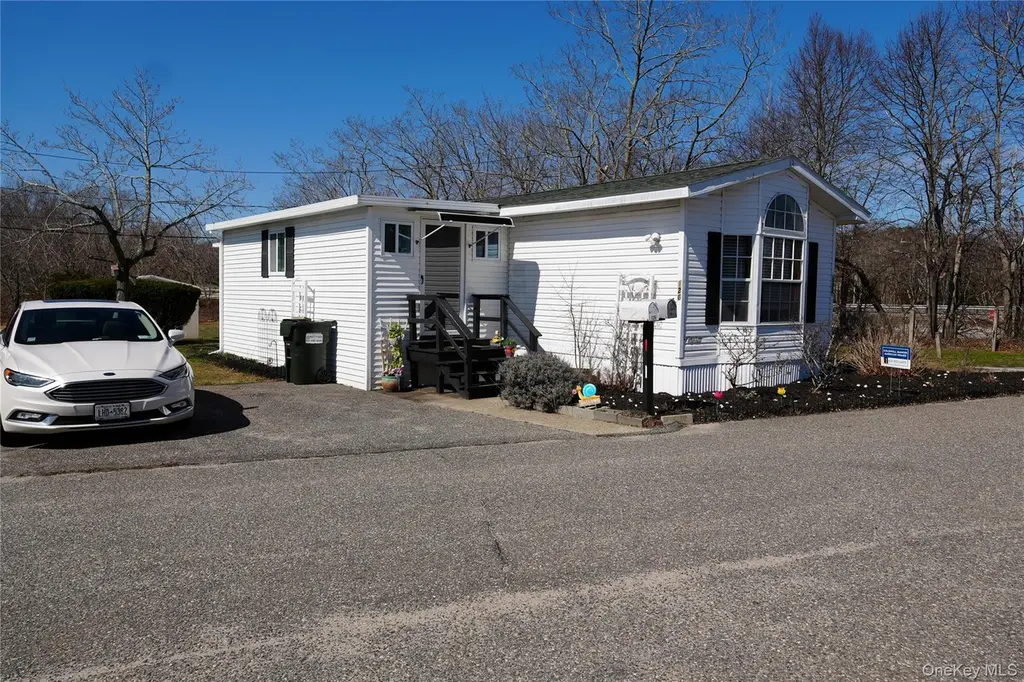
55+ Community- park approval is required. 2/3 Bedrooms or office or extra den, Full Bath, Large Living Room, Open Kitchen , Foyer, Vaulted Master - light & bright, Very clean & neat. New Floors, Fresh Paint, New water heating system, Just move right in !
Key facts
- New floors
- Fresh paint
- Built 1991
Tags
Neighborhood map
What this means for you Summary
Snapshot
- This is a 3-bed/1.0-bath manufactured listed at $130k.
Deal economics
- At list price, monthly cash flow is $895 ($11k/yr) — positive.
- The deal already cash-flows at list — no discount required.
- Meets the 1% rule at list price ($4k rent vs $130k).
- Recommended offer: $118k (9.0% below list) — sets the bar for market timing.
- Cap rate 15.1% vs local median 7.2% in Calverton — top-decile yield for the area; either an underpriced asset or a hidden risk that comps aren't pricing in. Stress-test before assuming the spread holds.
Location & tenants
- Location reads 58/100 on livability (#1,053 in NY) — a working-class tenant base; expect higher turnover. Watch: crime C-, schools D, employment D.
- Riverhead Central School District (suburban): math 34% / reading 48% proficiency, ranked #489 of 590 in NY (top 83%) — families likely to look elsewhere, expect single-tenant / working-renter base with shorter leases.
- Market conditions: 84 active listings in the ZIP; 1,366 units permitted in Suffolk County in 2024 (216 in 5+ unit buildings).
Forward outlook
- In year one you build about $5k of equity ($898 loan paydown + $4k appreciation (3.3% local appreciation)).
- Suffolk County population projected to shrink 5% by 2050 — rents likely to lag national; underwrite the cash flow, not the appreciation.
- At projected returns (3.3% appreciation + 3.0% rent growth), your $36k cash investment doubles in ~3 years — after that, you're playing with house money.
- By year 7, paydown + projected appreciation supports a ~$32k cash-out refi (75% LTV) — recoverable capital for the next deal without selling this one.
Negotiation context
- It's been on market 120 days — a 9% lower offer ($118k) is reasonable based on typical stale-listing flexibility.
- 3 sale attempts since 4y ago with the ask held roughly flat each time — persistent listings suggest the price (not the market) is what's stuck; bring a comps-based counter.
Risks & watch-outs
- Watch-outs: flood insurance adds $56/mo; HOA is 30% of rent.
- Climate carrying-cost: major flood risk; severe wind risk, 80% chance of damaging wind over 30y — expect insurance premiums to compound above CPI over the hold.
Questions for the listing agent
- It's been on market 120 days. Have you received any prior offers? Is the seller open to a 9% concession, seller financing, or rate buy-down credit?
- What's the actual annual flood-insurance premium (NFIP or private), and is the property in a SFHA with mandatory coverage?
- What does the HOA fee cover, when was the last increase, and are there any pending special assessments or reserve-fund shortfalls?
- Why hasn't it sold? Are there any deal-killer items the seller is aware of (foundation, flood, title, zoning, code violations)?
- Is there a deadline driving the sale (1031 exchange, divorce, estate, relocation)? That informs how much negotiation room exists.
- Schools are D-rated, which usually means shorter tenancies and higher turnover. Who's the typical renter profile here, and what's been the actual vacancy rate?
- What's the average days-on-market for RENTAL listings here right now (not sales)? A rising rental-DOM trend means longer vacancies and softer asking-rent achievability than the comps imply.
- What's the recent tenant-quality profile in this submarket — average credit score on applications, eviction rate, late-payment / NSF rate, and stable-employment percentage? A property-management company in the area should have these aggregated.
- How much new for-sale + rental construction is in the pipeline within 1–3 miles? Heavy new supply typically softens prices + rents 12–24 months out; constrained supply supports both.
Investment metrics
- 1% rule
- 2.91% ✓
- Cap rate
- 15.07%
- Cash-on-cash
- 31.36%
- DSCR
- 2.40
- GRM
- 2.9
CMA / ARV
- ARV (median comp)
- $96,763
- List price
- $129,900
- Delta
- 34.25%
- Verdict
- OVERPRICED
- Comps
- 6 within 1.0 mi
Show comp detail 3 sales within ~0.75 mi
| Address | Dist | Beds/Ba | Sqft | Sold | Price | $/sf | Match |
|---|---|---|---|---|---|---|---|
| 1964 River Rd #37 | 0.13mi | 3/1.0 | 964 (-2%) | 6mo | $65,000 | $67 | 86 |
| 1964 River Rd #106 | 0.13mi | 2/1.0 (-1) | 900 (-8%) | 1mo | $92,000 | $102 | 75 |
| 1964 River Rd #35 | 0.13mi | 2/1.0 (-1) | 850 (-13%) | 2mo | $70,000 | $82 | 65 |
Match score weights: distance 35% · size 25% · config 20% · recency 20%. Top-matched comps best support the ARV.
Projected returns pro-forma
3.26% appreciation · 3.0% rent growth · sell at horizon
- IRR
- 36.1%
- Equity multiple
- 3.07×
- Total profit
- $75,244
- Equity at exit
- $60,317
- IRR
- 36.1%
- Equity multiple
- 6.14×
- Total profit
- $186,877
- Equity at exit
- $94,467
Cash invested: $36,372 (down + closing). Projections, not guarantees.
Landlord ↔ Tenant lean methodology
- Overall (STATE)
- 15 Strongly Tenant-Friendly
- State New York
- 15 Strongly Tenant-Friendly · D+10
- County
- — inherits STATE
- City
- — inherits STATE
ZIP-level market 11933
- Home prices YoY
- 0.8%
- Active inventory
- 84
- Price-to-rent
- 2.9×
Monthly cashflow live
- Estimated rent
- $3,786 medium interval (Pro) →
- Mortgage (P&I)
- −$681
- Tax est. 1.5%
- −$162 /mo · $1,948/yr
- Insurance
- −$54
- Flood insurance flood zone
- −$56 /mo · $666/yr
- HOA
- −$1,143
- Vacancy / Maint / Mgmt
- −$795
- Net cashflow
- $895
Break-even live
UW: 25.0% down · 7.5% · 30yr · 1.5% tax · 5.0% vac · 8.0% maint · 8.0% mgmt
Financing live
Cash to close
- Down payment
- $32,475
- Closing costs
- $3,897
- Reserves months
- —
- Total cash needed
- —
Loan-product check · same deal, 3 products live
Conventional
25% down · 7.5% · 30yr
- Down + closing
- —
- Monthly P&I
- —
- Monthly cashflow
- —
- DSCR
- —
- Eligible?
- —
Personal DTI + credit; lowest rate.
DSCR
20% down · 8.5% · 30yr
- Down + closing
- —
- Monthly P&I
- —
- Monthly cashflow
- —
- DSCR
- —
- Eligible?
- —
No personal income docs; deal must DSCR.
Hard money
10% down · 12.0% · 12mo
- Down + closing
- —
- Monthly P&I
- —
- Monthly cashflow
- —
- DSCR
- —
- Eligible?
- —
Short-term bridge; refi at stabilization.
HOA detail
- Monthly dues
- $1,143 · $13,716/yr
- Likely covers
- water
Listing history 22 events
-
2026-06-18days on market $129,900 Active 120 DOM
-
2026-06-17days on market $129,900 Active 119 DOM
-
2026-06-16days on market $129,900 Active 118 DOM
-
2026-06-15days on market $129,900 Active 117 DOM
-
2026-06-13days on market $129,900 Active 115 DOM
-
2026-06-09days on market $129,900 Active 111 DOM
-
2026-06-08days on market $129,900 Active 110 DOM
-
2026-06-07days on market $129,900 Active 109 DOM
-
2026-06-04days on market $129,900 Active 106 DOM
-
2026-06-03days on market $129,900 Active 105 DOM
-
2026-06-02days on market $129,900 Active 104 DOM
-
2026-06-01days on market $129,900 Active 103 DOM
-
2026-05-31days on market $129,900 Active 102 DOM
-
2026-02-18$129,900 Active 264-char remark
Show marketing remark (264 chars)
55+ Community- park approval is required. 2/3 Bedrooms or office or extra den, Full Bath, Large Living Room, Open Kitchen , Foyer, Vaulted Master - light & bright, Very clean & neat. New Floors, Fresh Paint, New water heating system, Just move right in !
-
2025-10-01historical
-
2025-05-05price $132,500
-
2025-04-03price $145,000
-
2025-03-19$150,000 Active
-
2023-01-14soldstatus $115,000 Closed
-
2022-12-04status Pending
-
2022-11-07$115,000 Active
-
2022-11-05historical $115,000
ⓘ Source: listings_history table (triggers on properties + properties_extension) + one-shot
backfill from property_details.listing_events for pre-trigger history.
Climate risk First Street
- Flood 7/10 Severe FEMA zone X (unshaded) · 78% chance over 30 yrs
- Wildfire 3/10 Moderate
- Heat 4/10 Moderate 7 d/yr ≥93°F today · 18 d/yr by 30 yrs out
- Wind 8/10 Severe 80% chance of damaging wind over 30 yrs
- Air quality 3/10 Moderate 2 unhealthy d/yr today · 3 by 30 yrs out
Nearby sold comps map
Loading sold comps map…
Walkable amenities ~0.75 mi
Loading nearby amenities…
Taxation est. · year 1
- Rental income
- $45,438
- − Mortgage interest
- −$7,276
- − Property taxes
- −$1,948
- − Insurance
- −$1,316
- − Repairs & maintenance
- −$3,635
- − Management
- −$3,635
- − HOA
- −$13,716
- − Depreciation
- −$3,779
- Taxable income
- $10,132
- Est. tax owed @ 24.0%
- −$2,432
- After-tax cash flow
- $8,309/yr
For passive investors: Depreciation is non-cash, so a rental often shows a tax loss while cash-flowing — sheltering income. Rental losses are passive: they offset passive income freely, and up to $25,000/yr can offset ordinary (W-2) income if you actively participate and your MAGI is under $100k (phasing out to $0 by $150k); unused losses carry forward. On sale, claimed depreciation is recaptured at up to 25%, and gains may owe capital-gains tax (a 1031 exchange can defer both). Figures are a year-1 estimate at your 24.0% rate — not tax advice; consult a CPA.
Schools (NCES district)
- District
- Riverhead Central School District
- NCES district ID
- 3624690
- Math proficiency
- 34% ▼ -4.00%
- Reading proficiency
- 48% ▲ 13.00%
- Median HH income
- $61,607
- Composite
- 36.38/100
- National rank
- #4683
- State rank
- #489 of 590 in NY
Livability — Calverton
- Score
- 58/100
- State rank
- #1053
- US rank
- #20908
Category grades
Schools grade is shown separately in the Schools card above.
Census & demographics
- Census place
- Calverton, NY
- City population
- 6,784
- Population (ZIP)
- 6,784
Population outlook (Suffolk County) Hauer SSP2
- Today (2025)
- 1,505,262 people
- By 2030
- 1,498,318 · -0.5%
- By 2040
- 1,471,101 · -2.3%
- By 2050
- 1,424,848 · -5.3%
- By 2075
- 1,337,157 · -11.2%
- By 2100
- 1,217,720 · -19.1%
Race, ethnicity, and origin ACS 2023
- Neighborhood character
- Predominantly White (79%)
- Race & ethnicity
- White 79% Hispanic / Latino 10% Black 8% Two or more races 2% Asian 1%
- Hispanic origin (detail)
- Puerto Rican 1% Dominican 4%
- Common ancestry
- Romanian 5% Lithuanian 3% Iranian 1%
- Foreign-born
- 11% · Canada, Jamaica, South Korea
- Languages at home
- 85% English-only · Spanish 10% Other Indo-European 3% German/W. Germanic 1%
Political lean MEDSL · Suffolk
- 2024 margin
- Lean R (+10.0) · D 45.0% · R 55.0%
- 2008→2024 swing
- -16.0pp toward R · 2008: 6.0pp · 2024: -10.0pp
- All cycles
- 2024: R+10.0 2020: R+0.0 2016: R+8.2 2012: D+2.9 2008: D+6.0
Not yet ingested
- Civics
- —
Market trends
- HPI YoY
- ▲ 3.26%
- Current HPI
- 397.7148
- Rent YoY
- —
- Metro
- —
- State GDP YoY
- ▲ 2.60%
- F500 in state
- 92
Industry mix (Fortune 500 HQ in NY)
| Industry | F500 HQs | Revenue |
|---|---|---|
| Financial Services | 10 | $950B |
|
||
| Consumer Goods | 9 | $162B |
|
||
| Insurance | 4 | $225B |
|
||
| Telecommunications | 2 | $144B |
|
||
| Pharmaceuticals | 2 | $112B |
|
||
| Media / Entertainment | 2 | $69B |
|
||
Price history
+13.0% since first listed9 events — show timeline
- 2026-02-18 Listed $129,900 OneKey® MLS as Distributed by MLS Grid
- 2025-10-01 Listing Removed — OneKey® MLS as Distributed by MLS Grid
- 2025-05-05 Price Changed $132,500 OneKey® MLS as Distributed by MLS Grid
- 2025-04-03 Price Changed $145,000 OneKey® MLS as Distributed by MLS Grid
- 2025-03-19 Listed $150,000 OneKey® MLS as Distributed by MLS Grid
- 2023-01-14 Sold (MLS) $115,000 OneKey® MLS as Distributed by MLS Grid
- 2022-12-04 Pending — OneKey® MLS as Distributed by MLS Grid
- 2022-11-07 Listed $115,000 OneKey® MLS as Distributed by MLS Grid
- 2022-11-05 Coming Soon $115,000 OneKey® MLS as Distributed by MLS Grid
Cash-flow waterfall
monthlySold comps — $/sqft
last 12 mo · ≤1 miLoading sold comps…