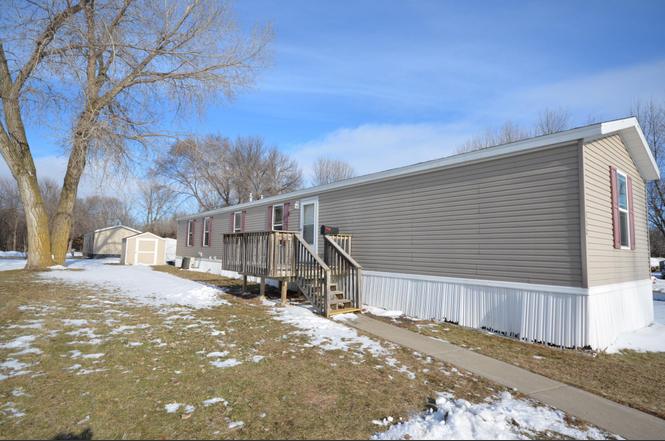
112 Saint Ann St · Mankato, MN
Flood risk 1/10 · Minimal
- FEMA flood zone
- —
- Chance of flooding over 30 yrs
- 0.0%
- Est. flood insurance / yr
- —
Fire risk 3/10 · Minor
- Est. fire insurance / yr
- $888 – $1,650
Heat risk 2/10 · Minimal
- Hot days now (above 99°F)
- 7 days/yr
- Hot days in 30 yrs
- 15 days/yr
Wind risk 2/10 · Minimal
- Chance of severe wind over 30 yrs
- —
Air-quality risk 1/10 · Minimal
- Unhealthy air days now
- 0 days/yr
- Unhealthy air days in 30 yrs
- 0 days/yr
Risk factors via First Street. Map © Google.
Why this score? — see what drove the B grade
The composite is a weighted blend of 9 inputs, each scored 0–100. Each bar is that input's sub-score; the figure is the points it added to the 100-point composite (weight × sub-score).
- Cash flow +30.0/30.0
- 1% rule +10.0/10.0
- DSCR +10.0/10.0
- ARV discount +7.5/15.0
- Rent growth +4.6/5.0
- Schools +4.4/10.0
- Livability +3.9/5.0
- Condition / age +2.5/5.0
- Appreciation +0.0/10.0
$57,000
🖨 Deal sheet 📄 Offer letter ✓ Due diligence
Listing remarks
Well-maintained 3 bedroom, 2 bathroom mobile home offering a comfortable and functional layout. This home features a spacious living area and an open kitchen with ample cabinet space. The primary bedroom includes a private en-suite bathroom, while two additional bedrooms provide flexibility for family, guests, or a home office. A dedicated laundry area, generous storage throughout, and a convenient storage shed outside. Affordable living with room to make it your own—ideal for first-time buyers, downsizers, or more affordable living.
Key facts
- Built 2014
- Listed 95 days
Neighborhood map
What this means for you Summary
Snapshot
- This is a 3-bed/2.0-bath other listed at $57k.
Deal economics
- At list price, monthly cash flow is $898 ($11k/yr) — positive.
- The deal already cash-flows at list — no discount required.
- Meets the 1% rule at list price ($2k rent vs $57k).
- Recommended offer: $52k (9.0% below list) — sets the bar for market timing.
- Cap rate 25.2% vs local median 3.4% in Mankato — top-decile yield for the area; either an underpriced asset or a hidden risk that comps aren't pricing in. Stress-test before assuming the spread holds.
Location & tenants
- Location reads 77/100 on livability (#133 in MN, #2,970 nationally) — a middle-class / working-renter tenant base. Strengths: housing A+, health & safety A+, cost of living A; Watch: crime C-, amenities C-, commute F.
- Mankato Public School District (urban): math 48% / reading 56% proficiency, ranked #98 of 301 in MN (top 33%) — acceptable for families but not a draw, mixed tenant base, ~2y average lease.
- Market conditions: Rents rising fast (+8.6%/yr); 352 active listings in the ZIP; 7 comparable units currently listed for rent nearby; rentals lingering (median 44d on market — plan ~5-8 weeks vacancy on turnover, expect pricing pressure); 100% of comp listings sitting > 30 days — soft ceiling on asking rent; 269 units permitted in Blue Earth County in 2024 (154 in 5+ unit buildings).
Forward outlook
- Local home prices are declining (-3.0%/yr); year-one equity from $394 of loan paydown is wiped out by about $2k of value loss. Plan a longer hold.
- Blue Earth County population projected at +18% by 2050 — long-run rental-demand tailwind backs the buy-and-hold thesis.
- At projected returns (-3.0% appreciation + 8.0% rent growth), your $16k cash investment doubles in ~2 years — after that, you're playing with house money.
Negotiation context
- It's been on market 95 days — a 9% lower offer ($52k) is reasonable based on typical stale-listing flexibility.
Questions for the listing agent
- It's been on market 95 days. Have you received any prior offers? Is the seller open to a 9% concession, seller financing, or rate buy-down credit?
- Why hasn't it sold? Are there any deal-killer items the seller is aware of (foundation, flood, title, zoning, code violations)?
- Is there a deadline driving the sale (1031 exchange, divorce, estate, relocation)? That informs how much negotiation room exists.
- Schools are B-rated — typically a magnet for longer-tenancy family renters. What's the average tenant stay here, and is there a school-zone premium baked into asking?
- What's the average days-on-market for RENTAL listings here right now (not sales)? A rising rental-DOM trend means longer vacancies and softer asking-rent achievability than the comps imply.
- What's the recent tenant-quality profile in this submarket — average credit score on applications, eviction rate, late-payment / NSF rate, and stable-employment percentage? A property-management company in the area should have these aggregated.
- How much new for-sale + rental construction is in the pipeline within 1–3 miles? Heavy new supply typically softens prices + rents 12–24 months out; constrained supply supports both.
Investment metrics
- 1% rule
- 2.76% ✓
- Cap rate
- 25.19%
- Cash-on-cash
- 67.50%
- DSCR
- 4.00
- GRM
- 3.0
CMA / ARV
No comps found within radius.
Projected returns pro-forma
-3.0% appreciation · 8.0% rent growth · sell at horizon
- IRR
- 72.2%
- Equity multiple
- 4.52×
- Total profit
- $56,253
- Equity at exit
- $8,499
- IRR
- 77.5%
- Equity multiple
- 11.05×
- Total profit
- $160,449
- Equity at exit
- $4,928
Cash invested: $15,960 (down + closing). Projections, not guarantees.
Landlord ↔ Tenant lean methodology
- Overall (STATE)
- 46 Balanced
- State Minnesota
- 46 Balanced · D+2
- County
- — inherits STATE
- City
- — inherits STATE
ZIP-level market 56001
- Rents YoY
- 8.6%
- Active inventory
- 352
- Price-to-rent
- 3.0×
Monthly cashflow live
- Estimated rent
- $1,574 high interval (Pro) →
- Mortgage (P&I)
- −$299
- Tax from tax record
- −$23 /mo · $280/yr
- Insurance
- −$24
- HOA
- −$0
- Vacancy / Maint / Mgmt
- −$331
- Net cashflow
- $898
Break-even live
UW: 25.0% down · 7.5% · 30yr · 1.5% tax · 5.0% vac · 8.0% maint · 8.0% mgmt
Financing live
Cash to close
- Down payment
- $14,250
- Closing costs
- $1,710
- Reserves months
- —
- Total cash needed
- —
Loan-product check · same deal, 3 products live
Conventional
25% down · 7.5% · 30yr
- Down + closing
- —
- Monthly P&I
- —
- Monthly cashflow
- —
- DSCR
- —
- Eligible?
- —
Personal DTI + credit; lowest rate.
DSCR
20% down · 8.5% · 30yr
- Down + closing
- —
- Monthly P&I
- —
- Monthly cashflow
- —
- DSCR
- —
- Eligible?
- —
No personal income docs; deal must DSCR.
Hard money
10% down · 12.0% · 12mo
- Down + closing
- —
- Monthly P&I
- —
- Monthly cashflow
- —
- DSCR
- —
- Eligible?
- —
Short-term bridge; refi at stabilization.
Rent comps 7 comps
| Address | Beds | Baths | Sqft | Rent | $/sqft | DOM | Units | Dist |
|---|---|---|---|---|---|---|---|---|
| 875 Heron Dr Mankato, MN | 2.0 | 1.0 | 919 | $1,098 | $1.19 | 43d | 1 | 0.26mi |
| 140 Homestead Rd Mankato, MN | 1.0–3.0 | 1.0 | 843 | $1,313 | $1.56 | 43d | 8 | 0.69mi |
| 103 Everglades Trl Mankato, MN | 2.0–4.0 | 2.5 | 1453 | $1,860 | $1.28 | 43d | 3 | 0.74mi |
| 109 Willow Cascades Trl Unit 109 WCT Mankato, MN | 3.0 | 2.5 | 1500 | $1,850 | $1.23 | 43d | 1 | 0.76mi |
| 200 Briargate Rd Mankato, MN | 1.0–3.0 | 1.0–3.0 | 912 | $1,799 | $1.97 | 43d | 32 | 0.84mi |
| 701 S Victory Dr Unit 8 Mankato, MN | 2.0 | 1.0 | 925 | $1,349 | $1.46 | 43d | 1 | 1.07mi |
| 50 Hilltop Ln Mankato, MN | 1.0–2.0 | 1.0 | 760 | $1,010 | $1.33 | 43d | 11 | 1.21mi |
Listing history 3 events
-
2026-04-23status Pending
-
2026-04-12historical Contingent - Inspection
-
2026-01-06$57,000 Active
ⓘ Source: listings_history table (triggers on properties + properties_extension) + one-shot
backfill from property_details.listing_events for pre-trigger history.
Tax reassessment forecast MN · Partial reset (capped growth)
- Current annual tax
- $280 · $23/mo
- Projected year-2 tax
- $459 · $38/mo
- Expected delta
- +$179/yr (+$15/mo · 64.0%)
ⓘ Screening estimate from a state-policy table — verify with the county assessor before closing.
Climate risk First Street
- Flood 1/10 Low 0% chance over 30 yrs
- Wildfire 3/10 Moderate
- Heat 2/10 Low 7 d/yr ≥99°F today · 15 d/yr by 30 yrs out
- Wind 2/10 Low
- Air quality 1/10 Low 0 unhealthy d/yr today · 0 by 30 yrs out
Nearby sold comps map
Loading sold comps map…
Walkable amenities ~0.75 mi
Loading nearby amenities…
Taxation est. · year 1
- Rental income
- $18,892
- − Mortgage interest
- −$3,193
- − Property taxes
- −$280
- − Insurance
- −$285
- − Repairs & maintenance
- −$1,511
- − Management
- −$1,511
- − Depreciation
- −$1,658
- Taxable income
- $10,453
- Est. tax owed @ 24.0%
- −$2,509
- After-tax cash flow
- $8,264/yr
For passive investors: Depreciation is non-cash, so a rental often shows a tax loss while cash-flowing — sheltering income. Rental losses are passive: they offset passive income freely, and up to $25,000/yr can offset ordinary (W-2) income if you actively participate and your MAGI is under $100k (phasing out to $0 by $150k); unused losses carry forward. On sale, claimed depreciation is recaptured at up to 25%, and gains may owe capital-gains tax (a 1031 exchange can defer both). Figures are a year-1 estimate at your 24.0% rate — not tax advice; consult a CPA.
Schools (NCES district)
- District
- Mankato Public School District
- NCES district ID
- 2718780
- Math proficiency
- 48% ▼ -11.00%
- Reading proficiency
- 56% ▼ -8.00%
- Median HH income
- $49,469
- Composite
- 44.36/100
- National rank
- #2819
- State rank
- #98 of 301 in MN
Livability — Mankato
- Score
- 77/100
- State rank
- #133
- US rank
- #2970
Category grades
Schools grade is shown separately in the Schools card above.
Census & demographics
- Census place
- Mankato, MN
- County
- Blue Earth County · 51,585 people
- City population
- 51,585
- Metro
- Mankato, MN
- Population (ZIP)
- 51,585
- Household income
- $69,531
- Rent vs Own
- Severe rent burden
- 2394.0
Population outlook (Blue Earth County) Hauer SSP2
- Today (2025)
- 70,208 people
- By 2030
- 72,708 · +3.6%
- By 2040
- 77,481 · +10.4%
- By 2050
- 82,842 · +18.0%
- By 2075
- 99,990 · +42.4%
- By 2100
- 116,795 · +66.4%
Race, ethnicity, and origin ACS 2023
- Neighborhood character
- Predominantly White (83%)
- Race & ethnicity
- White 83% Black 6% Hispanic / Latino 5% Two or more races 4% Asian 3%
- Common ancestry
- Portuguese 11% Lithuanian 3% Romanian 3%
- Foreign-born
- 8% · Canada, Vietnam, South Korea
- Languages at home
- 90% English-only · Spanish 3% Other Indo-European 1% Vietnamese 1%
Political lean MEDSL · Blue Earth
- 2024 margin
- Toss-up / Even · D 48.3% · R 49.5% · Other 2.1%
- 2008→2024 swing
- -14.2pp toward R · 2008: 12.9pp · 2024: -1.2pp
- All cycles
- 2024: R+1.2 2020: D+4.4 2016: R+3.7 2012: D+9.5 2008: D+12.9
Not yet ingested
- Civics
- —
Market trends
- HPI YoY
- ▼ -192.46%
- Current HPI
- 189.8485
- Rent YoY
- ▲ 8.55%
- Metro
- Mankato, MN
- State GDP YoY
- ▲ 2.41%
- F500 in state
- 34
Industry mix (Fortune 500 HQ in MN)
| Industry | F500 HQs | Revenue |
|---|---|---|
| Healthcare | 2 | $407B |
|
||
| Retail | 2 | $150B |
|
||
| Consumer Goods | 2 | $32B |
|
||
| Industrial Machinery | 2 | $6B |
|
||
| Agriculture | 1 | $40B |
|
||
| Healthcare / Medical Devices | 1 | $32B |
|
||
Price history
3 events — show timeline
- 2026-04-23 Pending — NORTHSTARMLS as Distributed by MLS Grid
- 2026-04-12 Contingent — NORTHSTARMLS as Distributed by MLS Grid
- 2026-01-06 Listed $57,000 NORTHSTARMLS as Distributed by MLS Grid
Cash-flow waterfall
monthlySold comps — $/sqft
last 12 mo · ≤1 miLoading sold comps…