2107 3rd St E · Tuscaloosa, AL
Flood risk 8/10 · Major
- FEMA flood zone
- X (unshaded)
- Chance of flooding over 30 yrs
- 0.78%
- Est. flood insurance / yr
- $507 – $1,088
Fire risk 3/10 · Minor
- Est. fire insurance / yr
- $916 – $1,700
Heat risk 7/10 · Major
- Hot days now (above 108°F)
- 7 days/yr
- Hot days in 30 yrs
- 18 days/yr
Wind risk 6/10 · Moderate
- Chance of severe wind over 30 yrs
- 60.0%
Air-quality risk 3/10 · Minor
- Unhealthy air days now
- 2 days/yr
- Unhealthy air days in 30 yrs
- 3 days/yr
Risk factors via First Street. Map © Google.
Why this score? — see what drove the B grade
The composite is a weighted blend of 9 inputs, each scored 0–100. Each bar is that input's sub-score; the figure is the points it added to the 100-point composite (weight × sub-score).
- Cash flow +30.0/30.0
- 1% rule +10.0/10.0
- DSCR +10.0/10.0
- ARV discount +7.5/15.0
- Rent growth +4.2/5.0
- Livability +3.9/5.0
- Schools +2.5/10.0
- Condition / age +2.5/5.0
- Appreciation +0.0/10.0
$69,000
🖨 Deal sheet 📄 Offer letter ✓ Due diligence
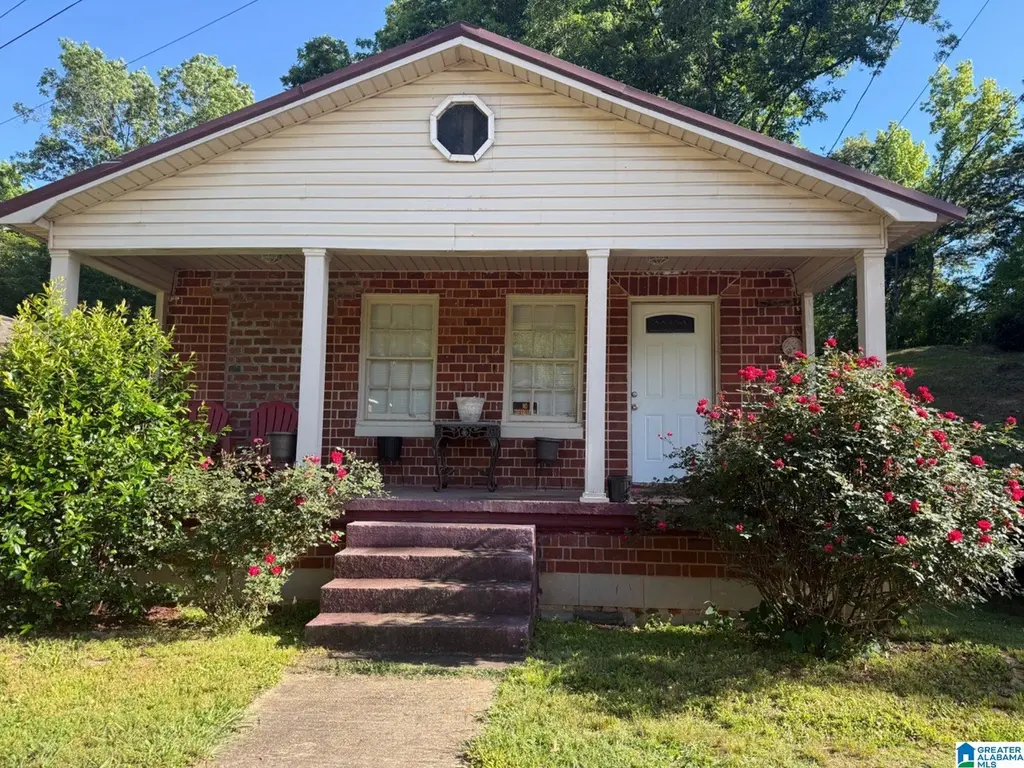
Listing remarks
Cute brick home in Tuscaloosa featuring 3 bedrooms plus a bonus room that could serve as a 4th bedroom, office, or playroom! Enjoy relaxing on the spacious front porch and entertaining in the fenced backyard. This charming home offers great flexibility and plenty of outdoor space in a convenient location.
Key facts
- Bonus room
- Brick home
- Spacious front porch
Tags
Property features AI
Finance
- Other: Property sits on approximately 0.17 acres; Fire, garbage and library fees are included
Exterior
- Parking: Driveway parking
- Utilities: Public water; Connected sewer; Electric water heater; Underground utilities; Internet service available
- Home design: Single-story living areas (main level rooms listed); Four-sided brick construction; Crawl-space foundation; Existing/previously built (no new construction indication)
- Construction: 4-side brick exterior; Crawl space foundation
- Exterior features: Open patio; Porch
Interior
- Kitchen: Laminate countertops; Electric stove
- Bedrooms: Three bedrooms on the main level (approx. 12'1" x 13'1", 12'4" x 11'5", 12'5" x 11'2"); Bonus room on the main level (approx. 12'3" x 11'5")
- Flooring: Vinyl flooring
- Bathrooms: One full bathroom with separate shower (approx. 7'1" x 6')
- Heating & cooling: Electric heating; Central electric cooling
- Interior features: Smooth ceilings; No additional interior features listed
- Laundry & utility: Main-level laundry with washer hookup and electric dryer hookup; Pull-down attic access
Neighborhood map
What this means for you Summary
Snapshot
- This is a 3-bed/1.0-bath single-family listed at $69k.
Deal economics
- At list price, monthly cash flow is $948 ($11k/yr) — positive.
- The deal already cash-flows at list — no discount required.
- Meets the 1% rule at list price ($2k rent vs $69k).
- Recommended offer: $68k (1.5% below list) — sets the bar for market timing.
- Cap rate 23.9% vs local median 3.4% in Tuscaloosa — top-decile yield for the area; either an underpriced asset or a hidden risk that comps aren't pricing in. Stress-test before assuming the spread holds.
Location & tenants
- Location reads 77/100 on livability (#9 in AL, #2,909 nationally) — a middle-class / working-renter tenant base. Strengths: amenities A+, health & safety A+, cost of living A; Watch: crime F, employment D-.
- Tuscaloosa City (urban): math 19% / reading 40% proficiency, ranked #74 of 129 in AL (top 57%) — low school quality limits family demand, transient renter base, plan for 1-2y turnover.
- Zoned schools: The Alberta School of Performing Arts (math 10% / reading 37%, grade F, #429 of 627 statewide, top 69%, 671 students, 82% FRL); Northridge High School (math 40% / reading 42%, grade F, #31 of 305 statewide, top 10%, 1,145 students, 35% FRL) — zoned schools at 58% FRL track the district average.
- Market conditions: Rents rising fast (+6.8%/yr); 167 active listings in the ZIP; 19 comparable units currently listed for rent nearby; rentals lingering (median 44d on market — plan ~5-8 weeks vacancy on turnover, expect pricing pressure); 58% of comp listings sitting > 30 days — soft ceiling on asking rent; 622 units permitted in Tuscaloosa County in 2024 (69 in 5+ unit buildings).
- This rent runs 44% of the median local income ($49k/yr) — at the standard rent-burdened threshold; future hikes will face affordability resistance.
Forward outlook
- Local home prices are declining (-3.0%/yr); year-one equity from $477 of loan paydown is wiped out by about $2k of value loss. Plan a longer hold.
- Tuscaloosa County population projected at +26% by 2050 — long-run rental-demand tailwind backs the buy-and-hold thesis.
- At projected returns (-3.0% appreciation + 6.8% rent growth), your $19k cash investment doubles in ~2 years — after that, you're playing with house money.
Negotiation context
- It's been on market 20 days — a 2% lower offer ($68k) is reasonable based on typical stale-listing flexibility.
- Current owner paid $15k; list at $69k implies a 360% gain — meaningful room to come down on a strong offer.
Risks & watch-outs
- Watch-outs: flood insurance adds $66/mo; built in 1945 — expect roof / HVAC / electrical / plumbing capex.
- Climate carrying-cost: severe flood risk; major wind risk, 60% chance of damaging wind over 30y; extreme-heat days projected 7→18/yr by 2055 (HVAC capex compounding) — expect insurance premiums to compound above CPI over the hold.
Questions for the listing agent
- Built in 1945 — when were the roof, HVAC, electrical panel, plumbing, and water heater last replaced?
- What's the actual annual flood-insurance premium (NFIP or private), and is the property in a SFHA with mandatory coverage?
- Is there a deadline driving the sale (1031 exchange, divorce, estate, relocation)? That informs how much negotiation room exists.
- Crime grade is F in this area — have there been break-ins, vandalism, or insurance claims at this property in the last 3 years? What carrier currently insures it and at what premium?
- What's the average days-on-market for RENTAL listings here right now (not sales)? A rising rental-DOM trend means longer vacancies and softer asking-rent achievability than the comps imply.
- What's the recent tenant-quality profile in this submarket — average credit score on applications, eviction rate, late-payment / NSF rate, and stable-employment percentage? A property-management company in the area should have these aggregated.
- How much new for-sale + rental construction is in the pipeline within 1–3 miles? Heavy new supply typically softens prices + rents 12–24 months out; constrained supply supports both.
Investment metrics
- 1% rule
- 2.61% ✓
- Cap rate
- 23.93%
- Cash-on-cash
- 62.98%
- DSCR
- 3.80
- GRM
- 3.2
CMA / ARV
- ARV (on-the-fly)
- $164,304
- Comps found
- 12
Show comp detail 12 sales within ~0.75 mi
| Address | Dist | Beds/Ba | Sqft | Sold | Price | $/sf | Match |
|---|---|---|---|---|---|---|---|
| 2012 6th St E | 0.20mi | 3/1.0 | 1,032 (+2%) | 1mo | $199,900 | $194 | 86 |
| 129 20th Ave E | 0.16mi | 3/1.0 | 950 (-6%) | 14mo | $155,000 | $163 | 71 |
| 2433 4th St E | 0.29mi | 3/1.5 | 1,016 (+1%) | 21mo | $100,000 | $98 | 66 |
| 2131 5th St E | 0.18mi | 3/2.0 | 1,150 (+14%) | 1mo | $219,900 | $191 | 64 |
| 307 Short 24th Ave E | 0.25mi | 3/2.0 | 1,145 (+14%) | 5mo | $185,000 | $162 | 58 |
| 108 22nd Ave NE | 0.29mi | 3/2.0 | 1,150 (+14%) | 3mo | $209,900 | $183 | 57 |
| 2624 3rd St E | 0.43mi | 3/2.0 | 1,092 (+8%) | 8mo | $165,000 | $151 | 56 |
| 413 26th Ave E | 0.44mi | 3/2.0 | 1,120 (+11%) | 6mo | $110,000 | $98 | 52 |
| 2320 10th St E | 0.62mi | 2/2.0 (-1) | 987 (-2%) | 9mo | $182,000 | $184 | 51 |
| 426 25th Ave E | 0.35mi | 3/1.0 | 896 (-11%) | 22mo | $88,000 | $98 | 47 |
| 1119 23rd Ave Ave E | 0.74mi | 3/2.0 | 1,056 (+5%) | 11mo | $195,000 | $185 | 45 |
| 601 30th Ave E | 0.72mi | 3/1.0 | 1,088 (+8%) | 17mo | $110,000 | $101 | 40 |
Match score weights: distance 35% · size 25% · config 20% · recency 20%. Top-matched comps best support the ARV.
Projected returns pro-forma
-3.0% appreciation · 6.81% rent growth · sell at horizon
- IRR
- 61.8%
- Equity multiple
- 3.92×
- Total profit
- $56,368
- Equity at exit
- $10,288
- IRR
- 67.6%
- Equity multiple
- 9.22×
- Total profit
- $158,743
- Equity at exit
- $5,966
Cash invested: $19,320 (down + closing). Projections, not guarantees.
Landlord ↔ Tenant lean methodology
- Overall (STATE)
- 90 Strongly Landlord-Friendly
- State Alabama
- 90 Strongly Landlord-Friendly · R+15
- County
- — inherits STATE
- City
- — inherits STATE
ZIP-level market 35404
- Rents YoY
- 6.8%
- Active inventory
- 167
- Price-to-rent
- 3.2×
Monthly cashflow live
- Estimated rent
- $1,802 high interval (Pro) →
- Mortgage (P&I)
- −$362
- Tax from tax record
- −$19 /mo · $231/yr
- Insurance
- −$29
- Flood insurance flood zone
- −$66 /mo · $798/yr
- HOA
- −$0
- Vacancy / Maint / Mgmt
- −$378
- Net cashflow
- $948
Break-even live
UW: 25.0% down · 7.5% · 30yr · 1.5% tax · 5.0% vac · 8.0% maint · 8.0% mgmt
Financing live
Cash to close
- Down payment
- $17,250
- Closing costs
- $2,070
- Reserves months
- —
- Total cash needed
- —
Loan-product check · same deal, 3 products live
Conventional
25% down · 7.5% · 30yr
- Down + closing
- —
- Monthly P&I
- —
- Monthly cashflow
- —
- DSCR
- —
- Eligible?
- —
Personal DTI + credit; lowest rate.
DSCR
20% down · 8.5% · 30yr
- Down + closing
- —
- Monthly P&I
- —
- Monthly cashflow
- —
- DSCR
- —
- Eligible?
- —
No personal income docs; deal must DSCR.
Hard money
10% down · 12.0% · 12mo
- Down + closing
- —
- Monthly P&I
- —
- Monthly cashflow
- —
- DSCR
- —
- Eligible?
- —
Short-term bridge; refi at stabilization.
Rent comps 19 comps
| Address | Beds | Baths | Sqft | Rent | $/sqft | DOM | Units | Dist |
|---|---|---|---|---|---|---|---|---|
| 922 23rd Ave E Tuscaloosa, AL | 1.0–2.0 | 1.0–2.0 | 1092 | $2,300 | $2.11 | 13d | 4 | 0.53mi |
| 927 Kicker Rd Tuscaloosa, AL | 3.0 | 3.0 | 1412 | $3,075 | $2.18 | 21d | 2 | 0.55mi |
| 936 22nd Ave E Tuscaloosa, AL | 1.0–2.0 | 1.0–2.0 | 906 | $2,000 | $2.21 | 13d | 4 | 0.56mi |
| 933 21st Ave E Tuscaloosa, AL | 1.0–2.0 | 1.0–2.0 | 906 | $2,150 | $2.37 | 44d | 2 | 0.56mi |
| 1010 23rd Ave E Tuscaloosa, AL | 3.0 | 2.0 | 1251 | $1,500 | $1.20 | 44d | 1 | 0.64mi |
| 419 30th Ave E Tuscaloosa, AL | 1.0–2.0 | 1.0–2.0 | 852 | $2,200 | $2.58 | 13d | 7 | 0.68mi |
| 419 30th Ave E Tuscaloosa, AL | 1.0–2.0 | 1.0–2.0 | 852 | $2,400 | $2.82 | 44d | 5 | 0.68mi |
| 30 Beverly Hts Tuscaloosa, AL | 3.0 | 2.0 | 1100 | $2,100 | $1.91 | 13d | 1 | 0.79mi |
| 1722 13th St E Tuscaloosa, AL | 3.0 | 1.0 | 1200 | $1,100 | $0.92 | 44d | 1 | 0.85mi |
| 1305 12th St E Tuscaloosa, AL | 4.0 | 2.0 | 1377 | $1,615 | $1.17 | 21d | 1 | 0.94mi |
| 1515 Kicker Rd Tuscaloosa, AL | 1.0–2.0 | 1.0–2.0 | 1050 | $1,025 | $0.98 | 44d | 1 | 1.11mi |
| 2501 Veterans Memorial Pkwy Tuscaloosa, AL | 2.0 | 2.0 | 1018 | $875 | $0.86 | 44d | 1 | 1.12mi |
| 2501 Veterans Memorial Pkwy Tuscaloosa, AL | 2.0 | 2.0 | 1078 | $975 | $0.90 | 13d | 1 | 1.12mi |
| 622 4th St NE Unit Highland 4 Tuscaloosa, AL | 2.0 | 2.0 | 1150 | $1,080 | $0.94 | 44d | 1 | 1.18mi |
| 3550 Crescent Gardens Dr Tuscaloosa, AL | 3.0 | 2.0 | 1116 | $1,575 | $1.41 | 44d | 1 | 1.20mi |
| 680 6th Ave NE #3401 Tuscaloosa, AL | 3.0 | 3.0 | 1266 | $2,300 | $1.82 | 44d | 1 | 1.31mi |
| 680 6th Ave NE Unit WC3407 A Tuscaloosa, AL | 3.0 | 3.0 | 1266 | $1,200 | $0.95 | 44d | 1 | 1.32mi |
| 931 Crescent Ridge Rd E Tuscaloosa, AL | 2.0 | 1.5 | 850 | $995 | $1.17 | 44d | 1 | 1.35mi |
| 3218 Veterans Memorial Pkwy Tuscaloosa, AL | 3.0 | 3.0–3.5 | 1484 | $1,950 | $1.31 | 21d | 1 | 1.36mi |
Listing history 18 events
-
2026-06-18days on market $69,000 Active 20 DOM
-
2026-06-17days on market $69,000 Active 19 DOM
-
2026-06-16days on market $69,000 Active 18 DOM
-
2026-06-15days on market $69,000 Active 17 DOM
-
2026-06-14days on market $69,000 Active 15 DOM
-
2026-06-13days on market $69,000 Active 14 DOM
-
2026-06-10days on market $69,000 Active 12 DOM
-
2026-06-09days on market $69,000 Active 11 DOM
-
2026-06-09price $69,000 Active 10 DOM
-
2026-06-08days on market $79,900 Active 10 DOM
-
2026-06-07days on market $79,900 Active 9 DOM
-
2026-06-05days on market $79,900 Active 6 DOM
-
2026-06-03days on market $79,900 Active 5 DOM
-
2026-06-02days on market $79,900 Active 4 DOM
-
2026-06-01days on market $79,900 Active 3 DOM
-
2026-05-31days on market $79,900 Active 2 DOM
-
2026-05-30remarks 306-char remark
-
2026-05-30$79,900 Active 1 DOM
ⓘ Source: listings_history table (triggers on properties + properties_extension) + one-shot
backfill from property_details.listing_events for pre-trigger history.
Tax reassessment forecast AL · Resets to sale price
- Current annual tax
- $231 · $19/mo
- Projected year-2 tax
- $283 · $24/mo
- Expected delta
- +$52/yr (+$4/mo · 22.4%)
ⓘ Screening estimate from a state-policy table — verify with the county assessor before closing.
Climate risk First Street
- Flood 8/10 Severe FEMA zone X (unshaded) · 78% chance over 30 yrs
- Wildfire 3/10 Moderate
- Heat 7/10 Severe 7 d/yr ≥108°F today · 18 d/yr by 30 yrs out
- Wind 6/10 Major 60% chance of damaging wind over 30 yrs
- Air quality 3/10 Moderate 2 unhealthy d/yr today · 3 by 30 yrs out
Nearby sold comps map
Loading sold comps map…
Walkable amenities ~0.75 mi
Loading nearby amenities…
Taxation est. · year 1
- Rental income
- $21,628
- − Mortgage interest
- −$3,865
- − Property taxes
- −$231
- − Insurance
- −$1,142
- − Repairs & maintenance
- −$1,730
- − Management
- −$1,730
- − Depreciation
- −$2,007
- Taxable income
- $10,921
- Est. tax owed @ 24.0%
- −$2,621
- After-tax cash flow
- $8,749/yr
For passive investors: Depreciation is non-cash, so a rental often shows a tax loss while cash-flowing — sheltering income. Rental losses are passive: they offset passive income freely, and up to $25,000/yr can offset ordinary (W-2) income if you actively participate and your MAGI is under $100k (phasing out to $0 by $150k); unused losses carry forward. On sale, claimed depreciation is recaptured at up to 25%, and gains may owe capital-gains tax (a 1031 exchange can defer both). Figures are a year-1 estimate at your 24.0% rate — not tax advice; consult a CPA.
Schools (NCES district)
- District
- Tuscaloosa City
- NCES district ID
- 0103360
- Math proficiency
- 19% ▼ -24.00%
- Reading proficiency
- 40% ▼ -1.00%
- Median HH income
- $37,474
- Composite
- 24.51/100
- National rank
- #7647
- State rank
- #74 of 129 in AL
Livability — Tuscaloosa
- Score
- 77/100
- State rank
- #9
- US rank
- #2909
Category grades
Schools grade is shown separately in the Schools card above.
Census & demographics
- Census place
- Tuscaloosa, AL
- County
- Tuscaloosa County · 206,491 people
- City population
- 134,228
- Metro
- Tuscaloosa, AL
- Population (ZIP)
- 22,445
- Household income
- $48,932
- Rent vs Own
- Severe rent burden
- 1531.0
Population outlook (Tuscaloosa County) Hauer SSP2
- Today (2025)
- 228,293 people
- By 2030
- 240,551 · +5.4%
- By 2040
- 263,856 · +15.6%
- By 2050
- 286,491 · +25.5%
- By 2075
- 335,783 · +47.1%
- By 2100
- 370,520 · +62.3%
Race, ethnicity, and origin ACS 2023
- Neighborhood character
- Diverse neighborhood (Simpson 0.59)
- Race & ethnicity
- Black 46% White 44% Hispanic / Latino 8% Two or more races 5% Asian 1%
- Hispanic origin (detail)
- Mexican 8%
- Common ancestry
- Italian 2% Slovak 1% Serbian 1%
- Foreign-born
- 6% · Canada, South Korea
- Languages at home
- 91% English-only · Spanish 7%
Political lean MEDSL · Tuscaloosa
- 2024 margin
- Strong R (+20.4) · D 39.4% · R 59.8%
- 2008→2024 swing
- -4.4pp toward R · 2008: -16.0pp · 2024: -20.4pp
- All cycles
- 2024: R+20.4 2020: R+14.8 2016: R+19.5 2012: R+17.4 2008: R+16.0
Not yet ingested
- Civics
- —
Market trends
- HPI YoY
- ▼ -103.00%
- Current HPI
- 170.026
- Rent YoY
- ▲ 6.81%
- Metro
- Tuscaloosa, AL
- State GDP YoY
- ▲ 2.94%
- F500 in state
- 4
Industry mix (Fortune 500 HQ in AL)
| Industry | F500 HQs | Revenue |
|---|---|---|
| Financial Services | 1 | $8B |
|
||
| Healthcare | 1 | $5B |
|
||
Price history
+432.7% since first listed2 events — show timeline
- 2026-05-26 Listed $79,900 Greater Alabama MLS
- 2010-08-23 Sold (Public Records) $15,000 Public Records
Property tax history
-5.5%/yrLatest (2025): $231 · +8.2% YoY. Source: county tax records.
Cash-flow waterfall
monthlySold comps — $/sqft
last 12 mo · ≤1 miLoading sold comps…