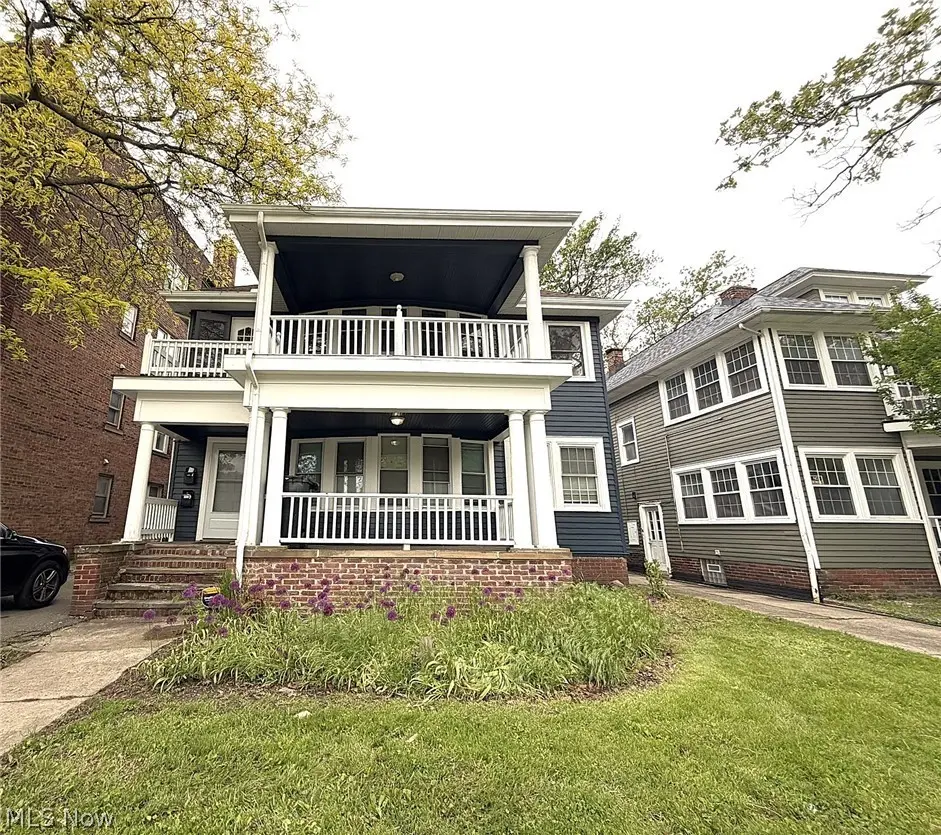
 Triplex
14172 Superior Rd · Cleveland Heights, OH
Flood risk 1/10 · Minimal
- FEMA flood zone
- X (unshaded)
- Chance of flooding over 30 yrs
- 0.0%
- Est. flood insurance / yr
- $507 – $1,088
Fire risk 1/10 · Minimal
- Est. fire insurance / yr
- $713 – $1,323
Heat risk 3/10 · Minor
- Hot days now (above 95°F)
- 7 days/yr
- Hot days in 30 yrs
- 17 days/yr
Wind risk 1/10 · Minimal
- Chance of severe wind over 30 yrs
- —
Air-quality risk 3/10 · Minor
- Unhealthy air days now
- 3 days/yr
- Unhealthy air days in 30 yrs
- 5 days/yr
Risk factors via First Street. Map © Google.
Why this score? — see what drove the D+ grade
The composite is a weighted blend of 9 inputs, each scored 0–100. Each bar is that input's sub-score; the figure is the points it added to the 100-point composite (weight × sub-score).
- Cash flow +20.7/30.0
- DSCR +6.6/10.0
- 1% rule +5.8/10.0
- Livability +4.5/5.0
- Rent growth +3.9/5.0
- Schools +2.8/10.0
- Condition / age +2.5/5.0
- ARV discount +0.0/15.0
- Appreciation +0.0/10.0
$349,000
🖨 Deal sheet 📄 Offer letter ✓ Due diligence
Multi-family units
County records classify this as Multi-Family (2-4 Unit). Listing-text estimate: 3 units. confirmed
Listing remarks MLS
Large 3 family home. Great investment opportunity. 2 of 3 units occupied. Sold as is. Subject to a short sale, buyer to assume any outstanding violations. 24hr notice for showings is required.
Key facts
- Ductwork
- New roof on garage
- Large parking lot
Tags
Property features AI
Finance
- Other: Single building property; Above-grade finished area approximately 3,615
- Financial info: Owner pays water and sewer
Exterior
- Parking: Detached garage; Driveway; Three garage spaces
- Utilities: Public water; Public sewer
- Home design: Three-story building
- Construction: Asphalt/fiberglass roof
- Exterior features: Partial fencing
Interior
- Kitchen: Range
- Bedrooms: One-bedroom unit on the 3rd floor; Three-bedroom unit on the 2nd floor; Three-bedroom unit on the 1st floor
- Bathrooms: Three full bathrooms (total for property); Each unit includes one bathroom
- Heating & cooling: Central air conditioning; Heating by baseboard and forced air (gas)
- Interior features: Full unfinished basement
- Laundry & utility: Washer hookup; Electric dryer hookup; Washer; Dryer
Neighborhood map
What this means for you Summary
Snapshot
- This is a 3 × 2-bed/1.0-bath units multifamily listed at $349k.
Deal economics
- At list price, monthly cash flow is $475 ($6k/yr) — positive. Per door: $158/mo.
- The deal already cash-flows at list — no discount required.
- Meets the 1% rule at list price ($4k rent vs $349k).
- Recommended offer: $339k (3.0% below list) — sets the bar for market timing.
- Cap rate 7.9% vs local median 4.4% in Cleveland Heights — top-decile yield for the area; either an underpriced asset or a hidden risk that comps aren't pricing in. Stress-test before assuming the spread holds.
Location & tenants
- Location reads 89/100 on livability (#12 in OH, #124 nationally) — a professional / high-income tenant draw. Strengths: amenities A+, commute A+, cost of living A+.
- Cleveland Heights-University Heights City (suburban): math 23% / reading 41% proficiency, ranked #568 of 656 in OH (top 87%) — families likely to look elsewhere, expect single-tenant / working-renter base with shorter leases; 64% free/reduced lunch — lower-income household profile, screen leases tightly.
- Market conditions: Rents rising fast (+5.7%/yr); 253 active listings in the ZIP; 2 comparable units currently listed for rent nearby; solid renter incomes; 1,441 units permitted in Cuyahoga County in 2024 (700 in 5+ unit buildings).
- At $3,779/mo this rent would consume 58% of the median local household income ($78k/yr) (locally 1847% of renters already pay >50% of income on rent) — very limited rent-growth headroom before tenants either downsize or default.
Forward outlook
- Local home prices are declining (-3.0%/yr); year-one equity from $2k of loan paydown is wiped out by about $10k of value loss. Plan a longer hold.
- Cuyahoga County population projected to shrink 8% by 2050 — rents likely to lag national; underwrite the cash flow, not the appreciation.
Negotiation context
- It's been on market 35 days — a 3% lower offer ($339k) is reasonable based on typical stale-listing flexibility.
- 10 sale attempts since 19y ago with the ask held roughly flat each time — persistent listings suggest the price (not the market) is what's stuck; bring a comps-based counter.
- Current owner paid $232k; list at $349k implies a 50% gain — meaningful room to come down on a strong offer.
Risks & watch-outs
- Watch-outs: built in 1930 — expect roof / HVAC / electrical / plumbing capex.
Questions for the listing agent
- It's been on market 35 days. Have you received any prior offers? Is the seller open to a 3% concession, seller financing, or rate buy-down credit?
- Can we see the unit-by-unit rent roll, current vacancy, and any below-market leases? What's the average tenancy length?
- What capital expenditures (roof, boiler, parking lot, exteriors) have been made in the last 5 years, and what's planned in the next 2?
- Built in 1930 — when were the roof, HVAC, electrical panel, plumbing, and water heater last replaced?
- Is there a deadline driving the sale (1031 exchange, divorce, estate, relocation)? That informs how much negotiation room exists.
- Schools are A-rated — typically a magnet for longer-tenancy family renters. What's the average tenant stay here, and is there a school-zone premium baked into asking?
- The area grade is low — what's the realistic commute time and amenity access for the typical tenant pool here? Any planned neighborhood developments (good or bad) we should know about?
- What's the average days-on-market for RENTAL listings here right now (not sales)? A rising rental-DOM trend means longer vacancies and softer asking-rent achievability than the comps imply.
- What's the recent tenant-quality profile in this submarket — average credit score on applications, eviction rate, late-payment / NSF rate, and stable-employment percentage? A property-management company in the area should have these aggregated.
- How much new apartment / multifamily construction is in the pipeline within 1–3 miles? Heavy new supply (>2% of stock underway) typically softens rents 12–24 months out; light construction supports rent growth.
Investment metrics
- 1% rule
- 1.08% ✓
- Cap rate
- 7.93%
- Cash-on-cash
- 5.83%
- DSCR
- 1.26
- GRM
- 7.7
CMA / ARV
- ARV (on-the-fly)
- $285,585
- Comps found
- 3
Show comp detail 3 sales within ~0.75 mi
| Address | Dist | Beds/Ba | Sqft | Sold | Price | $/sf | Match |
|---|---|---|---|---|---|---|---|
| 1635 Hillcrest Rd | 0.09mi | 6/2.0 (+1) | 3,090 (-14%) | 7mo | $245,000 | $79 | 56 |
| 1612 Hillcrest Rd | 0.10mi | 4/2.0 (-1) | 3,078 (-15%) | 20mo | $176,000 | $57 | 45 |
| 3239 Sycamore Rd | 0.53mi | 6/2.0 (+1) | 3,275 (-9%) | 12mo | $277,000 | $85 | 40 |
Match score weights: distance 35% · size 25% · config 20% · recency 20%. Top-matched comps best support the ARV.
Projected returns pro-forma
-3.0% appreciation · 5.7% rent growth · sell at horizon
- IRR
- -4.2%
- Equity multiple
- 0.84×
- Total profit
- $-15,638
- Equity at exit
- $52,037
- IRR
- 8.5%
- Equity multiple
- 1.73×
- Total profit
- $71,546
- Equity at exit
- $30,175
Cash invested: $97,720 (down + closing). Projections, not guarantees.
Landlord ↔ Tenant lean methodology
- Overall (STATE)
- 73 Landlord-Friendly
- State Ohio
- 73 Landlord-Friendly · R+6
- County
- — inherits STATE
- City
- — inherits STATE
ZIP-level market 44118
- Rents YoY
- 5.7%
- Active inventory
- 253
- Price-to-rent
- 23.1×
Monthly cashflow live
- Estimated rent
- $3,779 high interval (Pro) →
- Mortgage (P&I)
- −$1,830
- Tax from tax record
- −$535 /mo · $6,417/yr
- Insurance
- −$145
- HOA
- −$0
- Vacancy / Maint / Mgmt
- −$794
- Net cashflow
- $475
Break-even live
3-unit breakdown (identical units grouped — click to expand)
| Units | Beds | Baths | Est. rent |
|---|---|---|---|
| 3× units | 2 | 1 | $3,780 |
| #1 | 2 | 1 | $1,260 |
| #2 | 2 | 1 | $1,260 |
| #3 | 2 | 1 | $1,260 |
| Total (3 units) | $3,779 | ||
UW: 25.0% down · 7.5% · 30yr · 1.5% tax · 5.0% vac · 8.0% maint · 8.0% mgmt
Financing live
Cash to close
- Down payment
- $87,250
- Closing costs
- $10,470
- Reserves months
- —
- Total cash needed
- —
Loan-product check · same deal, 3 products live
Conventional
25% down · 7.5% · 30yr
- Down + closing
- —
- Monthly P&I
- —
- Monthly cashflow
- —
- DSCR
- —
- Eligible?
- —
Personal DTI + credit; lowest rate.
DSCR
20% down · 8.5% · 30yr
- Down + closing
- —
- Monthly P&I
- —
- Monthly cashflow
- —
- DSCR
- —
- Eligible?
- —
No personal income docs; deal must DSCR.
Hard money
10% down · 12.0% · 12mo
- Down + closing
- —
- Monthly P&I
- —
- Monthly cashflow
- —
- DSCR
- —
- Eligible?
- —
Short-term bridge; refi at stabilization.
Rent comps 2 comps
| Address | Beds | Baths | Sqft | Rent | $/sqft | DOM | Units | Dist |
|---|---|---|---|---|---|---|---|---|
| 3355 Desota Ave Cleveland, OH | 5.0 | 2.0 | 2540 | $2,031 | $0.80 | 7d | 1 | 0.82mi |
| 2501 Euclid Heights Blvd Cleveland, OH | 6.0 | 5.0 | 3000 | $3,600 | $1.20 | 16d | 1 | 1.18mi |
Listing history 41 events
-
2026-06-18days on market $349,000 Active 35 DOM
-
2026-06-17days on market $349,000 Active 34 DOM
-
2026-06-16days on market $349,000 Active 33 DOM
-
2026-06-15days on market $349,000 Active 32 DOM
-
2026-06-13days on market $349,000 Active 30 DOM
-
2026-06-09days on market $349,000 Active 26 DOM
-
2026-06-08days on market $349,000 Active 25 DOM
-
2026-06-07days on market $349,000 Active 24 DOM
-
2026-06-05days on market $349,000 Active 21 DOM
-
2026-06-03days on market $349,000 Active 20 DOM
-
2026-06-02days on market $349,000 Active 19 DOM
-
2026-06-01days on market $349,000 Active 18 DOM
-
2026-05-31price $349,000 Active 17 DOM
-
2026-05-31days on market $352,000 Active 17 DOM
-
2026-05-14$352,000 Active
-
2025-02-12soldstatus $232,500
-
2024-08-30historical
-
2024-08-05historical $900
-
2024-07-26$900
-
2024-07-10price $239,950
-
2024-06-18status Active
-
2024-06-13historical Contingent
-
2024-06-08price $245,000
-
2024-04-09status Active
-
2024-04-03historical Contingent
-
2024-03-22$250,000 Active
-
2023-10-10soldstatus $1,367,500
-
2021-03-25soldstatus $150,000
-
2013-06-14soldstatus $65,000 192-char remark
Show marketing remark (192 chars)
Large 3 family home. Great investment opportunity. 2 of 3 units occupied. Sold as is. Subject to a short sale, buyer to assume any outstanding violations. 24hr notice for showings is required.
-
2013-06-14soldstatus $41,835
Show marketing remark (192 chars)
Large 3 family home. Great investment opportunity. 2 of 3 units occupied. Sold as is. Subject to a short sale, buyer to assume any outstanding violations. 24hr notice for showings is required.
-
2012-11-27$75,000 192-char remark
Show marketing remark (192 chars)
Large 3 family home. Great investment opportunity. 2 of 3 units occupied. Sold as is. Subject to a short sale, buyer to assume any outstanding violations. 24hr notice for showings is required.
-
2012-11-20historical
-
2012-10-05$75,000
-
2010-08-04historical
-
2010-06-09$127,000
-
2010-02-22historical
-
2008-11-25$139,900
-
2007-10-14historical
-
2007-03-14$159,000
-
2005-06-01soldstatus $155,000
-
1993-02-04soldstatus $75,000
ⓘ Source: listings_history table (triggers on properties + properties_extension) + one-shot
backfill from property_details.listing_events for pre-trigger history.
Tax reassessment forecast OH · Partial reset (capped growth)
- Current annual tax
- $6,417 · $535/mo
- Projected year-2 tax
- $6,417 · $535/mo
- Expected delta
- $0/yr ($0/mo · 0.0%)
ⓘ Screening estimate from a state-policy table — verify with the county assessor before closing.
Climate risk First Street
- Flood 1/10 Low FEMA zone X (unshaded) · 0% chance over 30 yrs
- Wildfire 1/10 Low
- Heat 3/10 Moderate 7 d/yr ≥95°F today · 17 d/yr by 30 yrs out
- Wind 1/10 Low
- Air quality 3/10 Moderate 3 unhealthy d/yr today · 5 by 30 yrs out
Nearby sold comps map
Loading sold comps map…
Walkable amenities ~0.75 mi
Loading nearby amenities…
Taxation est. · year 1
- Rental income
- $45,348
- − Mortgage interest
- −$19,549
- − Property taxes
- −$6,417
- − Insurance
- −$1,745
- − Repairs & maintenance
- −$3,628
- − Management
- −$3,628
- − Depreciation
- −$10,153
- Taxable income
- $228
- Est. tax owed @ 24.0%
- −$55
- After-tax cash flow
- $5,646/yr
For passive investors: Depreciation is non-cash, so a rental often shows a tax loss while cash-flowing — sheltering income. Rental losses are passive: they offset passive income freely, and up to $25,000/yr can offset ordinary (W-2) income if you actively participate and your MAGI is under $100k (phasing out to $0 by $150k); unused losses carry forward. On sale, claimed depreciation is recaptured at up to 25%, and gains may owe capital-gains tax (a 1031 exchange can defer both). Figures are a year-1 estimate at your 24.0% rate — not tax advice; consult a CPA.
Schools (NCES district)
- District
- Cleveland Heights-University Heights City
- NCES district ID
- 3904379
- Math proficiency
- 23% ▼ -22.00%
- Reading proficiency
- 41% ▼ -12.00%
- Median HH income
- $53,451
- Composite
- 28.12/100
- National rank
- #6822
- State rank
- #568 of 656 in OH
Livability — Cleveland Heights
- Score
- 89/100
- State rank
- #12
- US rank
- #124
Category grades
Schools grade is shown separately in the Schools card above.
Census & demographics
- Census place
- Cleveland Heights, OH
- County
- Cuyahoga County · 1,090,369 people
- City population
- 32,312
- Metro
- Cleveland-Elyria, OH
- Population (ZIP)
- 40,715
- Household income
- $77,555
- Rent vs Own
- Severe rent burden
- 1847.0
Population outlook (Cuyahoga County) Hauer SSP2
- Today (2025)
- 1,244,621 people
- By 2030
- 1,230,093 · -1.2%
- By 2040
- 1,189,108 · -4.5%
- By 2050
- 1,145,706 · -7.9%
- By 2075
- 1,076,557 · -13.5%
- By 2100
- 978,987 · -21.3%
Race, ethnicity, and origin ACS 2023
- Neighborhood character
- Diverse neighborhood (Simpson 0.56)
- Race & ethnicity
- White 57% Black 33% Two or more races 4% Asian 3% Hispanic / Latino 2%
- Common ancestry
- Romanian 4% Scotch-Irish 2% Italian 2%
- Foreign-born
- 6% · Canada, China
- Languages at home
- 92% English-only · Spanish 2% Russian/Polish/Slavic 1% Other Indo-European 1%
Political lean MEDSL · Cuyahoga
- 2024 margin
- Solid D (+31.5) · D 65.4% · R 33.9%
- 2008→2024 swing
- -7.4pp toward R · 2008: 38.9pp · 2024: 31.5pp
- All cycles
- 2024: D+31.5 2020: D+34.1 2016: D+35.0 2012: D+38.7 2008: D+38.9
Not yet ingested
- Civics
- —
Market trends
- HPI YoY
- ▼ -319.62%
- Current HPI
- 204.5504
- Rent YoY
- ▲ 5.70%
- Metro
- Cleveland-Elyria, OH
- State GDP YoY
- ▲ 1.98%
- F500 in state
- 48
Industry mix (Fortune 500 HQ in OH)
| Industry | F500 HQs | Revenue |
|---|---|---|
| Insurance | 3 | $145B |
|
||
| Industrial Machinery | 3 | $49B |
|
||
| Financial Services | 3 | $24B |
|
||
| Consumer Goods | 2 | $93B |
|
||
| Aerospace / Defense | 2 | $47B |
|
||
| Utilities | 2 | $33B |
|
||
Price history
+369.3% since first listed27 events — show timeline
- 2026-05-14 Listed $352,000 MLSNOW
- 2025-02-12 Sold (Public Records) $232,500 Public Records
- 2024-08-30 Listing Removed — MLSNOW
- 2024-08-05 Rental Removed $900 APPFOLIO
- 2024-07-26 Listed for Rent $900 APPFOLIO
- 2024-07-10 Price Changed $239,950 MLSNOW
- 2024-06-18 Relisted — MLSNOW
- 2024-06-13 Contingent — MLSNOW
- 2024-06-08 Price Changed $245,000 MLSNOW
- 2024-04-09 Relisted — MLSNOW
- 2024-04-03 Contingent — MLSNOW
- 2024-03-22 Listed $250,000 MLSNOW
- 2023-10-10 Sold (Public Records) $1,367,500 Public Records
- 2021-03-25 Sold (Public Records) $150,000 Public Records
- 2013-06-14 Sold (Public Records) $41,835 Public Records
- 2013-06-14 Sold (MLS) $65,000 MLSNOW
- 2012-11-27 Listed $75,000 MLSNOW
- 2012-11-20 Listing Removed — MLSNOW
- 2012-10-05 Listed $75,000 MLSNOW
- 2010-08-04 Listing Removed — MLSNOW
- 2010-06-09 Listed $127,000 MLSNOW
- 2010-02-22 Listing Removed — MLSNOW
- 2008-11-25 Listed $139,900 MLSNOW
- 2007-10-14 Listing Removed — MLSNOW
- 2007-03-14 Listed $159,000 MLSNOW
- 2005-06-01 Sold (Public Records) $155,000 Public Records
- 1993-02-04 Sold (Public Records) $75,000 Public Records
Property tax history
+13.1%/yrLatest (2025): $6,417 · -2.0% YoY. Source: county tax records.
Cash-flow waterfall
monthlySold comps — $/sqft
last 12 mo · ≤1 miLoading sold comps…