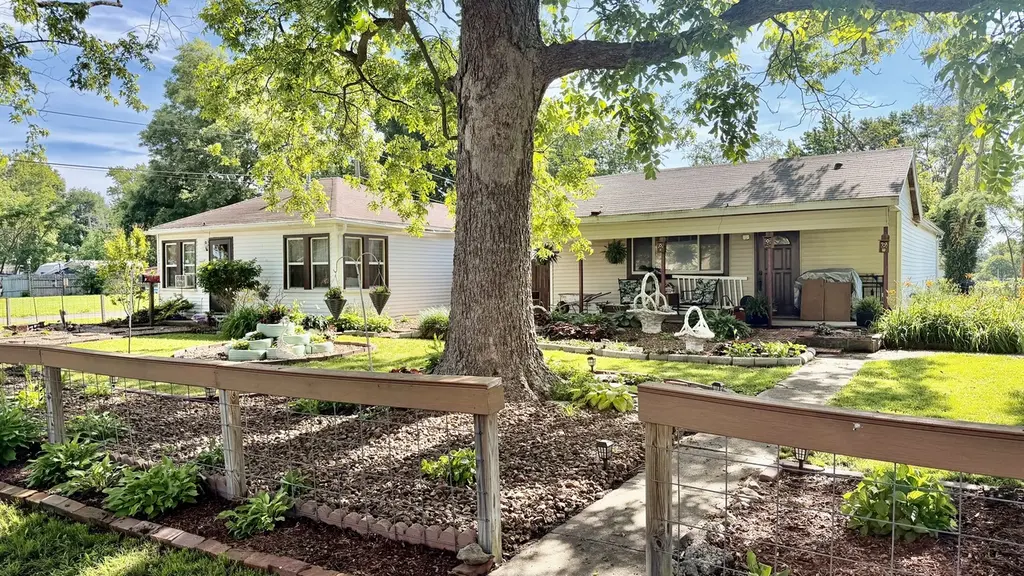
1225 Mckee St · Centralia, IL
Flood risk 1/10 · Minimal
- FEMA flood zone
- X (unshaded)
- Chance of flooding over 30 yrs
- 0.0%
- Est. flood insurance / yr
- $473 – $860
Fire risk 1/10 · Minimal
- Est. fire insurance / yr
- $804 – $1,492
Heat risk 4/10 · Minor
- Hot days now (above 106°F)
- 7 days/yr
- Hot days in 30 yrs
- 20 days/yr
Wind risk 2/10 · Minimal
- Chance of severe wind over 30 yrs
- 2.0%
Air-quality risk 2/10 · Minimal
- Unhealthy air days now
- 1 days/yr
- Unhealthy air days in 30 yrs
- 1 days/yr
Risk factors via First Street. Map © Google.
Why this score? — see what drove the B+ grade
The composite is a weighted blend of 9 inputs, each scored 0–100. Each bar is that input's sub-score; the figure is the points it added to the 100-point composite (weight × sub-score).
- Cash flow +30.0/30.0
- ARV discount +14.5/15.0
- 1% rule +10.0/10.0
- DSCR +10.0/10.0
- Livability +3.4/5.0
- Rent growth +2.5/5.0
- Condition / age +2.5/5.0
- Schools +2.2/10.0
- Appreciation +0.0/10.0
$49,900
🖨 Deal sheet 📄 Offer letter ✓ Due diligence
Listing remarks
This charming cottage-style home is full of character and thoughtful touches! From the moment you arrive, you'll appreciate the beautiful landscaping and pride of ownership that make this property truly stand out. This cozy 1 bedroom, 1 bath home sits on a spacious corner lot and offers a warm, inviting feel throughout. Enjoy your morning coffee in the sunroom or utilize the addition off the back as a home office, hobby space, or reading nook. A few furnace adds peace of mind, while the detached garage provides plenty of storage space. The backyard is a true showstopper and a dream for plant lovers. Wander along the charming walkway draped with mature grapevines, relax beneath the pergola-c
Key facts
- Mature grapevines
- Sunroom
- Private garden oasis
Tags
Property features AI
Finance
- Other: Fee simple ownership
- HOA & community: No master association fee required
Exterior
- Parking: Detached garage (1 garage space, 1 total parking space)
- Utilities: Public water; Public sewer
- Home design: Detached single-family home; One-story
- Construction: Vinyl siding; Built more than 70 years ago; Property built before 1978
- Exterior features: Lot dimensions approximately 80 x 123; Lot smaller than 0.25 acre
Interior
- Kitchen: Main-level kitchen (9 x 11)
- Bedrooms: Master bedroom on main level (9 x 11); Additional bedrooms
- Bathrooms: One full bathroom
- Heating & cooling: Electric heating; Window air conditioning units
- Interior features: Three total rooms; Crawl space basement
- Laundry & utility: Dedicated laundry room
Neighborhood map
What this means for you Summary
Snapshot
- This is a 1-bed/1.0-bath single-family listed at $50k.
Deal economics
- At list price, monthly cash flow is $458 ($5k/yr) — positive.
- The deal already cash-flows at list — no discount required.
- Meets the 1% rule at list price ($952 rent vs $50k).
- Cap rate 17.3% vs local median 5.8% in Centralia — top-decile yield for the area; either an underpriced asset or a hidden risk that comps aren't pricing in. Stress-test before assuming the spread holds.
Location & tenants
- Location reads 68/100 on livability (#481 in IL) — a middle-class / working-renter tenant base. Strengths: cost of living A+, housing A+, health & safety A+; Watch: crime F, amenities F, commute F.
- Centralia Hsd 200 (town): math 21% / reading 26% proficiency, ranked #668 of 919 in IL (top 73%) — low school quality limits family demand, transient renter base, plan for 1-2y turnover.
- Zoned schools: Centralia High School (math 22% / reading 17%, grade F, #397 of 693 statewide, top 61%, 863 students, 0% FRL).
- Market conditions: 99 active listings in the ZIP; 2 units permitted in Marion County in 2024 (0 in 5+ unit buildings).
Forward outlook
- Local home prices are declining (-3.0%/yr); year-one equity from $345 of loan paydown is wiped out by about $1k of value loss. Plan a longer hold.
- Marion County population projected at -20% by 2050 — secular population decline; favor cash flow + early exit over multi-decade hold.
- At projected returns (-3.0% appreciation + 3.0% rent growth), your $14k cash investment doubles in ~3 years — after that, you're playing with house money.
Negotiation context
- Only 8 days on market — expect competitive offers; lowballing is unlikely to land.
Risks & watch-outs
- Watch-outs: built in 1950 — expect roof / HVAC / electrical / plumbing capex.
Questions for the listing agent
- Built in 1950 — when were the roof, HVAC, electrical panel, plumbing, and water heater last replaced?
- Is there a deadline driving the sale (1031 exchange, divorce, estate, relocation)? That informs how much negotiation room exists.
- Schools are D-rated, which usually means shorter tenancies and higher turnover. Who's the typical renter profile here, and what's been the actual vacancy rate?
- Crime grade is F in this area — have there been break-ins, vandalism, or insurance claims at this property in the last 3 years? What carrier currently insures it and at what premium?
- What's the average days-on-market for RENTAL listings here right now (not sales)? A rising rental-DOM trend means longer vacancies and softer asking-rent achievability than the comps imply.
- What's the recent tenant-quality profile in this submarket — average credit score on applications, eviction rate, late-payment / NSF rate, and stable-employment percentage? A property-management company in the area should have these aggregated.
- How much new for-sale + rental construction is in the pipeline within 1–3 miles? Heavy new supply typically softens prices + rents 12–24 months out; constrained supply supports both.
Investment metrics
- 1% rule
- 1.91% ✓
- Cap rate
- 17.30%
- Cash-on-cash
- 39.30%
- DSCR
- 2.75
- GRM
- 4.4
CMA / ARV
- ARV (on-the-fly)
- $59,024
- Comps found
- 6
Show comp detail 6 sales within ~0.75 mi
| Address | Dist | Beds/Ba | Sqft | Sold | Price | $/sf | Match |
|---|---|---|---|---|---|---|---|
| 449 Bicknell St | 0.14mi | 2/1.0 (+1) | 992 (+4%) | 14mo | $54,000 | $54 | 70 |
| 1541 Knight St | 0.25mi | 2/2.0 (+1) | 980 (+3%) | 10mo | $114,900 | $117 | 66 |
| 145 E Prairie St | 0.42mi | 2/1.0 (+1) | 1,008 (+6%) | 9mo | $49,500 | $49 | 58 |
| 655 N Hickory St | 0.61mi | 2/1.0 (+1) | 984 (+3%) | 5mo | $35,000 | $36 | 57 |
| 1431 Patterson St | 0.25mi | 2/1.0 (+1) | 1,078 (+13%) | 13mo | $89,000 | $83 | 50 |
| 657 N Hickory St | 0.60mi | 2/1.0 (+1) | 1,053 (+11%) | 5mo | $65,000 | $62 | 45 |
Match score weights: distance 35% · size 25% · config 20% · recency 20%. Top-matched comps best support the ARV.
Projected returns pro-forma
-3.0% appreciation · 3.0% rent growth · sell at horizon
- IRR
- 35.5%
- Equity multiple
- 2.51×
- Total profit
- $21,044
- Equity at exit
- $7,440
- IRR
- 42.3%
- Equity multiple
- 4.99×
- Total profit
- $55,789
- Equity at exit
- $4,314
Cash invested: $13,972 (down + closing). Projections, not guarantees.
Landlord ↔ Tenant lean methodology
- Overall (STATE)
- 43 Moderately Tenant-Leaning
- State Illinois
- 43 Moderately Tenant-Leaning · D+7
- County
- — inherits STATE
- City
- — inherits STATE
ZIP-level market 62801
- Home prices YoY
- -13.9%
- Active inventory
- 99
- Price-to-rent
- 4.4×
Monthly cashflow live
- Estimated rent
- $952 medium interval (Pro) →
- Mortgage (P&I)
- −$262
- Tax from tax record
- −$12 /mo · $141/yr
- Insurance
- −$21
- HOA
- −$0
- Vacancy / Maint / Mgmt
- −$200
- Net cashflow
- $458
Break-even live
UW: 25.0% down · 7.5% · 30yr · 1.5% tax · 5.0% vac · 8.0% maint · 8.0% mgmt
Financing live
Cash to close
- Down payment
- $12,475
- Closing costs
- $1,497
- Reserves months
- —
- Total cash needed
- —
Loan-product check · same deal, 3 products live
Conventional
25% down · 7.5% · 30yr
- Down + closing
- —
- Monthly P&I
- —
- Monthly cashflow
- —
- DSCR
- —
- Eligible?
- —
Personal DTI + credit; lowest rate.
DSCR
20% down · 8.5% · 30yr
- Down + closing
- —
- Monthly P&I
- —
- Monthly cashflow
- —
- DSCR
- —
- Eligible?
- —
No personal income docs; deal must DSCR.
Hard money
10% down · 12.0% · 12mo
- Down + closing
- —
- Monthly P&I
- —
- Monthly cashflow
- —
- DSCR
- —
- Eligible?
- —
Short-term bridge; refi at stabilization.
Listing history 7 events
-
2026-06-18days on market $49,900 Active 8 DOM
-
2026-06-17days on market $49,900 Active 7 DOM
-
2026-06-16days on market $49,900 Active 6 DOM
-
2026-06-15days on market $49,900 Active 5 DOM
-
2026-06-13days on market $49,900 Active 3 DOM
-
2026-06-12remarks 699-char remark
-
2026-06-12$49,900 Active 2 DOM
ⓘ Source: listings_history table (triggers on properties + properties_extension) + one-shot
backfill from property_details.listing_events for pre-trigger history.
Tax reassessment forecast IL · Partial reset (capped growth)
- Current annual tax
- $141 · $12/mo
- Projected year-2 tax
- $637 · $53/mo
- Expected delta
- +$496/yr (+$41/mo · 351.7%)
ⓘ Screening estimate from a state-policy table — verify with the county assessor before closing.
Climate risk First Street
- Flood 1/10 Low FEMA zone X (unshaded) · 0% chance over 30 yrs
- Wildfire 1/10 Low
- Heat 4/10 Moderate 7 d/yr ≥106°F today · 20 d/yr by 30 yrs out
- Wind 2/10 Low 2% chance of damaging wind over 30 yrs
- Air quality 2/10 Low 1 unhealthy d/yr today · 1 by 30 yrs out
Nearby sold comps map
Loading sold comps map…
Walkable amenities ~0.75 mi
Loading nearby amenities…
Taxation est. · year 1
- Rental income
- $11,421
- − Mortgage interest
- −$2,795
- − Property taxes
- −$141
- − Insurance
- −$250
- − Repairs & maintenance
- −$914
- − Management
- −$914
- − Depreciation
- −$1,452
- Taxable income
- $4,956
- Est. tax owed @ 24.0%
- −$1,189
- After-tax cash flow
- $4,302/yr
For passive investors: Depreciation is non-cash, so a rental often shows a tax loss while cash-flowing — sheltering income. Rental losses are passive: they offset passive income freely, and up to $25,000/yr can offset ordinary (W-2) income if you actively participate and your MAGI is under $100k (phasing out to $0 by $150k); unused losses carry forward. On sale, claimed depreciation is recaptured at up to 25%, and gains may owe capital-gains tax (a 1031 exchange can defer both). Figures are a year-1 estimate at your 24.0% rate — not tax advice; consult a CPA.
Schools (NCES district)
- District
- Centralia Hsd 200
- NCES district ID
- 1709300
- Math proficiency
- 21% ▲ 6.00%
- Reading proficiency
- 26% ▲ 1.00%
- Median HH income
- $34,555
- Composite
- 22.43/100
- National rank
- #13470
- State rank
- #668 of 919 in IL
Livability — Centralia
- Score
- 68/100
- State rank
- #481
- US rank
- #9987
Category grades
Schools grade is shown separately in the Schools card above.
Census & demographics
- Census place
- Centralia, IL
- City population
- 19,941
- Population (ZIP)
- 19,941
Population outlook (Marion County) Hauer SSP2
- Today (2025)
- 36,071 people
- By 2030
- 34,598 · -4.1%
- By 2040
- 31,754 · -12.0%
- By 2050
- 28,912 · -19.8%
- By 2075
- 22,527 · -37.5%
- By 2100
- 16,455 · -54.4%
Race, ethnicity, and origin ACS 2023
- Neighborhood character
- Predominantly White (81%)
- Race & ethnicity
- White 81% Black 11% Two or more races 4% Hispanic / Latino 4% Asian 1%
- Common ancestry
- Serbian 2% Romanian 2% Lithuanian 1%
- Foreign-born
- 3% · Canada, China
- Languages at home
- 96% English-only · Spanish 2%
Political lean MEDSL · Marion
- 2024 margin
- Solid R (+49.5) · D 24.6% · R 74.1% · Other 1.4%
- 2008→2024 swing
- -47.5pp toward R · 2008: -2.0pp · 2024: -49.5pp
- All cycles
- 2024: R+49.5 2020: R+46.6 2016: R+44.9 2012: R+19.2 2008: R+2.0
Not yet ingested
- Civics
- —
Market trends
- HPI YoY
- ▼ -34.12%
- Current HPI
- 211.3835
- Rent YoY
- —
- Metro
- —
- State GDP YoY
- ▲ 1.59%
- F500 in state
- 60
Industry mix (Fortune 500 HQ in IL)
| Industry | F500 HQs | Revenue |
|---|---|---|
| Insurance | 4 | $201B |
|
||
| Consumer Goods | 4 | $87B |
|
||
| Industrial Machinery | 3 | $64B |
|
||
| Healthcare | 2 | $55B |
|
||
| Retail / Pharmacy | 1 | $148B |
|
||
| Agriculture / Food | 1 | $86B |
|
||
Price history
3 events — show timeline
- 2026-06-10 Listed $49,900 MRED as Distributed by MLS Grid
- 2022-04-16 Listing Removed — RMLSA as Distributed by MLS Grid
- 2022-04-15 Listing Removed — MRED as Distributed by MLS Grid
Cash-flow waterfall
monthlySold comps — $/sqft
last 12 mo · ≤1 miLoading sold comps…