 🏗️ New Construction
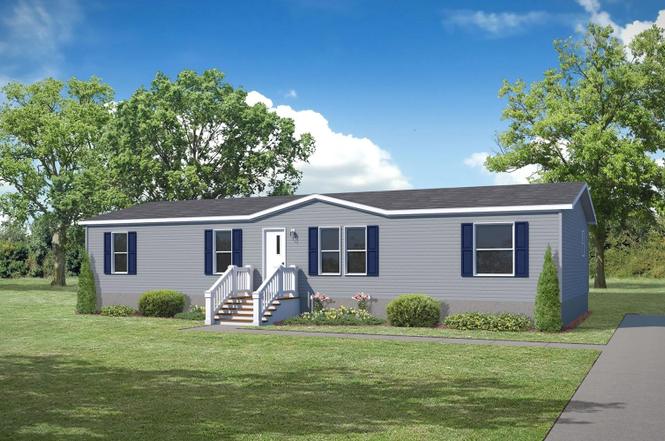
Crown (Riverbend) Plan · Thruston, KY
Flood risk No data
- FEMA flood zone
- —
- Chance of flooding over 30 yrs
- —
- Est. flood insurance / yr
- —
Fire risk No data
- Est. fire insurance / yr
- —
Heat risk No data
- Hot days now (above threshold)
- —
- Hot days in 30 yrs
- —
Wind risk No data
- Chance of severe wind over 30 yrs
- —
Air-quality risk No data
- Unhealthy air days now
- —
- Unhealthy air days in 30 yrs
- —
Risk factors via First Street. Map © Google.
Why this score? — see what drove the B- grade
The composite is a weighted blend of 9 inputs, each scored 0–100. Each bar is that input's sub-score; the figure is the points it added to the 100-point composite (weight × sub-score).
- Cash flow +28.0/30.0
- 1% rule +10.0/10.0
- DSCR +9.9/10.0
- ARV discount +7.5/15.0
- Schools +3.2/10.0
- Rent growth +2.5/5.0
- Livability +2.5/5.0
- Condition / age +2.5/5.0
- Appreciation +0.0/10.0
$92,995
🖨 Deal sheet 📄 Offer letter ✓ Due diligence
Listing remarks
Riverbend Pointe is in a quiet suburban neighborhood in a convenient location not far from the Ohio River in Northern Owensboro and close to shopping, employment and schools near Highway 60. Community Amenities Basketball Court, Clubhouse, Playground, and Soccer Field For current prices of homes in Riverbend Pointe call our sales office today!
Key facts
- Listed 323 days
Property features AI
Finance
- Other: List price $92,995; Status: Active
- HOA & community: Association fee of $400
Exterior
- Home design: New construction plan (Inventory type: Plan)
- Construction: Crown (Riverbend) plan
- Exterior features: Address: Owensboro, KY (Crown (Riverbend) Plan at 501 Office Ln)
Interior
- Bedrooms: 4 bedrooms
- Bathrooms: 2 full bathrooms
- Interior features: Plan home (Crown - Riverbend); Approximately 1,493 living area
Neighborhood map
What this means for you Summary
Snapshot
- This is a 4-bed/2.0-bath manufactured listed at $93k.
Deal economics
- At list price, monthly cash flow is $288 ($3k/yr) — positive.
- The deal already cash-flows at list — no discount required.
- Meets the 1% rule at list price ($2k rent vs $93k).
- Recommended offer: $82k (12.0% below list) — sets the bar for market timing.
- Cap rate 10.0% vs local median 3.4% in Thruston — top-decile yield for the area; either an underpriced asset or a hidden risk that comps aren't pricing in. Stress-test before assuming the spread holds.
Location & tenants
- Location reads: area grade B — affects rentability + tenant quality, not the cash-flow math above.
- Daviess County (suburban): math 33% / reading 41% proficiency, ranked #43 of 165 in KY (top 26%) — families likely to look elsewhere, expect single-tenant / working-renter base with shorter leases.
- Market conditions: 360 active listings in the ZIP; 226 units permitted in Daviess County in 2024 (6 in 5+ unit buildings).
- This rent runs 31% of the median local income ($65k/yr) — at the standard rent-burdened threshold; future hikes will face affordability resistance.
Forward outlook
- Local home prices are declining (-3.0%/yr); year-one equity from $643 of loan paydown is wiped out by about $3k of value loss. Plan a longer hold.
- Daviess County population projected at +6% by 2050 — modest demand growth; plan on rents tracking national, not racing it.
- At projected returns (-3.0% appreciation + 3.0% rent growth), your $26k cash investment doubles in ~9 years — after that, you're playing with house money.
Negotiation context
- It's been on market 324 days — a 12% lower offer ($82k) is reasonable based on typical stale-listing flexibility.
Risks & watch-outs
- Watch-outs: HOA is 24% of rent.
Questions for the listing agent
- It's been on market 324 days. Have you received any prior offers? Is the seller open to a 12% concession, seller financing, or rate buy-down credit?
- What does the HOA fee cover, when was the last increase, and are there any pending special assessments or reserve-fund shortfalls?
- Why hasn't it sold? Are there any deal-killer items the seller is aware of (foundation, flood, title, zoning, code violations)?
- Is there a deadline driving the sale (1031 exchange, divorce, estate, relocation)? That informs how much negotiation room exists.
- What's the average days-on-market for RENTAL listings here right now (not sales)? A rising rental-DOM trend means longer vacancies and softer asking-rent achievability than the comps imply.
- What's the recent tenant-quality profile in this submarket — average credit score on applications, eviction rate, late-payment / NSF rate, and stable-employment percentage? A property-management company in the area should have these aggregated.
- How much new for-sale + rental construction is in the pipeline within 1–3 miles? Heavy new supply typically softens prices + rents 12–24 months out; constrained supply supports both.
Investment metrics
- 1% rule
- 1.81% ✓
- Cap rate
- 10.01%
- Cash-on-cash
- 13.29%
- DSCR
- 1.59
- GRM
- 4.6
CMA / ARV
No comps found within radius.
Projected returns pro-forma
-3.0% appreciation · 3.0% rent growth · sell at horizon
- IRR
- 3.5%
- Equity multiple
- 1.14×
- Total profit
- $3,570
- Equity at exit
- $13,866
- IRR
- 13.3%
- Equity multiple
- 2.07×
- Total profit
- $27,861
- Equity at exit
- $8,041
Cash invested: $26,039 (down + closing). Projections, not guarantees.
Landlord ↔ Tenant lean methodology
- Overall (STATE)
- 83 Strongly Landlord-Friendly
- State Kentucky
- 83 Strongly Landlord-Friendly · R+16
- County
- — inherits STATE
- City
- — inherits STATE
ZIP-level market 42303
- Home prices YoY
- -29.1%
- Active inventory
- 360
- Price-to-rent
- 4.6×
Monthly cashflow live
- Estimated rent
- $1,685 medium interval (Pro) →
- Mortgage (P&I)
- −$488
- Tax est. 1.5%
- −$116 /mo · $1,395/yr
- Insurance
- −$39
- HOA
- −$400
- Vacancy / Maint / Mgmt
- −$354
- Net cashflow
- $288
Break-even live
UW: 25.0% down · 7.5% · 30yr · 1.5% tax · 5.0% vac · 8.0% maint · 8.0% mgmt
Financing live
Cash to close
- Down payment
- $23,249
- Closing costs
- $2,790
- Reserves months
- —
- Total cash needed
- —
Loan-product check · same deal, 3 products live
Conventional
25% down · 7.5% · 30yr
- Down + closing
- —
- Monthly P&I
- —
- Monthly cashflow
- —
- DSCR
- —
- Eligible?
- —
Personal DTI + credit; lowest rate.
DSCR
20% down · 8.5% · 30yr
- Down + closing
- —
- Monthly P&I
- —
- Monthly cashflow
- —
- DSCR
- —
- Eligible?
- —
No personal income docs; deal must DSCR.
Hard money
10% down · 12.0% · 12mo
- Down + closing
- —
- Monthly P&I
- —
- Monthly cashflow
- —
- DSCR
- —
- Eligible?
- —
Short-term bridge; refi at stabilization.
HOA detail
- Monthly dues
- $400 · $4,800/yr
Listing history 17 events
-
2026-06-19days on market $92,995 Active 324 DOM
-
2026-06-18days on market $92,995 Active 323 DOM
-
2026-06-17days on market $92,995 Active 322 DOM
-
2026-06-16days on market $92,995 Active 321 DOM
-
2026-06-15days on market $92,995 Active 320 DOM
-
2026-06-14days on market $92,995 Active 318 DOM
-
2026-06-13days on market $92,995 Active 317 DOM
-
2026-06-10days on market $92,995 Active 315 DOM
-
2026-06-09days on market $92,995 Active 314 DOM
-
2026-06-08days on market $92,995 Active 313 DOM
-
2026-06-07days on market $92,995 Active 312 DOM
-
2026-06-05days on market $92,995 Active 309 DOM
-
2026-06-03days on market $92,995 Active 308 DOM
-
2026-06-02days on market $92,995 Active 307 DOM
-
2026-06-01days on market $92,995 Active 306 DOM
-
2026-05-31days on market $92,995 Active 305 DOM
-
2026-05-30days on market $92,995 Active 304 DOM
ⓘ Source: listings_history table (triggers on properties + properties_extension) + one-shot
backfill from property_details.listing_events for pre-trigger history.
Nearby sold comps map
Loading sold comps map…
Walkable amenities ~0.75 mi
Loading nearby amenities…
Taxation est. · year 1
- Rental income
- $20,219
- − Mortgage interest
- −$5,209
- − Property taxes
- −$1,395
- − Insurance
- −$465
- − Repairs & maintenance
- −$1,617
- − Management
- −$1,617
- − HOA
- −$4,800
- − Depreciation
- −$2,705
- Taxable income
- $2,409
- Est. tax owed @ 24.0%
- −$578
- After-tax cash flow
- $2,882/yr
For passive investors: Depreciation is non-cash, so a rental often shows a tax loss while cash-flowing — sheltering income. Rental losses are passive: they offset passive income freely, and up to $25,000/yr can offset ordinary (W-2) income if you actively participate and your MAGI is under $100k (phasing out to $0 by $150k); unused losses carry forward. On sale, claimed depreciation is recaptured at up to 25%, and gains may owe capital-gains tax (a 1031 exchange can defer both). Figures are a year-1 estimate at your 24.0% rate — not tax advice; consult a CPA.
Schools (NCES district)
- District
- Daviess County
- NCES district ID
- 2101470
- Math proficiency
- 33% ▼ -17.00%
- Reading proficiency
- 41% ▼ -16.00%
- Median HH income
- $52,303
- Composite
- 32.2/100
- National rank
- #5778
- State rank
- #43 of 165 in KY
Livability — Thruston
No livability data for this city. (Only ~50 U.S. cities are tracked.)
Census & demographics
- County
- Daviess County · 87,564 people
- Metro
- Owensboro, KY
- Population (ZIP)
- 42,119
- Household income
- $64,773
- Rent vs Own
- Severe rent burden
- 983.0
Population outlook (Daviess County) Hauer SSP2
- Today (2025)
- 103,810 people
- By 2030
- 105,722 · +1.8%
- By 2040
- 108,731 · +4.7%
- By 2050
- 110,295 · +6.2%
- By 2075
- 113,056 · +8.9%
- By 2100
- 106,257 · +2.4%
Race, ethnicity, and origin ACS 2023
- Neighborhood character
- Predominantly White (85%)
- Race & ethnicity
- White 85% Hispanic / Latino 5% Two or more races 5% Black 3% Asian 2%
- Common ancestry
- Italian 2% Slovak 1% Lithuanian 1%
- Foreign-born
- 4% · Canada, Philippines
- Languages at home
- 94% English-only · Spanish 3% Other Indo-European 1% Other Asian/Pacific 1%
Political lean MEDSL · Daviess
- 2024 margin
- Solid R (+31.9) · D 33.3% · R 65.2% · Other 1.5%
- 2008→2024 swing
- -21.8pp toward R · 2008: -10.1pp · 2024: -31.9pp
- All cycles
- 2024: R+31.9 2020: R+27.9 2016: R+32.2 2012: R+21.1 2008: R+10.1
Not yet ingested
- Civics
- —
Market trends
- HPI YoY
- ▼ -89.55%
- Current HPI
- 217.7128
- Rent YoY
- —
- Metro
- Owensboro, KY
- State GDP YoY
- ▲ 1.81%
- F500 in state
- 4
Industry mix (Fortune 500 HQ in KY)
| Industry | F500 HQs | Revenue |
|---|---|---|
| Healthcare | 1 | $118B |
|
||
| Food / Beverage | 1 | $7B |
|
||
Cash-flow waterfall
monthlySold comps — $/sqft
last 12 mo · ≤1 miLoading sold comps…