132 E 11th St · San Angelo, TX
Flood risk 1/10 · Minimal
- FEMA flood zone
- X (unshaded)
- Chance of flooding over 30 yrs
- 0.0%
- Est. flood insurance / yr
- $507 – $1,088
Fire risk 3/10 · Minor
- Est. fire insurance / yr
- $1,222 – $2,270
Heat risk 7/10 · Major
- Hot days now (above 104°F)
- 7 days/yr
- Hot days in 30 yrs
- 23 days/yr
Wind risk 4/10 · Minor
- Chance of severe wind over 30 yrs
- 12.0%
Air-quality risk 1/10 · Minimal
- Unhealthy air days now
- 0 days/yr
- Unhealthy air days in 30 yrs
- 0 days/yr
Risk factors via First Street. Map © Google.
Why this score? — see what drove the F grade
The composite is a weighted blend of 9 inputs, each scored 0–100. Each bar is that input's sub-score; the figure is the points it added to the 100-point composite (weight × sub-score).
- ARV discount +8.7/15.0
- Cash flow +7.5/30.0
- Rent growth +4.6/5.0
- Livability +3.7/5.0
- Schools +2.6/10.0
- Condition / age +2.5/5.0
- 1% rule +2.2/10.0
- DSCR +1.6/10.0
- Appreciation +0.0/10.0
$175,000
🖨 Deal sheet 📄 Offer letter ✓ Due diligence
Listing remarks
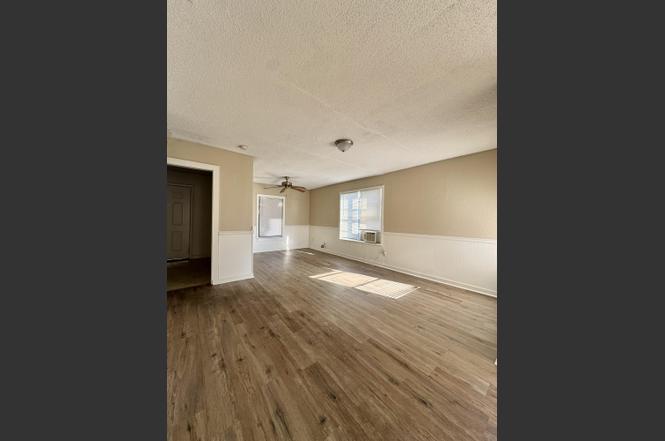
Investment opportunity just minutes from downtown San Angelo! This duplex features a 2 bed/1 bath unit (tenant occupied) and a 1 bed/1 bath unit (vacant), offering immediate rental income with the opportunity to lease the second unit or owner-occupy. Both units feature durable vinyl plank flooring throughout. Offered at an attractive price point, this property is an excellent opportunity for investors looking to grow their portfolio or owner-occupants hoping to offset their mortgage with rental income.
Key facts
- 5,009 sq ft lot
- Built 1980
Property features AI
Exterior
- Parking: On-street parking
- Security: Smoke detector(s)
- Utilities: Public water; Public sewer; Electricity connected; Water connected; Sewer connected
- Home design: Duplex residential income property; One level
- Construction: Vinyl siding
- Exterior features: Composition roof; Paved road frontage on a public maintained city street; Zoned for multi-family
Interior
- Flooring: Vinyl flooring
- Heating & cooling: Central heating; Central air; Wall/window unit(s); Ceiling fan(s)
- Interior features: Ceiling fan(s)
Neighborhood map
What this means for you Summary
Snapshot
- This is a single-family listed at $175k.
Deal economics
- At list price, monthly cash flow is $-216 ($-3k/yr) — negative.
- To cash-flow at today's rent, offer at most $144k (17.9% below list).
- To meet the 1% rule (rent ≥ 1% of price), the offer needs to be $126k (28.2% below list).
- Recommended offer: $126k (28.2% below list) — sets the bar for 1% rule.
- Cap rate 4.8% vs local median 3.8% in San Angelo — meaningfully above typical; check what's discounted (condition, days-on-market, listing class) to confirm the premium yield is real.
Location & tenants
- Location reads 73/100 on livability (#199 in TX) — a middle-class / working-renter tenant base. Strengths: cost of living A+, housing A+, health & safety A+; Watch: employment C-, amenities F, commute F.
- San Angelo ISD (urban): math 27% / reading 33% proficiency, ranked #627 of 826 in TX (top 76%) — families likely to look elsewhere, expect single-tenant / working-renter base with shorter leases.
- Zoned schools: Reagan El (math 32% / reading 32%, grade F, #2,268 of 4,322 statewide, top 55%, 311 students, 88% FRL); Lincoln Middle (math 19% / reading 23%, grade F, #1,387 of 1,662 statewide, top 85%, 844 students, 78% FRL); Lake View H S (math 6% / reading 22%, grade F, #1,527 of 1,632 statewide, top 94%, 1,085 students, 64% FRL) — zoned schools average 77% FRL vs 53% district-wide (24 pts higher); higher-poverty schools than district average — tighter screening recommended.
- Market conditions: Rents rising fast (+8.5%/yr); 227 active listings in the ZIP; 15 comparable units currently listed for rent nearby; rentals at typical pace (median 21d on market — plan ~3-4 weeks tenant-placement turnaround); 47% of comp listings sitting > 30 days — soft ceiling on asking rent; 233 units permitted in Tom Green County in 2024 (0 in 5+ unit buildings).
- This rent runs 30% of the median local income ($49k/yr) — at the standard rent-burdened threshold; future hikes will face affordability resistance.
Forward outlook
- Local home prices are declining (-3.0%/yr); year-one equity from $1k of loan paydown is wiped out by about $5k of value loss. Plan a longer hold.
- Tom Green County population projected at +35% by 2050 — long-run rental-demand tailwind backs the buy-and-hold thesis.
Negotiation context
- Only 2 days on market — expect competitive offers; lowballing is unlikely to land.
- 4 sale attempts with the ask held roughly flat each time — persistent listings suggest the price (not the market) is what's stuck; bring a comps-based counter.
Risks & watch-outs
- Climate carrying-cost: extreme-heat days projected 7→23/yr by 2055 (HVAC capex compounding) — expect insurance premiums to compound above CPI over the hold.
Questions for the listing agent
- What do current leases actually rent for vs. the listed asking? Can we see a recent rent roll and the last 12 months of T-12 income?
- Is there a deadline driving the sale (1031 exchange, divorce, estate, relocation)? That informs how much negotiation room exists.
- Schools are F-rated, which usually means shorter tenancies and higher turnover. Who's the typical renter profile here, and what's been the actual vacancy rate?
- The area grade is low — what's the realistic commute time and amenity access for the typical tenant pool here? Any planned neighborhood developments (good or bad) we should know about?
- What's the average days-on-market for RENTAL listings here right now (not sales)? A rising rental-DOM trend means longer vacancies and softer asking-rent achievability than the comps imply.
- What's the recent tenant-quality profile in this submarket — average credit score on applications, eviction rate, late-payment / NSF rate, and stable-employment percentage? A property-management company in the area should have these aggregated.
- How much new for-sale + rental construction is in the pipeline within 1–3 miles? Heavy new supply typically softens prices + rents 12–24 months out; constrained supply supports both.
Investment metrics
- 1% rule
- 0.72% ✗
- Cap rate
- 4.81%
- Cash-on-cash
- -5.30%
- DSCR
- 0.76
- GRM
- 11.6
CMA / ARV
- ARV (on-the-fly)
- $179,712
- Comps found
- 12
Show comp detail 12 sales within ~0.75 mi
| Address | Dist | Beds/Ba | Sqft | Sold | Price | $/sf | Match |
|---|---|---|---|---|---|---|---|
| 406 E 13th St | 0.23mi | 2/1.0 | 1,400 (-0%) | 10mo | $168,000 | $120 | 80 |
| 902 E 17th St | 0.43mi | 3/2.0 | 1,384 (-1%) | 4mo | $179,900 | $130 | 74 |
| 21 W 20th St | 0.67mi | 3/2.0 | 1,370 (-2%) | 2mo | $225,000 | $164 | 63 |
| 17 W 20th St | 0.67mi | 3/2.0 | 1,370 (-2%) | 8mo | $235,000 | $172 | 58 |
| 407 Koberlin St | 0.73mi | 2/1.0 | 1,347 (-4%) | 5mo | $126,000 | $94 | 55 |
| 34 W 9th St | 0.37mi | 2/1.0 | 1,214 (-14%) | 7mo | $130,000 | $107 | 54 |
| 606 E 17th St | 0.37mi | 2/1.5 | 1,215 (-14%) | 8mo | $159,900 | $132 | 54 |
| 83 E 20th St | 0.63mi | 3/2.0 | 1,308 (-7%) | 7mo | $137,500 | $105 | 53 |
| 252 Pecan St | 0.51mi | 1/1.0 | 1,550 (+10%) | 11mo | $55,000 | $35 | 50 |
| 231 N Malone St | 0.73mi | 2/1.0 | 1,284 (-8%) | 10mo | $187,900 | $146 | 43 |
| 919 E 20th St | 0.62mi | 4/2.0 | 1,600 (+14%) | 8mo | $175,000 | $109 | 41 |
| 115 W 3rd St | 0.59mi | 2/1.0 | 1,208 (-14%) | 11mo | $154,900 | $128 | 40 |
Match score weights: distance 35% · size 25% · config 20% · recency 20%. Top-matched comps best support the ARV.
Projected returns pro-forma
-3.0% appreciation · 8.0% rent growth · sell at horizon
- IRR
- -19.9%
- Equity multiple
- 0.28×
- Total profit
- $-35,474
- Equity at exit
- $26,093
- IRR
- -4.7%
- Equity multiple
- 0.63×
- Total profit
- $-18,320
- Equity at exit
- $15,131
Cash invested: $49,000 (down + closing). Projections, not guarantees.
Landlord ↔ Tenant lean methodology
- Overall (STATE)
- 87 Strongly Landlord-Friendly
- State Texas
- 87 Strongly Landlord-Friendly · R+5
- County
- — inherits STATE
- City
- — inherits STATE
ZIP-level market 76903
- Rents YoY
- 8.5%
- Active inventory
- 227
- Price-to-rent
- 11.6×
Monthly cashflow live
- Estimated rent
- $1,257 high interval (Pro) →
- Mortgage (P&I)
- −$918
- Tax est. 1.5%
- −$219 /mo · $2,625/yr
- Insurance
- −$73
- HOA
- −$0
- Vacancy / Maint / Mgmt
- −$264
- Net cashflow
- $-216
Break-even live
UW: 25.0% down · 7.5% · 30yr · 1.5% tax · 5.0% vac · 8.0% maint · 8.0% mgmt
Financing live
Cash to close
- Down payment
- $43,750
- Closing costs
- $5,250
- Reserves months
- —
- Total cash needed
- —
Loan-product check · same deal, 3 products live
Conventional
25% down · 7.5% · 30yr
- Down + closing
- —
- Monthly P&I
- —
- Monthly cashflow
- —
- DSCR
- —
- Eligible?
- —
Personal DTI + credit; lowest rate.
DSCR
20% down · 8.5% · 30yr
- Down + closing
- —
- Monthly P&I
- —
- Monthly cashflow
- —
- DSCR
- —
- Eligible?
- —
No personal income docs; deal must DSCR.
Hard money
10% down · 12.0% · 12mo
- Down + closing
- —
- Monthly P&I
- —
- Monthly cashflow
- —
- DSCR
- —
- Eligible?
- —
Short-term bridge; refi at stabilization.
Rent comps 15 comps
| Address | Beds | Baths | Sqft | Rent | $/sqft | DOM | Units | Dist |
|---|---|---|---|---|---|---|---|---|
| 212 Koberlin St San Angelo, TX | 2.0 | 2.0 | 925 | $945 | $1.02 | 43d | 1 | 0.60mi |
| 540 W 16th St San Angelo, TX | 3.0 | 2.0 | 1090 | $1,364 | $1.25 | 43d | 1 | 0.82mi |
| 312 E 23rd St San Angelo, TX | 3.0 | 1.0 | 1148 | $1,400 | $1.22 | 43d | 1 | 0.86mi |
| 706 W 16th St San Angelo, TX | 3.0 | 2.0 | 1298 | $1,590 | $1.22 | 21d | 1 | 0.97mi |
| 2417 Oaklawn Blvd San Angelo, TX | 2.0 | 2.0 | 897 | $1,550 | $1.73 | 43d | 1 | 0.98mi |
| 902 Shiloh St Unit RE-908-16 San Angelo, TX | 2.0 | 1.0 | 875 | $1,125 | $1.29 | 43d | 1 | 1.16mi |
| 902 Shiloh St Unit RE-908-C San Angelo, TX | 2.0 | 1.5 | 925 | $1,175 | $1.27 | 43d | 1 | 1.16mi |
| 2308 Carley St San Angelo, TX | 3.0 | 1.5 | 985 | $1,102 | $1.12 | 21d | 1 | 1.17mi |
| 810 W 19th St San Angelo, TX | 3.0 | 2.0 | 1090 | $1,249 | $1.15 | 21d | 1 | 1.17mi |
| 510 E 28th St San Angelo, TX | 3.0 | 1.5 | 924 | $1,102 | $1.19 | 21d | 1 | 1.23mi |
| 939 LBJ Dr San Angelo, TX | 3.0 | 1.5 | 924 | $1,102 | $1.19 | 21d | 1 | 1.25mi |
| 940 LBJ Dr San Angelo, TX | 3.0 | 1.5 | 924 | $1,102 | $1.19 | 21d | 1 | 1.28mi |
| 2917 JFK Dr San Angelo, TX | 3.0 | 1.5 | 924 | $1,102 | $1.19 | 21d | 1 | 1.33mi |
| 2921 JFK Dr San Angelo, TX | 3.0 | 1.5 | 924 | $1,102 | $1.19 | 21d | 1 | 1.34mi |
| 209 West Avenue C Unit A San Angelo, TX | 2.0 | 2.0 | 1100 | $1,400 | $1.27 | 43d | 1 | 1.44mi |
Listing history 3 events
-
2026-06-19days on market $175,000 Active 2 DOM
-
2026-06-17remarks 507-char remark
-
2026-06-17$175,000 Active 1 DOM
ⓘ Source: listings_history table (triggers on properties + properties_extension) + one-shot
backfill from property_details.listing_events for pre-trigger history.
Climate risk First Street
- Flood 1/10 Low FEMA zone X (unshaded) · 0% chance over 30 yrs
- Wildfire 3/10 Moderate
- Heat 7/10 Severe 7 d/yr ≥104°F today · 23 d/yr by 30 yrs out
- Wind 4/10 Moderate 12% chance of damaging wind over 30 yrs
- Air quality 1/10 Low 0 unhealthy d/yr today · 0 by 30 yrs out
Nearby sold comps map
Loading sold comps map…
Walkable amenities ~0.75 mi
Loading nearby amenities…
Taxation est. · year 1
- Rental income
- $15,084
- − Mortgage interest
- −$9,803
- − Property taxes
- −$2,625
- − Insurance
- −$875
- − Repairs & maintenance
- −$1,207
- − Management
- −$1,207
- − Depreciation
- −$5,091
- Taxable loss
- −$5,723
- Est. tax savings @ 24.0%
- +$1,373
- After-tax cash flow
- $-1,223/yr
For passive investors: Depreciation is non-cash, so a rental often shows a tax loss while cash-flowing — sheltering income. Rental losses are passive: they offset passive income freely, and up to $25,000/yr can offset ordinary (W-2) income if you actively participate and your MAGI is under $100k (phasing out to $0 by $150k); unused losses carry forward. On sale, claimed depreciation is recaptured at up to 25%, and gains may owe capital-gains tax (a 1031 exchange can defer both). Figures are a year-1 estimate at your 24.0% rate — not tax advice; consult a CPA.
Schools (NCES district)
- District
- San Angelo ISD
- NCES district ID
- 4838700
- Math proficiency
- 27% ▼ -9.00%
- Reading proficiency
- 33% ▼ -3.00%
- Median HH income
- $43,501
- Composite
- 25.56/100
- National rank
- #7427
- State rank
- #627 of 826 in TX
Livability — San Angelo
- Score
- 73/100
- State rank
- #199
- US rank
- #5030
Category grades
Schools grade is shown separately in the Schools card above.
Census & demographics
- Census place
- San Angelo, TX
- County
- Tom Green County · 113,188 people
- City population
- 81,357
- Metro
- San Angelo, TX
- Population (ZIP)
- 29,947
- Household income
- $49,498
- Rent vs Own
- Severe rent burden
- 1255.0
Population outlook (Tom Green County) Hauer SSP2
- Today (2025)
- 135,110 people
- By 2030
- 144,090 · +6.6%
- By 2040
- 162,561 · +20.3%
- By 2050
- 182,158 · +34.8%
- By 2075
- 232,274 · +71.9%
- By 2100
- 268,218 · +98.5%
Race, ethnicity, and origin ACS 2023
- Neighborhood character
- Diverse neighborhood (Simpson 0.56)
- Race & ethnicity
- Hispanic / Latino 56% White 36% Two or more races 26% Black 5%
- Hispanic origin (detail)
- Mexican 49% Puerto Rican 1%
- Common ancestry
- Italian 1% Serbian 1% Slovak 1%
- Foreign-born
- 10% · Canada
- Languages at home
- 66% English-only · Spanish 33%
Political lean MEDSL · Tom Green
- 2024 margin
- Solid R (+48.0) · D 25.5% · R 73.5% · Other 1.0%
- 2008→2024 swing
- -6.3pp toward R · 2008: -41.7pp · 2024: -48.0pp
- All cycles
- 2024: R+48.0 2020: R+44.4 2016: R+47.9 2012: R+47.9 2008: R+41.7
Not yet ingested
- Civics
- —
Market trends
- HPI YoY
- ▼ -164.90%
- Current HPI
- 217.0406
- Rent YoY
- ▲ 8.46%
- Metro
- San Angelo, TX
- State GDP YoY
- ▲ 3.95%
- F500 in state
- 110
Industry mix (Fortune 500 HQ in TX)
| Industry | F500 HQs | Revenue |
|---|---|---|
| Energy | 16 | $1,198B |
|
||
| Technology | 5 | $198B |
|
||
| Engineering / Construction | 4 | $72B |
|
||
| Energy Services | 3 | $60B |
|
||
| Utilities | 3 | $41B |
|
||
| Healthcare | 2 | $330B |
|
||
Price history
6 events — show timeline
- 2026-06-17 Listed $175,000 SAAR TX
- 2026-05-22 Listed for Rent $895 APPFOLIO
- 2025-12-18 Rental Removed $695 TENANTTURNER2
- 2025-11-18 Listed for Rent $695 TENANTTURNER2
- 2025-11-18 Rental Removed $695 APPFOLIO
- 2025-11-13 Listed for Rent $695 APPFOLIO
Cash-flow waterfall
monthlySold comps — $/sqft
last 12 mo · ≤1 miLoading sold comps…