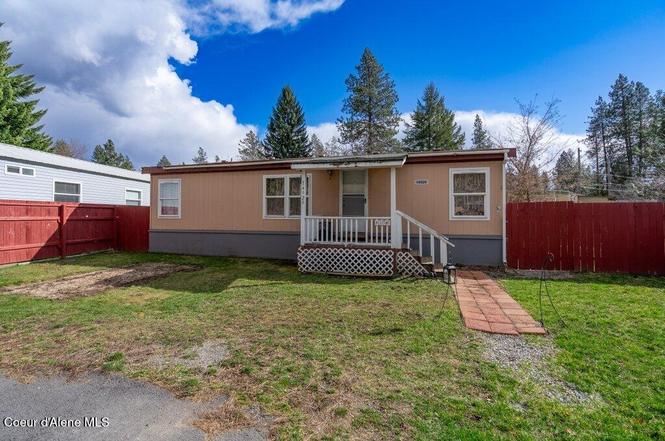
14929 N Meadow View Ct · Rathdrum, ID
Flood risk 9/10 · Severe
- FEMA flood zone
- AE
- Chance of flooding over 30 yrs
- 0.99%
- Est. flood insurance / yr
- $1,737 – $8,500
Fire risk 6/10 · Moderate
- Est. fire insurance / yr
- $584 – $1,086
Heat risk 2/10 · Minimal
- Hot days now (above 92°F)
- 7 days/yr
- Hot days in 30 yrs
- 15 days/yr
Wind risk 1/10 · Minimal
- Chance of severe wind over 30 yrs
- —
Air-quality risk 8/10 · Major
- Unhealthy air days now
- 15 days/yr
- Unhealthy air days in 30 yrs
- 16 days/yr
Risk factors via First Street. Map © Google.
Why this score? — see what drove the B grade
The composite is a weighted blend of 9 inputs, each scored 0–100. Each bar is that input's sub-score; the figure is the points it added to the 100-point composite (weight × sub-score).
- Cash flow +30.0/30.0
- 1% rule +10.0/10.0
- DSCR +10.0/10.0
- ARV discount +7.5/15.0
- Schools +4.2/10.0
- Livability +3.7/5.0
- Rent growth +2.5/5.0
- Condition / age +2.5/5.0
- Appreciation +0.0/10.0
$116,900
🖨 Deal sheet 📄 Offer letter ✓ Due diligence
Listing remarks
Located in a quiet cul-de-sac, this 3-bedroom, 2-bath home offers a fenced backyard perfect for relaxing outdoors. Major systems have been updated, including a tankless water heater, furnace, and plumbing providing added efficiency and peace of mind. Also included is automatic heat tape designed to help prevent pipes freezing in the winter. Nearby community playground, tennis courts, and basketball courts offer great options for fun! Located close to parks, schools, restaurants, and shopping, this home combines comfort, convenience, and a peaceful setting.
Key facts
- Community playground
- Tennis courts
- Cul-de-sac
Tags
Property features AI
Finance
- HOA & community: Has association
Exterior
- Parking: Paved parking
- Utilities: Public water; Public sewer
- Home design: Manufactured home; Single-story (manufactured); Pillar/post/pier foundation; Composition roof; T1-11 exterior siding
- Construction: T1-11 construction material; Composition roof; Pillar/Post/Pier foundation; Manufactured structure
- Exterior features: Covered porch; Covered deck; Fruit trees; Outdoor lighting; Rain gutters; Lawn; Full fencing; Publicly maintained paved road; Open, level lot on a cul-de-sac; Views
Interior
- Kitchen: Electric range; Refrigerator; Dishwasher; Gas water heater
- Bedrooms: 3 main-level bedrooms
- Flooring: Laminate flooring; Carpet
- Bathrooms: 2 main-level bathrooms
- Heating & cooling: Natural gas and electric heating; Forced air furnace
- Interior features: Washer hookup; Crawl space basement
- Laundry & utility: Electric dryer hookup; Washer hookup
Neighborhood map
What this means for you Summary
Snapshot
- This is a 3-bed/2.0-bath manufactured listed at $117k.
Deal economics
- At list price, monthly cash flow is $152 ($2k/yr) — positive.
- The deal already cash-flows at list — no discount required.
- Meets the 1% rule at list price ($2k rent vs $117k).
- Recommended offer: $106k (9.0% below list) — sets the bar for market timing.
- Cap rate 12.2% vs local median 1.3% in Rathdrum — top-decile yield for the area; either an underpriced asset or a hidden risk that comps aren't pricing in. Stress-test before assuming the spread holds.
Location & tenants
- Location reads 74/100 on livability (#30 in ID, #4,401 nationally) — a middle-class / working-renter tenant base. Strengths: crime A+, housing A+, health & safety B; Watch: amenities F, commute F.
- Lakeland District (rural): math 41% / reading 57% proficiency, ranked #34 of 92 in ID (top 37%) — families likely to look elsewhere, expect single-tenant / working-renter base with shorter leases.
- Market conditions: 524 active listings in the ZIP; 6 comparable units currently listed for rent nearby; rentals leasing fast (median 13d on market — plan ~1-2 weeks tenant-placement turnaround); 1,606 units permitted in Kootenai County in 2024 (154 in 5+ unit buildings).
Forward outlook
- Local home prices are declining (-3.0%/yr); year-one equity from $808 of loan paydown is wiped out by about $4k of value loss. Plan a longer hold.
- Kootenai County population projected at +33% by 2050 — long-run rental-demand tailwind backs the buy-and-hold thesis.
Negotiation context
- It's been on market 100 days — a 9% lower offer ($106k) is reasonable based on typical stale-listing flexibility.
- 7 sale attempts since 6y ago with the ask held roughly flat each time — persistent listings suggest the price (not the market) is what's stuck; bring a comps-based counter.
Risks & watch-outs
- Watch-outs: flood insurance adds $427/mo.
- Climate carrying-cost: in FEMA flood zone AE (mandatory federal flood insurance); major wildfire risk — expect insurance premiums to compound above CPI over the hold.
Questions for the listing agent
- It's been on market 100 days. Have you received any prior offers? Is the seller open to a 9% concession, seller financing, or rate buy-down credit?
- What's the actual annual flood-insurance premium (NFIP or private), and is the property in a SFHA with mandatory coverage?
- Why hasn't it sold? Are there any deal-killer items the seller is aware of (foundation, flood, title, zoning, code violations)?
- Is there a deadline driving the sale (1031 exchange, divorce, estate, relocation)? That informs how much negotiation room exists.
- What's the average days-on-market for RENTAL listings here right now (not sales)? A rising rental-DOM trend means longer vacancies and softer asking-rent achievability than the comps imply.
- What's the recent tenant-quality profile in this submarket — average credit score on applications, eviction rate, late-payment / NSF rate, and stable-employment percentage? A property-management company in the area should have these aggregated.
- How much new for-sale + rental construction is in the pipeline within 1–3 miles? Heavy new supply typically softens prices + rents 12–24 months out; constrained supply supports both.
Investment metrics
- 1% rule
- 1.50% ✓
- Cap rate
- 12.23%
- Cash-on-cash
- 21.21%
- DSCR
- 1.94
- GRM
- 5.6
CMA / ARV
No comps found within radius.
Projected returns pro-forma
-3.0% appreciation · 3.0% rent growth · sell at horizon
- IRR
- -7.4%
- Equity multiple
- 0.73×
- Total profit
- $-8,967
- Equity at exit
- $17,430
- IRR
- 2.5%
- Equity multiple
- 1.18×
- Total profit
- $5,837
- Equity at exit
- $10,107
Cash invested: $32,732 (down + closing). Projections, not guarantees.
Landlord ↔ Tenant lean methodology
- Overall (STATE)
- 91 Strongly Landlord-Friendly
- State Idaho
- 91 Strongly Landlord-Friendly · R+18
- County
- — inherits STATE
- City
- — inherits STATE
ZIP-level market 83858
- Home prices YoY
- -22.0%
- Active inventory
- 524
- Price-to-rent
- 5.6×
Monthly cashflow live
- Estimated rent
- $1,755 high interval (Pro) →
- Mortgage (P&I)
- −$613
- Tax est. 1.5%
- −$146 /mo · $1,754/yr
- Insurance
- −$49
- Flood insurance flood zone
- −$427 /mo · $5,118/yr
- HOA
- −$0
- Vacancy / Maint / Mgmt
- −$369
- Net cashflow
- $152
Break-even live
UW: 25.0% down · 7.5% · 30yr · 1.5% tax · 5.0% vac · 8.0% maint · 8.0% mgmt
Financing live
Cash to close
- Down payment
- $29,225
- Closing costs
- $3,507
- Reserves months
- —
- Total cash needed
- —
Loan-product check · same deal, 3 products live
Conventional
25% down · 7.5% · 30yr
- Down + closing
- —
- Monthly P&I
- —
- Monthly cashflow
- —
- DSCR
- —
- Eligible?
- —
Personal DTI + credit; lowest rate.
DSCR
20% down · 8.5% · 30yr
- Down + closing
- —
- Monthly P&I
- —
- Monthly cashflow
- —
- DSCR
- —
- Eligible?
- —
No personal income docs; deal must DSCR.
Hard money
10% down · 12.0% · 12mo
- Down + closing
- —
- Monthly P&I
- —
- Monthly cashflow
- —
- DSCR
- —
- Eligible?
- —
Short-term bridge; refi at stabilization.
Rent comps 6 comps
| Address | Beds | Baths | Sqft | Rent | $/sqft | DOM | Units | Dist |
|---|---|---|---|---|---|---|---|---|
| 15170 N Stevens St Rathdrum, ID | 3.0 | 2.5 | 1450 | $1,975 | $1.36 | 20d | 1 | 0.61mi |
| 7282 W Lakeland St Rathdrum, ID | 3.0 | 2.0 | 1226 | $1,725 | $1.41 | 13d | 1 | 0.81mi |
| 7164 E Winchester St Unit 1 Rathdrum, ID | 3.0 | 1.0 | 1350 | $1,650 | $1.22 | 13d | 1 | 0.85mi |
| 7808 W Kayak Ct Post Falls, ID | 3.0 | 2.0 | 1171 | $2,200 | $1.88 | 13d | 1 | 0.93mi |
| 6923 Silverado St Unit D208 Rathdrum, ID | 2.0 | 2.0 | 1080 | $1,400 | $1.30 | 13d | 1 | 1.09mi |
| 7005 W Timberline St Unit B Rathdrum, ID | 2.0 | 1.0 | 850 | $1,350 | $1.59 | 20d | 1 | 1.27mi |
Listing history 39 events
-
2026-06-19days on market $116,900 Active 100 DOM
-
2026-06-18days on market $116,900 Active 99 DOM
-
2026-06-17days on market $116,900 Active 98 DOM
-
2026-06-16days on market $116,900 Active 97 DOM
-
2026-06-15days on market $116,900 Active 96 DOM
-
2026-06-14days on market $116,900 Active 94 DOM
-
2026-06-13days on market $116,900 Active 93 DOM
-
2026-06-10days on market $116,900 Active 91 DOM
-
2026-06-09days on market $116,900 Active 90 DOM
-
2026-06-09price $116,900 Active 89 DOM
-
2026-06-08days on market $119,900 Active 89 DOM
-
2026-06-07days on market $119,900 Active 88 DOM
-
2026-06-02days on market $119,900 Active 83 DOM
-
2026-06-01days on market $119,900 Active 82 DOM
-
2026-05-31days on market $119,900 Active 81 DOM
-
2026-05-30days on market $119,900 Active 80 DOM
-
2026-03-11$119,900 Active
-
2023-12-07price $139,000
-
2023-12-01price $149,000
-
2023-11-16price $152,500
-
2023-09-25price $154,900
-
2023-09-04$157,000 Active
-
2022-10-23price $115,000
-
2022-10-23status Active
-
2022-10-15status Pending
-
2022-09-29price $157,000
-
2022-09-21price $162,900
-
2022-09-16price $165,000
-
2022-09-01price $167,500
-
2022-08-29price $170,000
-
2022-08-23$175,000 Active
-
2022-04-11status Pending
-
2022-03-28price $155,000
-
2022-03-16status Active
-
2022-03-14status Pending
-
2022-03-10$159,900 Active
-
2020-04-08soldstatus Closed
-
2020-03-26status Pending
-
2020-03-23$49,000 Active
ⓘ Source: listings_history table (triggers on properties + properties_extension) + one-shot
backfill from property_details.listing_events for pre-trigger history.
Climate risk First Street
- Flood 9/10 Extreme FEMA zone AE · 99% chance over 30 yrs
- Wildfire 6/10 Major
- Heat 2/10 Low 7 d/yr ≥92°F today · 15 d/yr by 30 yrs out
- Wind 1/10 Low
- Air quality 8/10 Severe 15 unhealthy d/yr today · 16 by 30 yrs out
Nearby sold comps map
Loading sold comps map…
Walkable amenities ~0.75 mi
Loading nearby amenities…
Taxation est. · year 1
- Rental income
- $21,061
- − Mortgage interest
- −$6,548
- − Property taxes
- −$1,754
- − Insurance
- −$5,703
- − Repairs & maintenance
- −$1,685
- − Management
- −$1,685
- − Depreciation
- −$3,401
- Taxable income
- $286
- Est. tax owed @ 24.0%
- −$69
- After-tax cash flow
- $1,757/yr
For passive investors: Depreciation is non-cash, so a rental often shows a tax loss while cash-flowing — sheltering income. Rental losses are passive: they offset passive income freely, and up to $25,000/yr can offset ordinary (W-2) income if you actively participate and your MAGI is under $100k (phasing out to $0 by $150k); unused losses carry forward. On sale, claimed depreciation is recaptured at up to 25%, and gains may owe capital-gains tax (a 1031 exchange can defer both). Figures are a year-1 estimate at your 24.0% rate — not tax advice; consult a CPA.
Schools (NCES district)
- District
- Lakeland District
- NCES district ID
- 1601800
- Math proficiency
- 41% ▼ -6.00%
- Reading proficiency
- 57% ▼ -2.00%
- Median HH income
- $52,454
- Composite
- 42.13/100
- National rank
- #3310
- State rank
- #34 of 92 in ID
Livability — Rathdrum
- Score
- 74/100
- State rank
- #30
- US rank
- #4401
Category grades
Schools grade is shown separately in the Schools card above.
Census & demographics
- Census place
- Rathdrum, ID
- Population (ZIP)
- 19,315
Population outlook (Kootenai County) Hauer SSP2
- Today (2025)
- 177,692 people
- By 2030
- 190,689 · +7.3%
- By 2040
- 214,704 · +20.8%
- By 2050
- 236,510 · +33.1%
- By 2075
- 285,984 · +60.9%
- By 2100
- 316,459 · +78.1%
Race, ethnicity, and origin ACS 2023
- Neighborhood character
- Predominantly White (86%)
- Race & ethnicity
- White 86% Two or more races 10% Hispanic / Latino 7%
- Hispanic origin (detail)
- Mexican 5%
- Common ancestry
- Portuguese 6% Slovak 4% Italian 3%
- Foreign-born
- 2% · Canada
- Languages at home
- 95% English-only · Spanish 3% Russian/Polish/Slavic 0%
Political lean MEDSL · Kootenai
- 2024 margin
- Solid R (+51.9) · D 22.9% · R 74.8% · Other 2.2%
- 2008→2024 swing
- -25.6pp toward R · 2008: -26.3pp · 2024: -51.9pp
- All cycles
- 2024: R+51.9 2020: R+42.9 2016: R+42.5 2012: R+34.3 2008: R+26.3
Not yet ingested
- Civics
- —
Market trends
- HPI YoY
- ▼ -75.25%
- Current HPI
- 266.5011
- Rent YoY
- —
- Metro
- —
- State GDP YoY
- ▲ 4.51%
- F500 in state
- 6
Industry mix (Fortune 500 HQ in ID)
| Industry | F500 HQs | Revenue |
|---|---|---|
| Retail | 1 | $79B |
|
||
| Technology | 1 | $25B |
|
||
| Food / Agriculture | 1 | $6B |
|
||
Price history
+144.7% since first listed23 events — show timeline
- 2026-03-11 Listed $119,900 CDAMLS
- 2023-12-07 Price Changed $139,000 CDAMLS
- 2023-12-01 Price Changed $149,000 CDAMLS
- 2023-11-16 Price Changed $152,500 CDAMLS
- 2023-09-25 Price Changed $154,900 CDAMLS
- 2023-09-04 Listed $157,000 CDAMLS
- 2022-10-23 Price Changed $115,000 CDAMLS
- 2022-10-23 Relisted — CDAMLS
- 2022-10-15 Pending — CDAMLS
- 2022-09-29 Price Changed $157,000 CDAMLS
- 2022-09-21 Price Changed $162,900 CDAMLS
- 2022-09-16 Price Changed $165,000 CDAMLS
- 2022-09-01 Price Changed $167,500 CDAMLS
- 2022-08-29 Price Changed $170,000 CDAMLS
- 2022-08-23 Listed $175,000 CDAMLS
- 2022-04-11 Pending — CDAMLS
- 2022-03-28 Price Changed $155,000 CDAMLS
- 2022-03-16 Relisted — CDAMLS
- 2022-03-14 Pending — CDAMLS
- 2022-03-10 Listed $159,900 CDAMLS
- 2020-04-08 Sold (MLS) — CDAMLS
- 2020-03-26 Pending — CDAMLS
- 2020-03-23 Listed $49,000 CDAMLS
Cash-flow waterfall
monthlySold comps — $/sqft
last 12 mo · ≤1 miLoading sold comps…