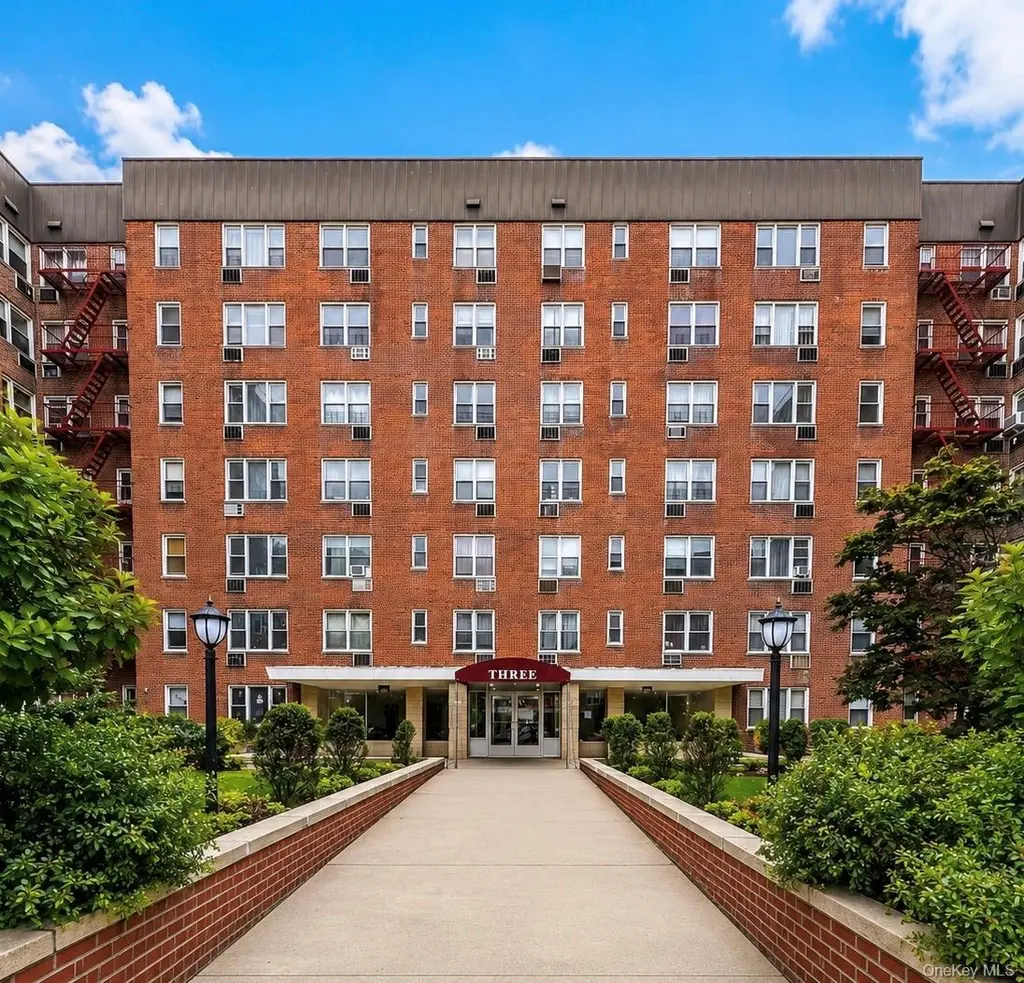
3 Sadore Ln Unit 3G · Yonkers, NY
Flood risk 9/10 · Severe
- FEMA flood zone
- X (unshaded)
- Chance of flooding over 30 yrs
- 0.99%
- Est. flood insurance / yr
- $507 – $1,088
Fire risk 3/10 · Minor
- Est. fire insurance / yr
- $691 – $1,283
Heat risk 6/10 · Moderate
- Hot days now (above 99°F)
- 7 days/yr
- Hot days in 30 yrs
- 15 days/yr
Wind risk 6/10 · Moderate
- Chance of severe wind over 30 yrs
- 27.0%
Air-quality risk 4/10 · Minor
- Unhealthy air days now
- 3 days/yr
- Unhealthy air days in 30 yrs
- 5 days/yr
Risk factors via First Street. Map © Google.
Why this score? — see what drove the F grade
The composite is a weighted blend of 9 inputs, each scored 0–100. Each bar is that input's sub-score; the figure is the points it added to the 100-point composite (weight × sub-score).
- ARV discount +7.5/15.0
- Cash flow +6.9/30.0
- 1% rule +5.4/10.0
- Schools +4.1/10.0
- Livability +3.4/5.0
- Rent growth +2.5/5.0
- Condition / age +2.5/5.0
- DSCR +1.1/10.0
- Appreciation +0.0/10.0
$269,999
🖨 Deal sheet 📄 Offer letter ✓ Due diligence
Listing remarks MLS
Lovely Immaculate 2BR at Sadore Lane Estates with parking!!! Featuring newer Eat-In-Kit with granite counter tops, stainless steel appliances, renovated bath, floor moldings, crown molding in living room, upgraded electrical and more!! Move right in!! Assigned parking spot, low maint and more make this an inviting home! Beautifully landscaped complex offers Olympic sized pool and playground, park bench sitting areas, low maint, On-site Management and renting allowed! "Pics are taken prior to owners's move out" Conveniently located-Steps to NYC exp bus & all major highways with Miles of shopping on Central ave and RidgeHill are the many perks for this great complex and location! Verizon fios & cable ready. renting allowed - Low maint approx. 525 with star - Pics taken prior to owners moving out
Key facts
- Parking
- Built 1960
- Listed 15 days
Property features AI
Finance
- Other: Living area reported as 1000 (source: Other)
- HOA & community: Building has elevator(s)
Exterior
- Parking: Assigned parking (1 space); Parking fee required
- Utilities: Con Edison electric; Public sewer; Cable connected; Electricity connected; Natural gas connected; Phone connected; Sewer connected; Public trash collection; Water connected
- Home design: Stock cooperative; One-level unit; Located on third entry level; Seven-story building
- Construction: Brick construction; Actual property condition
- Exterior features: Brick construction; Not waterfront; Sidewalks
Interior
- Kitchen: Dishwasher; Range; Refrigerator; Stainless steel appliances
- Bedrooms: Unit on entry level 3
- Bathrooms: 1 full bathroom
- Heating & cooling: Steam heat; Wall/window air conditioning unit(s)
- Interior features: Crown molding; Entrance foyer; Granite counters; Elevator access; No dogs allowed
- Laundry & utility: Common area laundry
Neighborhood map
What this means for you Summary
Snapshot
- This is a 2-bed/1.0-bath condo listed at $270k.
Deal economics
- At list price, monthly cash flow is $-480 ($-6k/yr) — negative.
- The deal already cash-flows at list — no discount required.
- Meets the 1% rule at list price ($3k rent vs $270k).
- Recommended offer: $266k (1.5% below list) — sets the bar for market timing.
Location & tenants
- Location reads 68/100 on livability (#528 in NY) — a middle-class / working-renter tenant base. Strengths: employment A, commute B; Watch: amenities F, cost of living F.
- Yonkers City School District (suburban): math 41% / reading 54% proficiency, ranked #413 of 590 in NY (top 70%) — families likely to look elsewhere, expect single-tenant / working-renter base with shorter leases; 64% free/reduced lunch — lower-income household profile, screen leases tightly.
- Zoned schools: Yonkers Early Childhood Academy (327 students, 72% FRL); Yonkers Middle School (math 17% / reading 37%, grade F, #587 of 729 statewide, top 81%, 601 students, 88% FRL); Yonkers High School (math 92% / reading 88%, grade A+, #238 of 1,100 statewide, top 23%, 1,060 students, 76% FRL) — zoned schools average 79% FRL vs 64% district-wide (15 pts higher); higher-poverty schools than district average — tighter screening recommended.
- Market conditions: 163 active listings in the ZIP; 32 comparable units currently listed for rent nearby; rentals at typical pace (median 25d on market — plan ~3-4 weeks tenant-placement turnaround); solid renter incomes; 954 units permitted in Westchester County in 2024 (649 in 5+ unit buildings).
- This rent runs 31% of the median local income ($109k/yr) — at the standard rent-burdened threshold; future hikes will face affordability resistance.
Forward outlook
- Local home prices are declining (-3.0%/yr); year-one equity from $2k of loan paydown is wiped out by about $8k of value loss. Plan a longer hold.
- Westchester County population projected at +10% by 2050 — modest demand growth; plan on rents tracking national, not racing it.
Negotiation context
- It's been on market 15 days — a 2% lower offer ($266k) is reasonable based on typical stale-listing flexibility.
- 4 sale attempts since 11y ago with the ask held roughly flat each time — persistent listings suggest the price (not the market) is what's stuck; bring a comps-based counter.
Risks & watch-outs
- Watch-outs: flood insurance adds $66/mo; HOA is 27% of rent.
- Climate carrying-cost: severe flood risk; major wind risk, 27% chance of damaging wind over 30y; extreme-heat days projected 7→15/yr by 2055 (HVAC capex compounding) — expect insurance premiums to compound above CPI over the hold.
Questions for the listing agent
- What do current leases actually rent for vs. the listed asking? Can we see a recent rent roll and the last 12 months of T-12 income?
- Built in 1960 — when were the roof, HVAC, electrical panel, plumbing, and water heater last replaced?
- What's the actual annual flood-insurance premium (NFIP or private), and is the property in a SFHA with mandatory coverage?
- What does the HOA fee cover, when was the last increase, and are there any pending special assessments or reserve-fund shortfalls?
- Any open or pending special assessments — roof, HVAC, plumbing, elevator, façade? What's the per-unit balance and payoff schedule, and is the seller paying it off at close or rolling it to the buyer?
- Is there a deadline driving the sale (1031 exchange, divorce, estate, relocation)? That informs how much negotiation room exists.
- The area grade is low — what's the realistic commute time and amenity access for the typical tenant pool here? Any planned neighborhood developments (good or bad) we should know about?
- What's the average days-on-market for RENTAL listings here right now (not sales)? A rising rental-DOM trend means longer vacancies and softer asking-rent achievability than the comps imply.
- What's the recent tenant-quality profile in this submarket — average credit score on applications, eviction rate, late-payment / NSF rate, and stable-employment percentage? A property-management company in the area should have these aggregated.
- How much new apartment / multifamily construction is in the pipeline within 1–3 miles? Heavy new supply (>2% of stock underway) typically softens rents 12–24 months out; light construction supports rent growth.
Investment metrics
- 1% rule
- 1.04% ✓
- Cap rate
- 4.46%
- Cash-on-cash
- -6.56%
- DSCR
- 0.71
- GRM
- 8.0
CMA / ARV
No comps found within radius.
Projected returns pro-forma
-3.0% appreciation · 3.0% rent growth · sell at horizon
- IRR
- -29.3%
- Equity multiple
- 0.02×
- Total profit
- $-73,756
- Equity at exit
- $40,258
- IRR
- -28.5%
- Equity multiple
- -0.34×
- Total profit
- $-101,337
- Equity at exit
- $23,345
Cash invested: $75,600 (down + closing). Projections, not guarantees.
Landlord ↔ Tenant lean methodology
- Overall (CITY)
- 5 Strongly Tenant-Friendly
- State New York
- 15 Strongly Tenant-Friendly · D+10
- County
- — inherits STATE
- City Yonkers
- 5 Strongly Tenant-Friendly · D+20
ZIP-level market 10710
- Active inventory
- 163
- Price-to-rent
- 8.0×
Monthly cashflow live
- Estimated rent
- $2,798 high interval (Pro) →
- Mortgage (P&I)
- −$1,416
- Tax est. 1.5%
- −$337 /mo · $4,050/yr
- Insurance
- −$112
- Flood insurance flood zone
- −$66 /mo · $798/yr
- HOA est. from 2 same-building comps
- −$758
- Vacancy / Maint / Mgmt
- −$588
- Net cashflow
- $-480
Break-even live
UW: 25.0% down · 7.5% · 30yr · 1.5% tax · 5.0% vac · 8.0% maint · 8.0% mgmt
Financing live
Cash to close
- Down payment
- $67,500
- Closing costs
- $8,100
- Reserves months
- —
- Total cash needed
- —
Loan-product check · same deal, 3 products live
Conventional
25% down · 7.5% · 30yr
- Down + closing
- —
- Monthly P&I
- —
- Monthly cashflow
- —
- DSCR
- —
- Eligible?
- —
Personal DTI + credit; lowest rate.
DSCR
20% down · 8.5% · 30yr
- Down + closing
- —
- Monthly P&I
- —
- Monthly cashflow
- —
- DSCR
- —
- Eligible?
- —
No personal income docs; deal must DSCR.
Hard money
10% down · 12.0% · 12mo
- Down + closing
- —
- Monthly P&I
- —
- Monthly cashflow
- —
- DSCR
- —
- Eligible?
- —
Short-term bridge; refi at stabilization.
Rent comps 32 comps
| Address | Beds | Baths | Sqft | Rent | $/sqft | DOM | Units | Dist |
|---|---|---|---|---|---|---|---|---|
| 4 Sadore Ln Unit 2W Yonkers, NY | 1.0 | 1.0 | 800 | $2,000 | $2.50 | 17d | 1 | 0.06mi |
| 1549 Central Park Ave Yonkers, NY | 2.0 | 1.0 | 850 | $2,400 | $2.82 | 44d | 1 | 0.27mi |
| 12 Wainwright Ave Apt 1B Yonkers, NY | 1.0 | 1.0 | 700 | $1,950 | $2.79 | 44d | 1 | 0.32mi |
| 42 Winchester Ave Unit 2A Yonkers, NY | 1.0 | 1.0 | 700 | $2,100 | $3.00 | 14d | 1 | 0.47mi |
| 128 Colonial Pkwy Unit 3B Yonkers, NY | 1.0 | 1.0 | 871 | $2,750 | $3.16 | 44d | 1 | 0.58mi |
| 355 Bronxville Rd Bronxville, NY | 3.0 | 2.0 | 968 | $3,400 | $3.51 | 24d | 1 | 0.72mi |
| 1 Elm St Unit 3B Tuckahoe, NY | 2.0 | 1.0 | 1100 | $3,200 | $2.91 | 7d | 1 | 0.77mi |
| 1 Elm St Unit 3B Tuckahoe, NY | 2.0 | 1.0 | 1100 | $3,200 | $2.91 | 10d | 1 | 0.77mi |
| 21 Scarsdale Rd Yonkers, NY | 2.0 | 1.0 | 835 | $4,600 | $5.51 | 2d | 21 | 0.80mi |
| 70 Roundhill Dr Yonkers, NY | 2.0 | 1.0 | 775 | $3,200 | $4.13 | 44d | 1 | 0.81mi |
| 601 Ridge Hill Blvd Yonkers, NY | 2.0 | 1.0–2.0 | 819 | $4,600 | $5.61 | 7d | 14 | 0.83mi |
| 70 Lake Ave Unit 1 Tuckahoe, NY | 3.0 | 2.5 | 1200 | $4,995 | $4.16 | 11d | 1 | 0.85mi |
| 111 Kensington Rd Unit 8 Bronxville, NY | 1.0 | 1.0 | 825 | $2,650 | $3.21 | 13d | 1 | 0.87mi |
| 7 Oak Ave Tuckahoe, NY | 2.0 | 1.0 | 1200 | $2,500 | $2.08 | 44d | 1 | 0.88mi |
| 11 Oak Ave Unit 1 Bronxville, NY | 3.0 | 2.0 | 1400 | $4,300 | $3.07 | 44d | 1 | 0.88mi |
| 64 Kensington Rd Apt 1A Bronxville, NY | 1.0 | 1.0 | 800 | $2,895 | $3.62 | 11d | 1 | 0.90mi |
| 64 Sagamore Rd Unit A6 Bronxville, NY | 1.0 | 1.0 | 850 | $2,900 | $3.41 | 4d | 1 | 0.99mi |
| 50 Columbus Ave Unit 817 Tuckahoe, NY | 1.0 | 1.0 | 750 | $3,000 | $4.00 | 22d | 1 | 1.02mi |
| 2 Consulate Dr Unit 1J Tuckahoe, NY | 1.0 | 1.0 | 750 | $2,700 | $3.60 | 12d | 1 | 1.06mi |
| 39 Maynard St Unit 2E Tuckahoe, NY | 2.0 | 1.0 | 875 | $2,650 | $3.03 | 44d | 1 | 1.09mi |
| 156 Wallace St Unit 1 Tuckahoe, NY | 2.0 | 2.0 | 1300 | $3,300 | $2.54 | 24d | 1 | 1.14mi |
| 278 Mile Square Rd Yonkers, NY | 2.0 | 1.0 | 1000 | $2,650 | $2.65 | 44d | 1 | 1.16mi |
| 433 Palmer Rd Unit Second Fl Yonkers, NY | 3.0 | 1.5 | 1400 | $3,500 | $2.50 | 44d | 1 | 1.17mi |
| 60 Washington St Unit 2 Tuckahoe, NY | 3.0 | 2.0 | 1500 | $4,800 | $3.20 | 24d | 1 | 1.18mi |
| 54 Washington St Unit 2nd Floor Tuckahoe, NY | 3.0 | 2.0 | 1250 | $3,900 | $3.12 | 6d | 1 | 1.18mi |
| 23 Belknap Ave Yonkers, NY | 1.0 | 1.0 | 700 | $2,300 | $3.29 | 24d | 1 | 1.19mi |
| 51 Parkway Rd Apt 3 Bronxville, NY | 1.0 | 1.0 | 1100 | $3,100 | $2.82 | 24d | 1 | 1.29mi |
| 212 Alpine Pl Tuckahoe, NY | 1.0 | 1.0 | 700 | $2,700 | $3.86 | 20d | 1 | 1.30mi |
| 40 Jackson Ave Eastchester, NY | 1.0 | 1.0 | 725 | $2,950 | $4.07 | 15d | 1 | 1.30mi |
| 246 Stone Ave Yonkers, NY | 3.0 | 1.0 | 900 | $3,300 | $3.67 | 4d | 1 | 1.33mi |
| 47 Morgan St Eastchester, NY | 2.0 | 1.0 | 1000 | $4,000 | $4.00 | 44d | 1 | 1.38mi |
| 4 Fowler Ave Unit 1 floor Yonkers, NY | 2.0 | 1.0 | 1400 | $2,700 | $1.93 | 44d | 1 | 1.42mi |
HOA detail condo
- Monthly dues
- $0 · $0/yr
- Likely covers
- electriccablepoolparking
- Assessments
- None detected in remarks — confirm with the listing agent.
Listing history 10 events
-
2026-06-18days on market $269,999 Active 15 DOM
-
2026-06-17days on market $269,999 Active 14 DOM
-
2026-06-16days on market $269,999 Active 13 DOM
-
2026-06-15days on market $269,999 Active 12 DOM
-
2026-06-13days on market $269,999 Active 10 DOM
-
2026-06-09days on market $269,999 Active 6 DOM
-
2026-06-08days on market $269,999 Active 5 DOM
-
2026-06-07days on market $269,999 Active 4 DOM
-
2026-06-04remarks 611-char remark
-
2026-06-04$269,999 Active 1 DOM
ⓘ Source: listings_history table (triggers on properties + properties_extension) + one-shot
backfill from property_details.listing_events for pre-trigger history.
Climate risk First Street
- Flood 9/10 Extreme FEMA zone X (unshaded) · 99% chance over 30 yrs
- Wildfire 3/10 Moderate
- Heat 6/10 Major 7 d/yr ≥99°F today · 15 d/yr by 30 yrs out
- Wind 6/10 Major 27% chance of damaging wind over 30 yrs
- Air quality 4/10 Moderate 3 unhealthy d/yr today · 5 by 30 yrs out
Nearby sold comps map
Loading sold comps map…
Walkable amenities ~0.75 mi
Loading nearby amenities…
Taxation est. · year 1
- Rental income
- $33,579
- − Mortgage interest
- −$15,124
- − Property taxes
- −$4,050
- − Insurance
- −$2,147
- − Repairs & maintenance
- −$2,686
- − Management
- −$2,686
- − HOA
- −$9,096
- − Depreciation
- −$7,855
- Taxable loss
- −$10,065
- Est. tax savings @ 24.0%
- +$2,416
- After-tax cash flow
- $-3,341/yr
For passive investors: Depreciation is non-cash, so a rental often shows a tax loss while cash-flowing — sheltering income. Rental losses are passive: they offset passive income freely, and up to $25,000/yr can offset ordinary (W-2) income if you actively participate and your MAGI is under $100k (phasing out to $0 by $150k); unused losses carry forward. On sale, claimed depreciation is recaptured at up to 25%, and gains may owe capital-gains tax (a 1031 exchange can defer both). Figures are a year-1 estimate at your 24.0% rate — not tax advice; consult a CPA.
Schools (NCES district)
- District
- Yonkers City School District
- NCES district ID
- 3631920
- Math proficiency
- 41% ▼ -1.00%
- Reading proficiency
- 54% ▲ 14.00%
- Median HH income
- $58,042
- Composite
- 41.43/100
- National rank
- #3471
- State rank
- #413 of 590 in NY
Livability — Yonkers
- Score
- 68/100
- State rank
- #528
- US rank
- #9394
Category grades
Schools grade is shown separately in the Schools card above.
Census & demographics
- Census place
- Yonkers, NY
- County
- Westchester County · 709,332 people
- City population
- 212,407
- Metro
- New York-Newark-Jersey City, NY-NJ-PA
- Population (ZIP)
- 25,855
- Household income
- $108,845
- Rent vs Own
- Severe rent burden
- 920.0
Population outlook (Westchester County) Hauer SSP2
- Today (2025)
- 1,028,035 people
- By 2030
- 1,051,636 · +2.3%
- By 2040
- 1,098,520 · +6.9%
- By 2050
- 1,136,044 · +10.5%
- By 2075
- 1,196,925 · +16.4%
- By 2100
- 1,175,147 · +14.3%
Race, ethnicity, and origin ACS 2023
- Neighborhood character
- Highly diverse neighborhood (Simpson 0.72)
- Race & ethnicity
- White 39% Hispanic / Latino 30% Black 14% Two or more races 12% Asian 11% Native American 2%
- Hispanic origin (detail)
- Mexican 1% Puerto Rican 9% Dominican 9%
- Common ancestry
- Romanian 2% Scotch-Irish 1% Hispanic 1%
- Foreign-born
- 26% · Canada, Jamaica, China
- Languages at home
- 64% English-only · Spanish 18% Other Indo-European 6% Other Asian/Pacific 5%
Political lean MEDSL · Westchester
- 2024 margin
- Strong D (+26.3) · D 63.1% · R 36.9%
- 2008→2024 swing
- -1.3pp toward R · 2008: 27.6pp · 2024: 26.3pp
- All cycles
- 2024: D+26.3 2020: D+36.3 2016: D+32.8 2012: D+22.2 2008: D+27.6
Not yet ingested
- Civics
- —
Market trends
- HPI YoY
- ▼ -622.30%
- Current HPI
- 297.1704
- Rent YoY
- —
- Metro
- New York-Newark-Jersey City, NY-NJ-PA
- State GDP YoY
- ▲ 2.60%
- F500 in state
- 92
Industry mix (Fortune 500 HQ in NY)
| Industry | F500 HQs | Revenue |
|---|---|---|
| Financial Services | 10 | $950B |
|
||
| Consumer Goods | 9 | $162B |
|
||
| Insurance | 4 | $225B |
|
||
| Telecommunications | 2 | $144B |
|
||
| Pharmaceuticals | 2 | $112B |
|
||
| Media / Entertainment | 2 | $69B |
|
||
Price history
+28.6% since first listed10 events — show timeline
- 2026-06-03 Listed $269,999 OneKey® MLS as Distributed by MLS Grid
- 2022-01-27 Sold (MLS) $237,000 OneKey® MLS as Distributed by MLS Grid
- 2021-10-22 Pending — OneKey® MLS as Distributed by MLS Grid
- 2021-09-29 Price Changed $244,900 OneKey® MLS as Distributed by MLS Grid
- 2021-08-16 Listed $249,900 OneKey® MLS as Distributed by MLS Grid
- 2015-08-28 Sold (MLS) $210,000 HGMLS
- 2015-08-27 Sold (MLS) $210,000 OneKey® MLS as Distributed by MLS Grid
- 2015-07-13 Contingent — HGMLS
- 2015-05-05 Listed $210,000 HGMLS
- 2015-05-05 Listed $210,000 OneKey® MLS as Distributed by MLS Grid
Cash-flow waterfall
monthlySold comps — $/sqft
last 12 mo · ≤1 miLoading sold comps…